0994
A diffusion MRI based computer-guided assistance approach for the diagnosis of breast lesions with high accuracy and without the need for contrast agents.Mariko Goto1, Denis Le Bihan1,2, Koji Sakai1, and Kei Yamada1
1Radiology, Kyoto prefectural university of medicine, Kyoto, Japan, 2NeuroSpin, Gif-sur-Yvette, France
Synopsis
This prospective study included 37 patients with 39 breast lesions. DWI images were acquired at 2 b values (200, 1500s/mm²) on a 3T-MRI scanner with a dedicated 16-channel breast coil. From the images a non-Gaussian diffusion based absolute quantitative biomarker, so-called Signature Index (S-index), was calculated by comparing tissue signals to a library of tissue reference signals to provide a classification of tumor types. The median S-index for malignant lesions was significantly higher (p < 0.0001) than for benign lesions, and the overall S-index diagnostic performance was significantly higher than BI-RADS (AUC=0.96 and 0.83, respectively), without contrast agents.
Introduction
Diffusion MRI (or DWI) has been widely used for the diagnosis and monitoring of cancer lesions in many organs, especially the breast 1-3. Beyond the standard ADC, non-Gaussian diffusion parameters provide important information on tissue microstructure 4. However, the accurate estimation of such parameters requires acquisition of images with a large range of diffusion sensitization (so called b values), resulting in long acquisition times. To cut on acquisition and processing times, we have investigated in a cohort of patients with breast lesions a new approach which enables classification of tumor types (e.g. benign or malignant) directly based on their diffusion signal pattern (“signature”) obtained from a very small set signals acquired at “key b values” and a library of reference signals, without calculating diffusion parameters 3.Theory
Using published values for non-Gaussian diffusion parameters in typical malignant and benign lesions obtained in a different center 5, a library of reference DWI signals was built using the IVIM/Kurtosis diffusion model 5 at Lb = 200 and Hb = 1500s/mm² (“key b values” chosen to maximize signal sensitivity to tissue structural changes through non-Gaussian diffusion 5. The Signature Index (S-index) is calculated from the relative distance, dS, between tissue (T) and reference (malignant/benign, M/B) signals at those key b values as 3: $$$SI(T)={max([dST(Hb)-dSV(Lb)]/[dSM(Hb)-dSM(Lb)],0) - [max(dSV(Hb)-dSV(Lb)]/[dSM(Hb)-dSM(Lb)],0)}$$$ SI > 0 for malignant tissues (1 for “typical” malignant), SI < 0 for benign tissues (-1 for “typical” benign) and SI = 0 for a neutral (undetermined) tissue. The SI scale was further linearly scaled to give a S-index centered at 50, so that S-index = 75 for a typical malignant tissue and S-index = 25 for a typical benign tissue. For normal tissues S-index~ 0-20, while in very malignant tissues S-index > 100.Material and Methods
This study included 37 consecutive patients with 39 breast lesions (28 malignant with 24 invasive cancer/11 benign). MRI data was acquired using a 3T system (MAGNETOM Skyra; Siemens AG) with a dedicated 16-channel breast coil. DWI were obtained with the following parameters: b values = 0, 200 and 1500 sec/mm2; repetition time/echo time; 10400/61 ms; FOV: 320 mm; matrix: 160 x 160 mm; slice thickness; 3 mm, parallel imaging factor; 2 and total scan time; 2.1 min. Three acquisitions were made and signal were averaged-out to increase the SNR. The processing algorithm was implemented in Matlab (Mathworks, Natick, MA) and comprised the following steps: 1. Calculation of the S-index; 2. 3D clustering to remove/correct spurious or isolated voxels. The algorithm outputs consisted in S-index statistics in manually multislice (3D) drawn ROIs and color-encoded S-index maps with 3D renderings of the lesions. Dynamic contrast enhanced (DCE) MRI was performed before and three times after the bolus injection of contrast agent. DCE MRI parameters were as follows: repetition time/echo time, 3.3/1.4 msec; field of view (FOV), 320 mm; matrix, 352 x 352; and 144 slices; parallel imaging factor, 3; SPAIR; and total scan time, 60 sec. Two radiologists provided BI-RADS categorization with consensus by reviewing DCE MRI. An ROC analysis of the S-index was performed to assess the algorithm performance series and compared to BI-RADS categorization by DCE MRI. Correlations of S-index with histologic prognostic factors (e.g. hormone receptors, HER2 receptors, and Ki-67 index status) were evaluated in invasive cancers.Resuts
Examples of S-index 3D maps are shown in Fig.1 (invasive ductal carcinoma) and Fig.2 (benign phyllodes tumor). The median S-index for malignant and benign lesions was significantly different (p < .0001) with 76.1 (interquartile range (IQR), 74.3-86.8) and 46.2 (IQR, 31.5-62.7) for malignant and benign lesions, respectively (Fig.3A). The overall S index performance (AUC) to recognize malignant and benign lesions was 0.96, significantly higher (p = 0.006) than BI-RADS using DCE MRI (Fig.3B). Among histological prognostic factors, HER2+ invasive cancers had a lower S-index (cutoff = 75, p = 0.01) than HER- cancers, while there was no correlation with Ki-67.Discussion and Conclusion
The S-index, an absolute DWI quantitative biomarker of tissue types, had a higher diagnostic value (based on AUC) than BI-RADS, without the need for contrast agents to separate malignant from benign lesions. Only 2 b values are necessary, cutting in acquisition and processing time compared to approaches based on the estimation of model parameters. 3D analysis of S-index maps allowed to assess lesion heterogeneity, revealing the presence of necrotic or high viability parts within lesions, potentially providing guidance for accurate biopsy spots. Although more work remains to further develop the reference signals database to tumor subtypes and prognostic factors, such as HER2, and to validate the results with larger patient cohorts, this artificial intelligence approach has the potential to provide computer-guided assistance for the diagnosis of breast lesions with high accuracy and without contrast agents.Acknowledgements
No acknowledgement found.References
- Tsushima Y, Takahashi-Taketomi A, Endo K. Magnetic resonance (MR) differential diagnosis of breast tumors using apparent diffusion coefficient (ADC) on 1.5-T. J Magn Reson Imaging. 2009 Aug;30(2):249-55.
- Partridge SC, DeMartini WB, Kurland BF. Differential Diagnosis of Mammographically and Clinically Occult Breast Lesions on Diffusion-Weighted MRI. J Magn Reson Imaging 2010; 31: 562–570.
- Iima M, Le Bihan D. Clinical Intravoxel Incoherent Motion and Diffusion MR Imaging: Past, Present, and Future. Radiology. 2016 Jan;278(1):13-32.
- Jensen JH, Helpern JA. MRI quantification of non-Gaussian water diffusion by kurtosis analysis. NMR in Biomedicine. 2010;23:698-710.
- Iima M, Yano K, Kataoka M, Umehana M, Murata K, Kanao S, Togashi K, Le Bihan D. Quantitative non-Gaussian diffusion and intravoxel incoherent motion magnetic resonance imaging: differentiation of malignant and benign breast lesions. Invest Radiol. 2015 Apr;50(4):205-11.
Figures
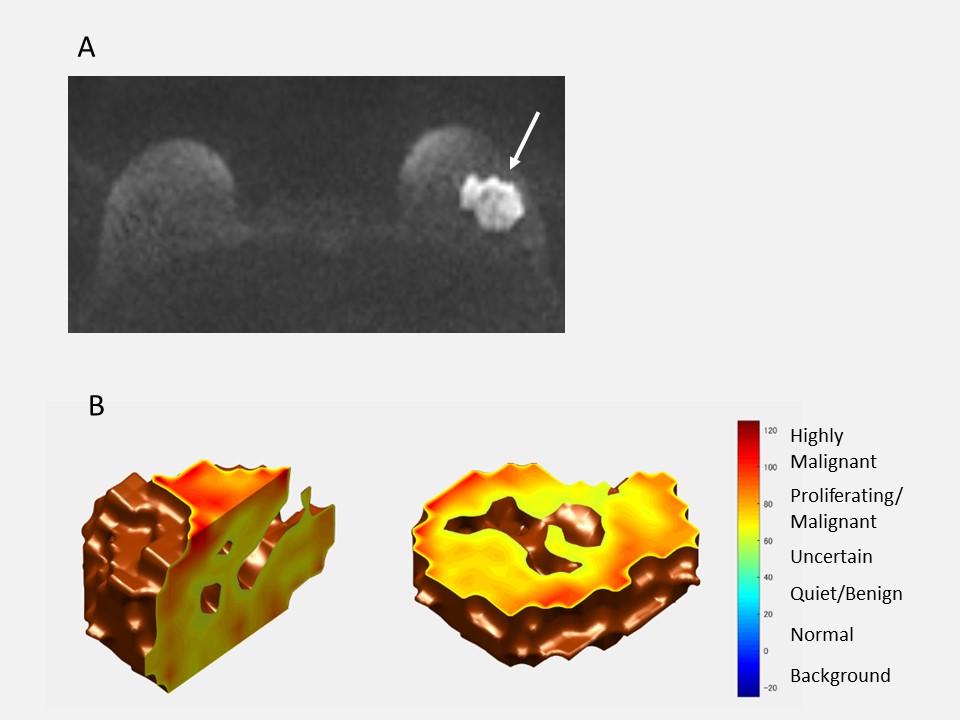
Invasive ductal carcinoma in a 42-year-old woman. DWI (b = 1500sec/mm2)
shows a mass with high signal intensity on the left breast (A, arrow). On the S-index
3D rendering shows most of the tumor (yellow or red color) has a high S-index over 60 (B). The
“hole” in the center of the lesion likely corresponds to a necrotic area.
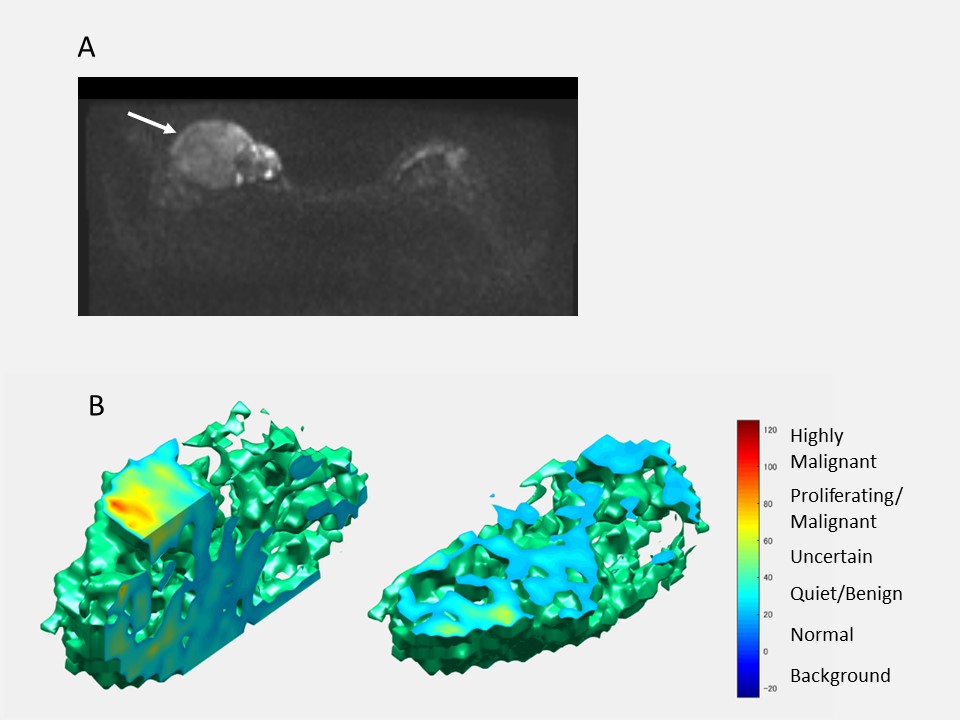
Benign phyllodes tumor in
a 32-year-old woman. DWI (b = 1500sec/mm2)
shows a mass in the right breast (A, arrow). On S-index 3D rendering shows most
of the mass with a blue-green color (S-index under 50) (B). Several hot spots (red or
yellow color) are observed within the tumor, in light with the known high
viability areas present in phyllodes tumors.
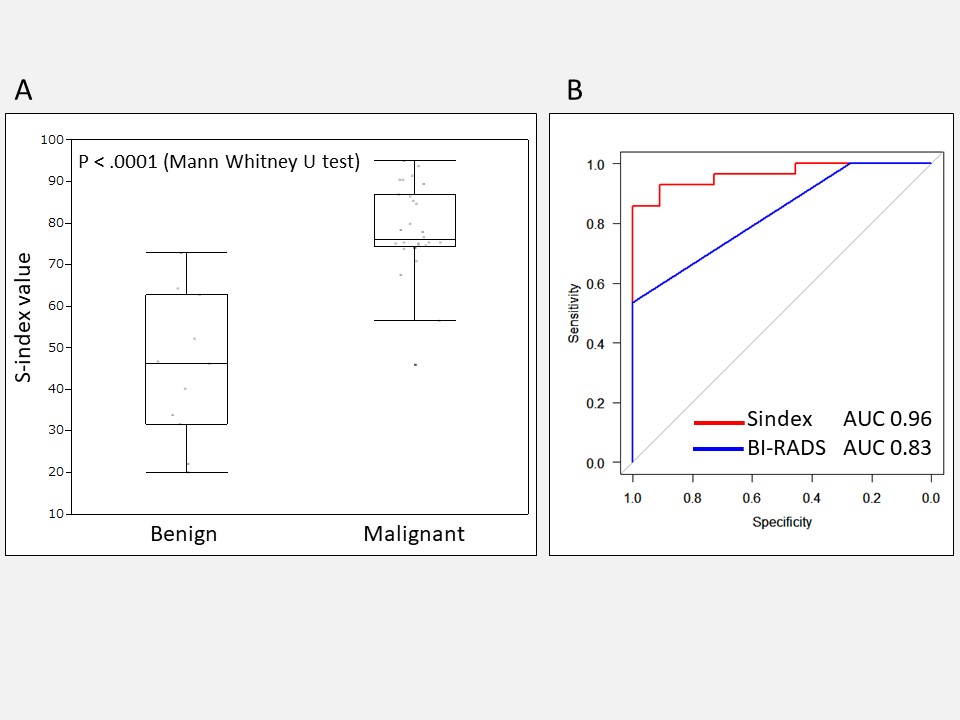
Box
plot for S-index value in each benign and malignant lesion (A) and ROCs for
S-index and BI-RADS (B). There was significant difference in S-index between
benign and malignant breast lesions (p = <.0001). The AUC for the S-index (0.96)
is significantly higher (p = 0.006) than for BI-RADS (0.83).
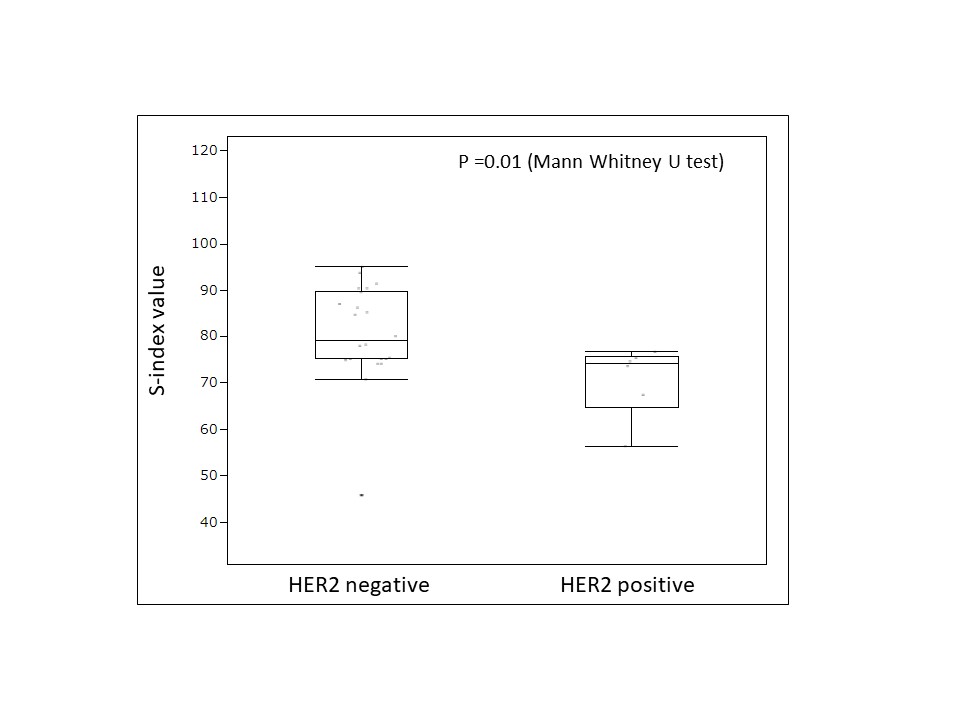
Box
plot for S-index value with HER2 receptor status. There was significant
difference in S-index between HER2 positive and negative lesions (p = 0.01). Lower Sindex for HER2 positive lesions which are
associated to a poor prognostic suggests that diffusion hindrance might be not
as high as in HER2 negative lesions, possibly due to differences in cell
membrane permeability.