0993
Prediction of Breast Cancer Molecular Subtypes Using Conventional Feature Extraction and Two Machine Learning Architectures Based on DCE-MRI1Department of Radiological Sciences, University of California, Irvine, CA, United States, 2Tzu-Chi General Hospital, Taichung, Taiwan, 3E-Da Hospital and I-Shou University, Kaohsiung, Taiwan, 4Department of Radiology, University of California, San Francisco, CA, United States
Synopsis
Two different convolutional neural network architectures were applied to differentiate subtype breast cancer based on 5 DCE-MRI time frame images: (1) a conventional serial convolutional neural network; (2) a convolutional long short term memory (CLSTM) Network. In addition, a logistic classifier was trained using morphology and texture features, selected using a random forest algorithm. For CNN, a bounding box based on the automated tumor segmentation was used to create a cropped image of the tumor as network input. A total of 94 cancers were analyzed, including 14 triple negative, 29 HER2-positive, and 51 Hormonal-positive, HER2-negative. Upon 10-fold validation, the differentiation accuracy is 0.81-0.86 using serial CNN, and 0.88-0.95 using the CLSTM.
Introduction:
Breast cancer is the second most leading cause of cancer death in women only after lung cancer. With the improved technology in imaging, automatic and quantitative analysis of breast cancer may provide clinically important information for diagnosis and characterization of tumor extent for surgical planning. In the standard practice, the hormonal receptor and HER2 receptor status are evaluated to decide the optimal treatment strategies, including the use of hormonal therapy and HER2 targeting therapy. Imaging features may provide additional information for differentiation of these subtypes. The goal of this study is to evaluate the accuracy of prediction using the conventional logistic model based on the morphology and texture features extracted from the tumor, as well as machine learning using convolutional neural networks. The results to differentiate three different molecular subtypes of tumors: triple negative, HER2-positive, and Hormonal-positive & HER2-negative breast cancers are compared.Methods:
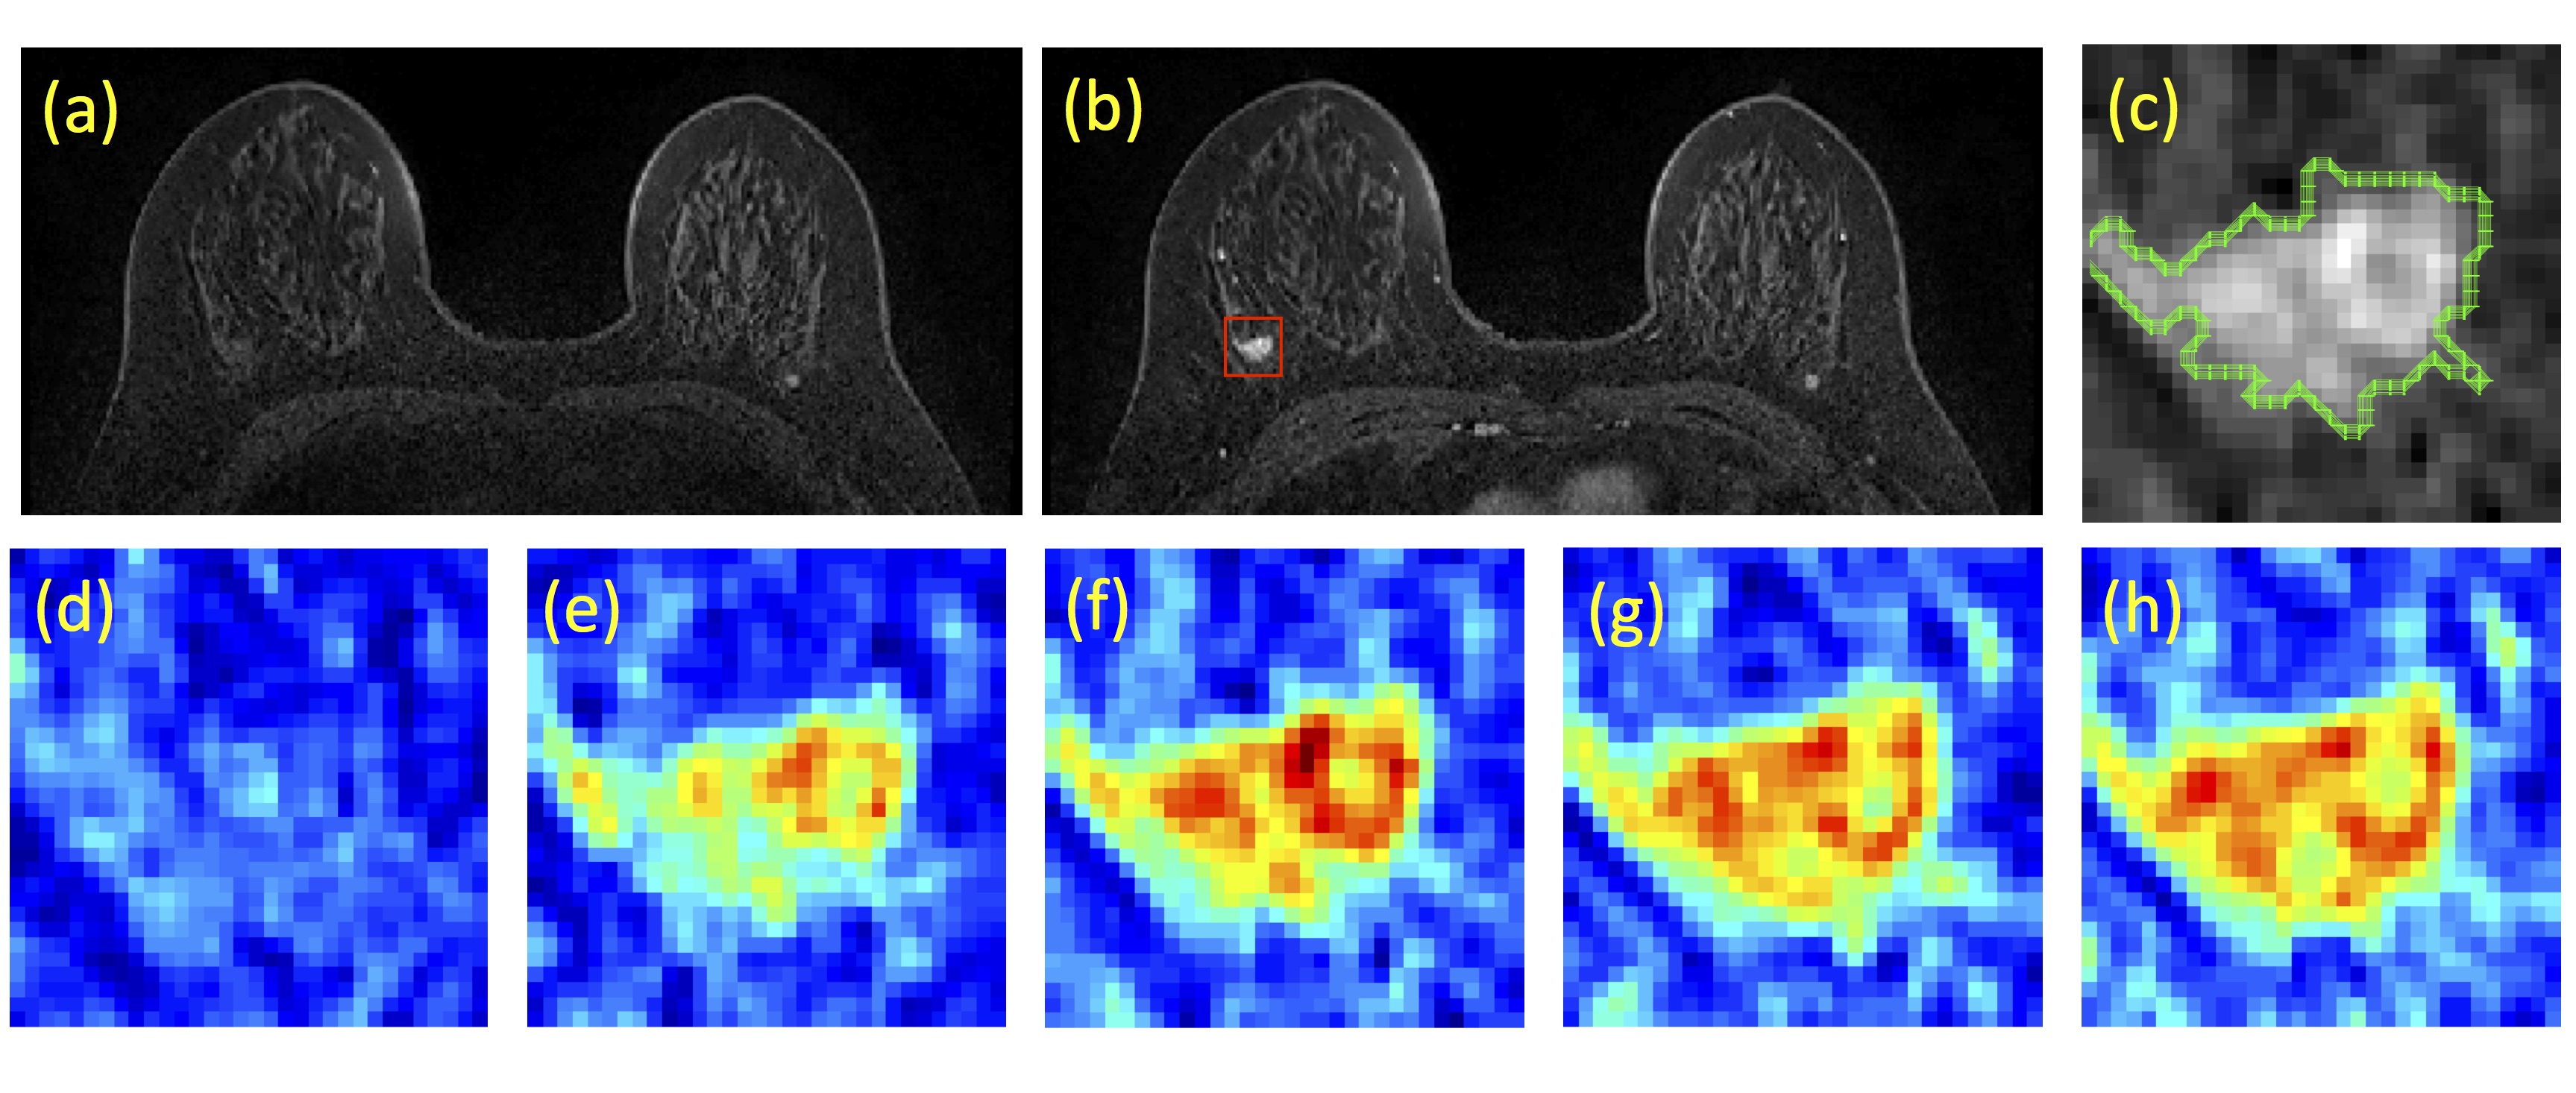
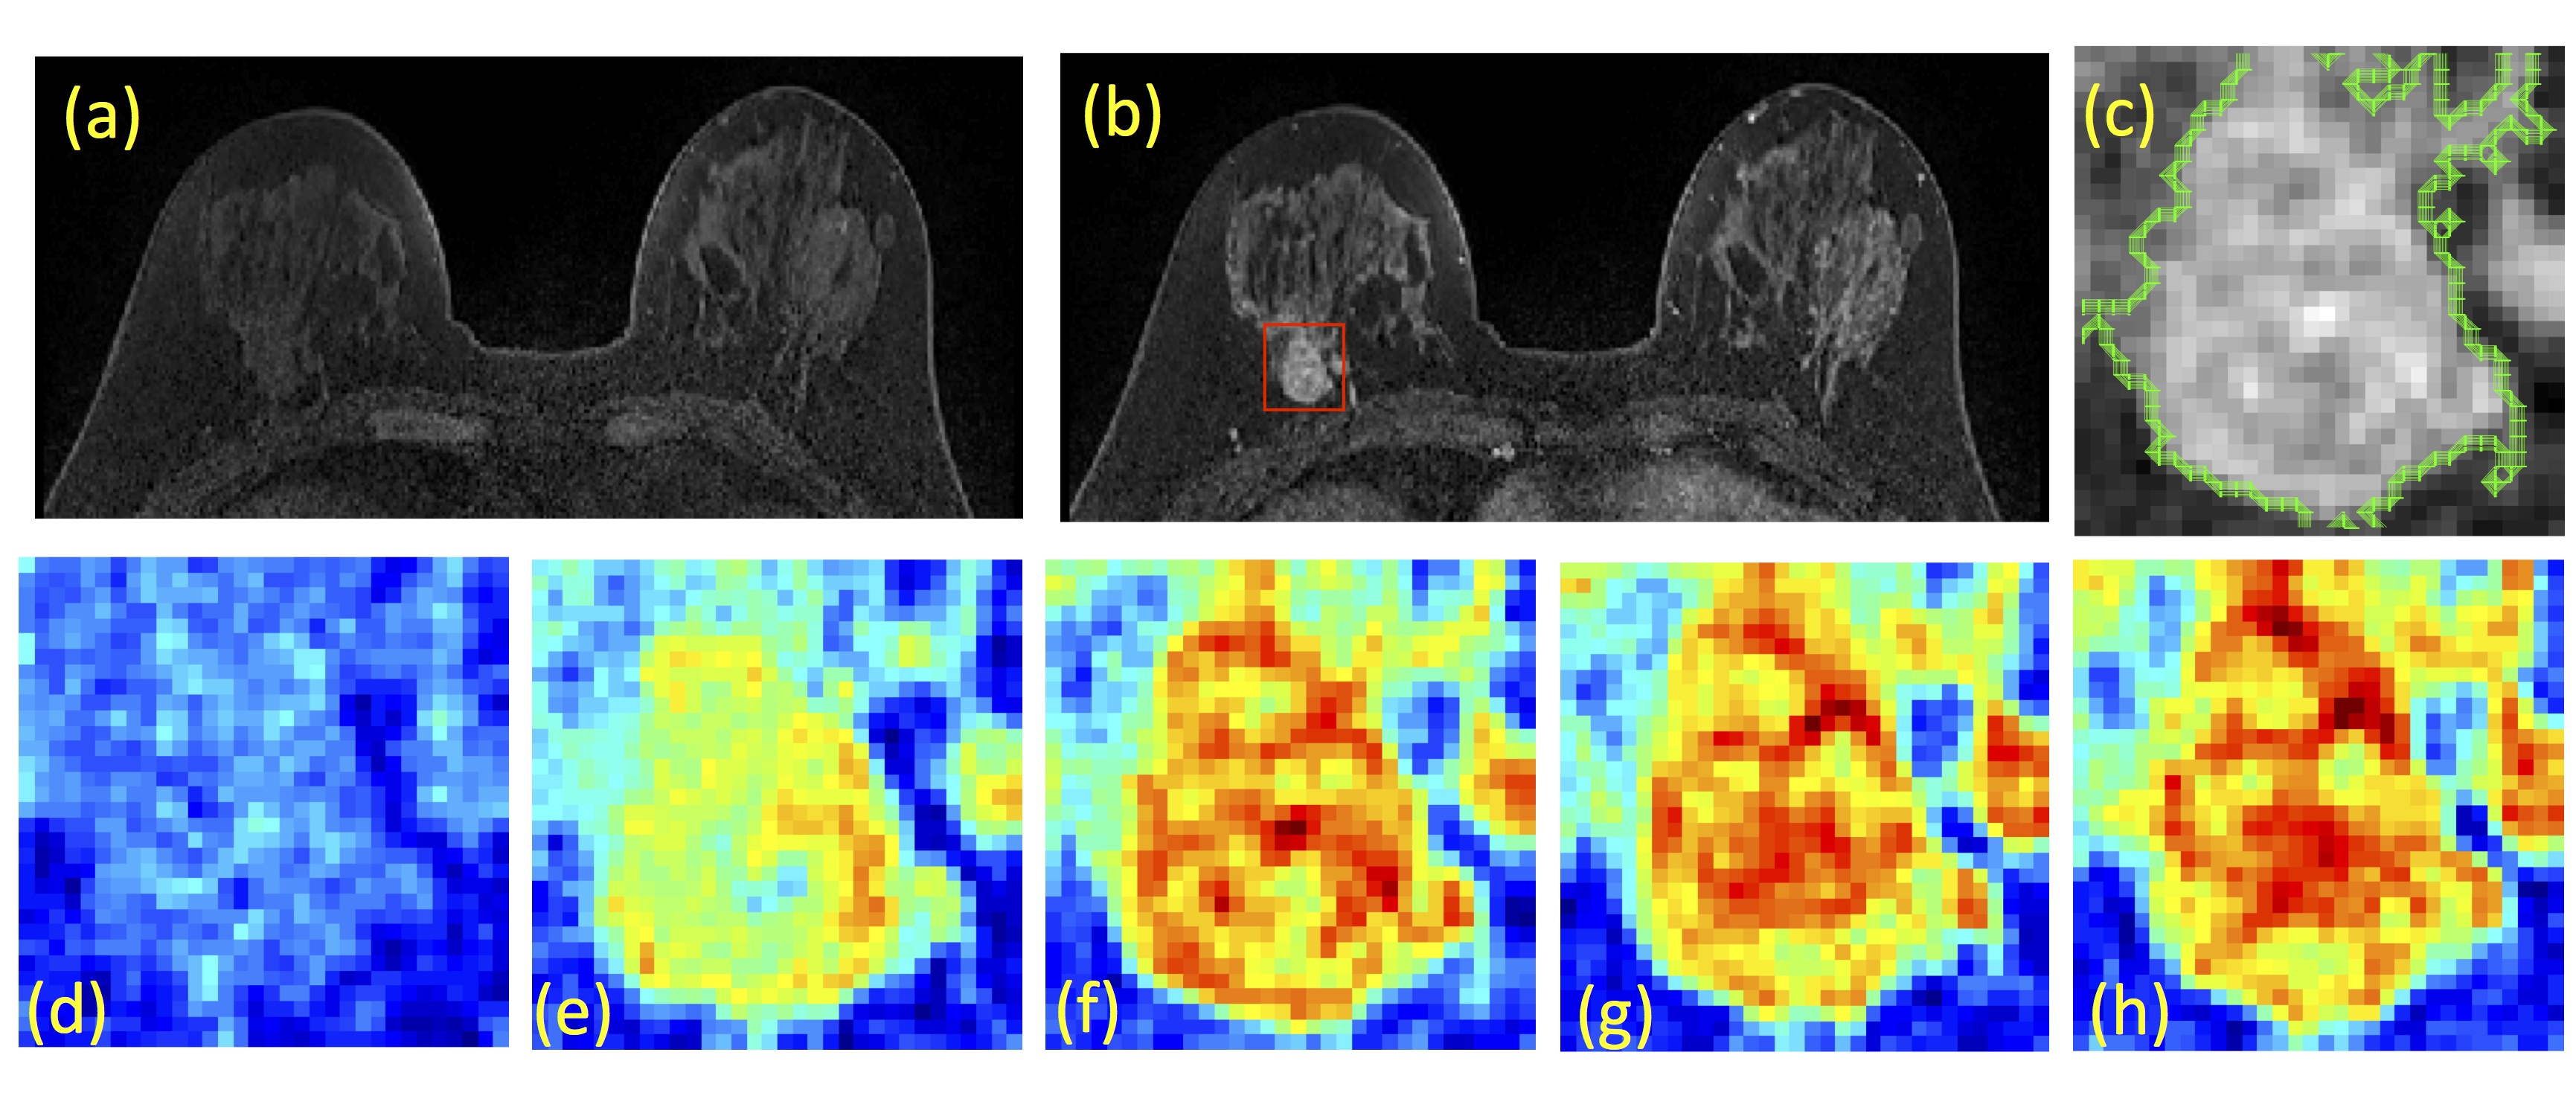
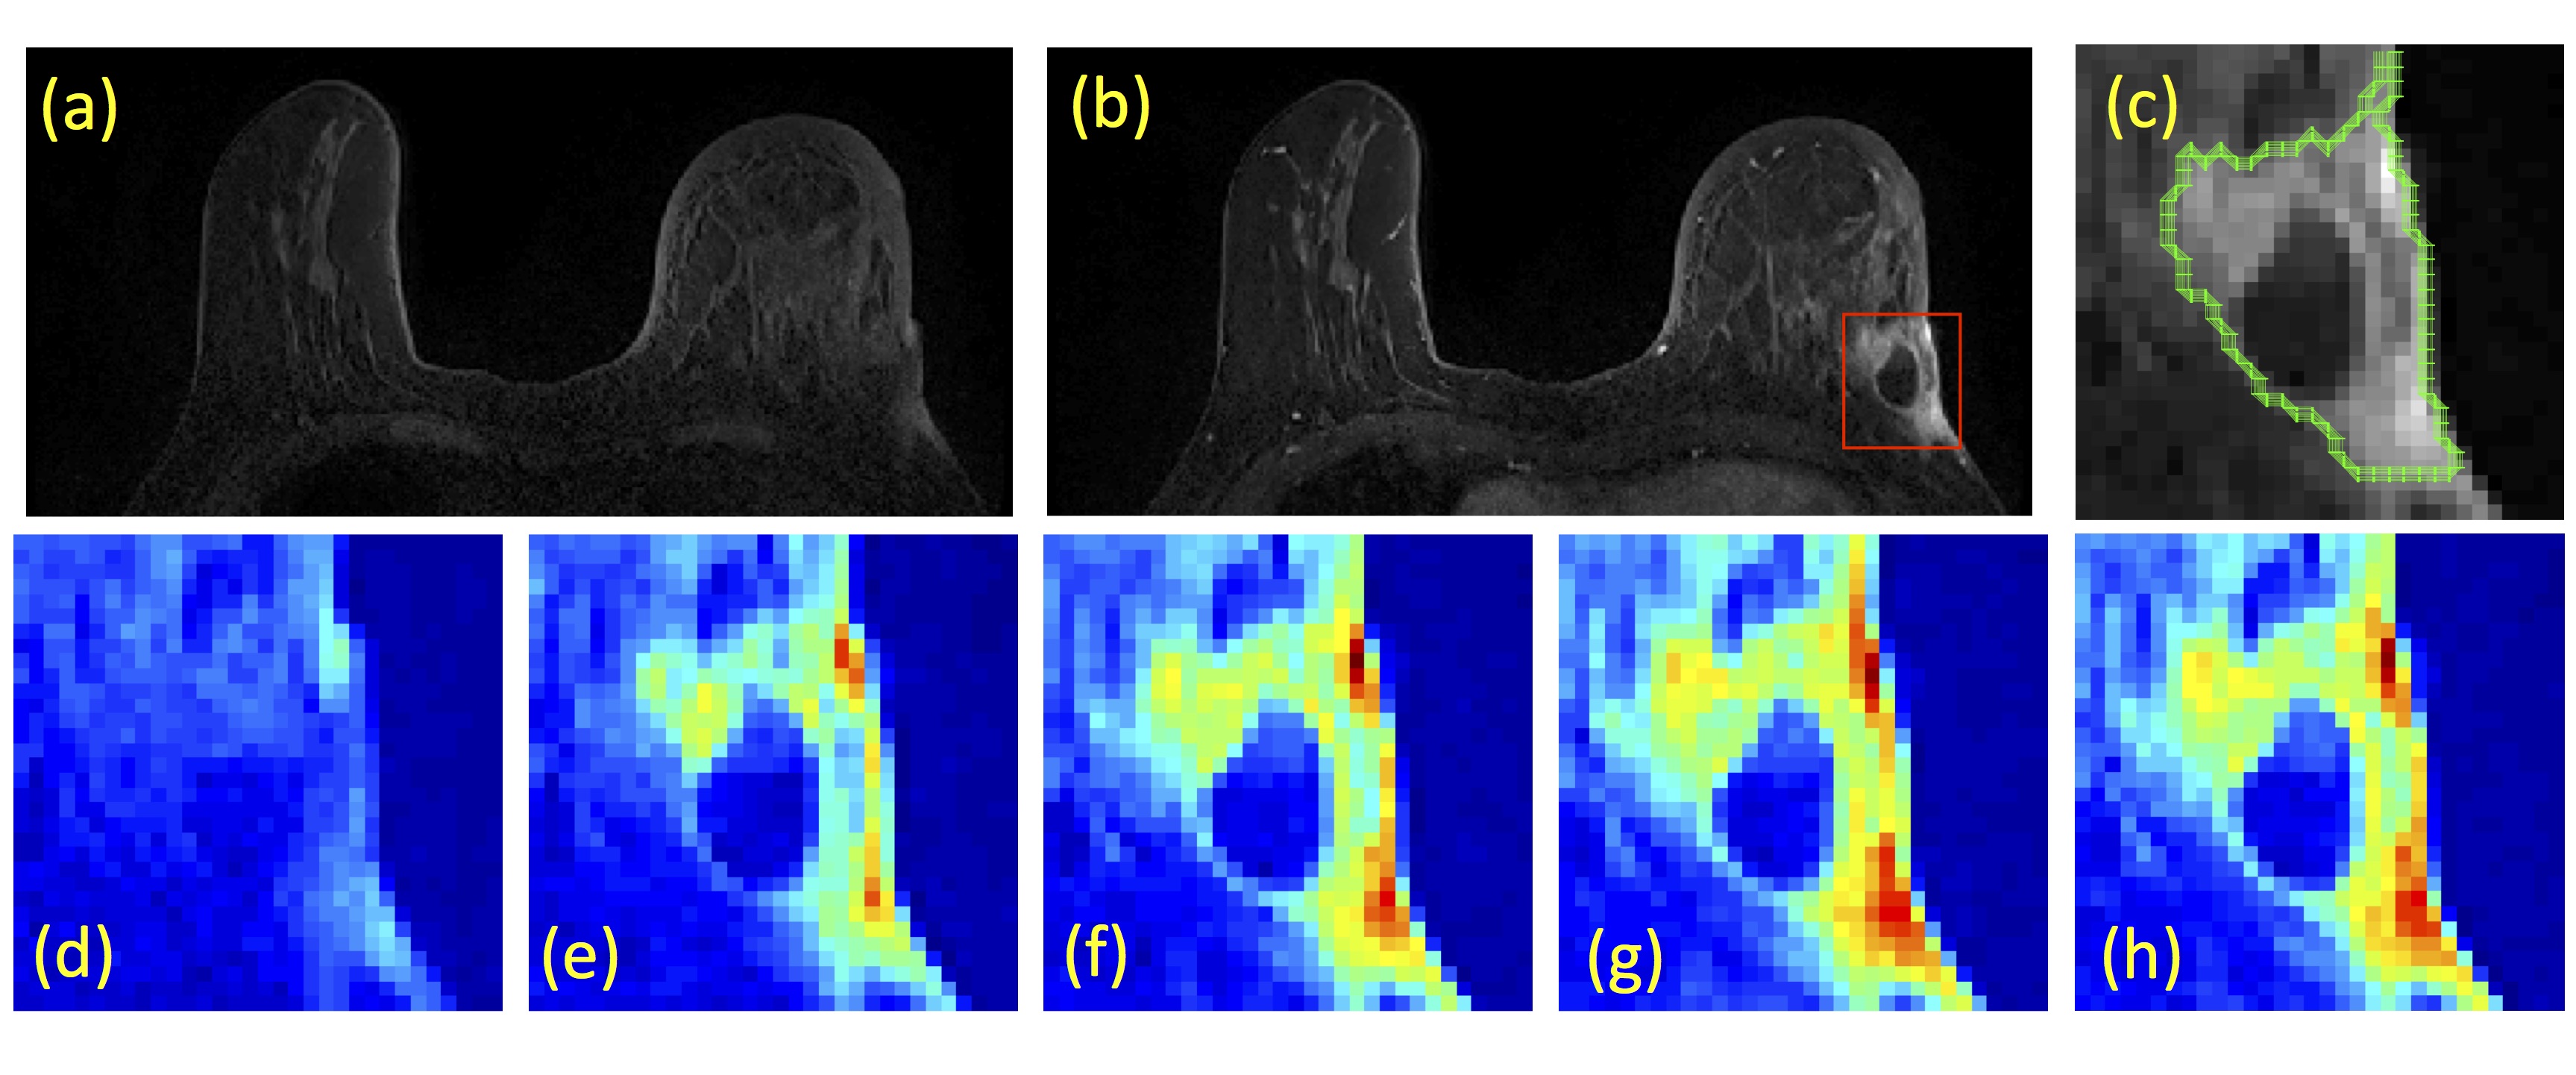
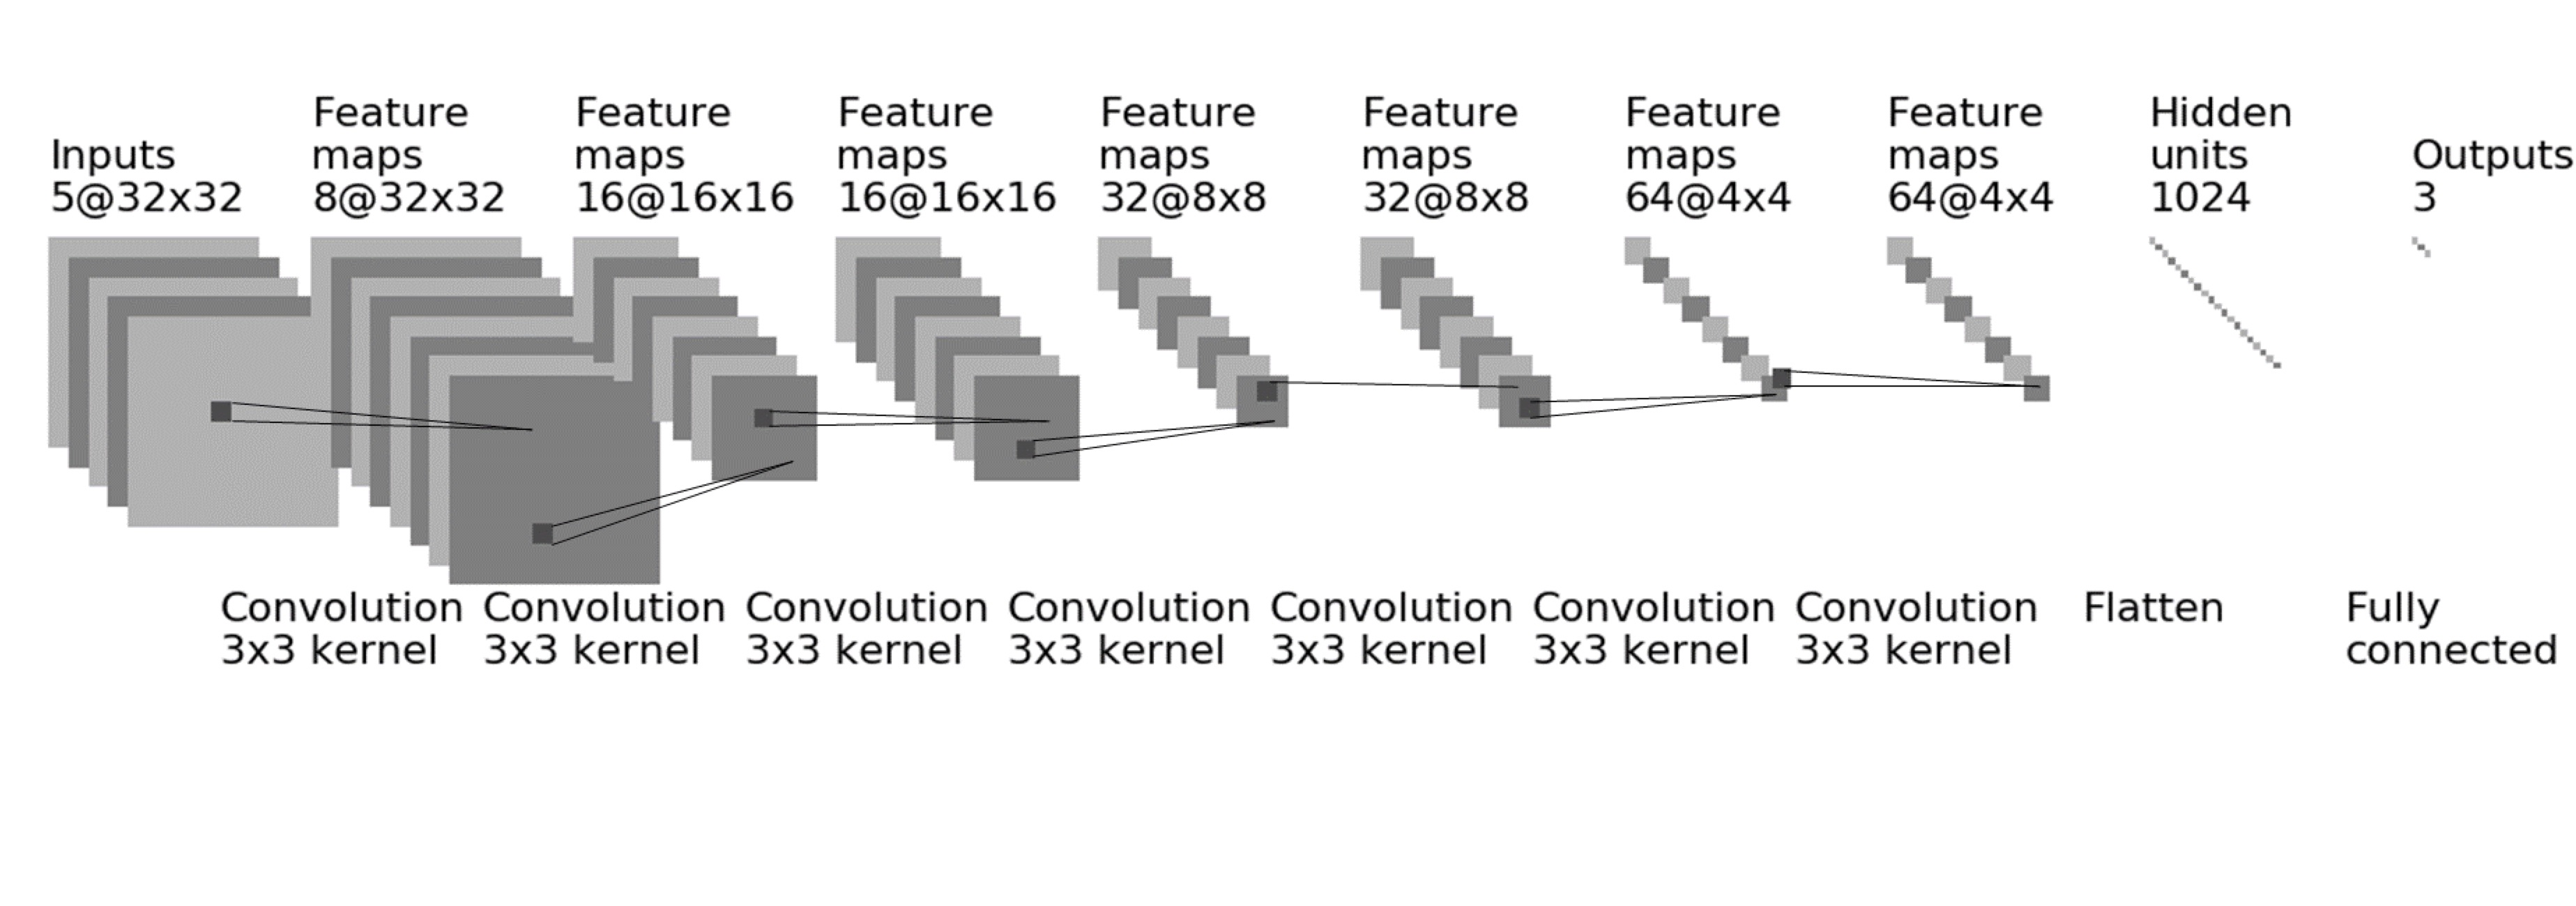
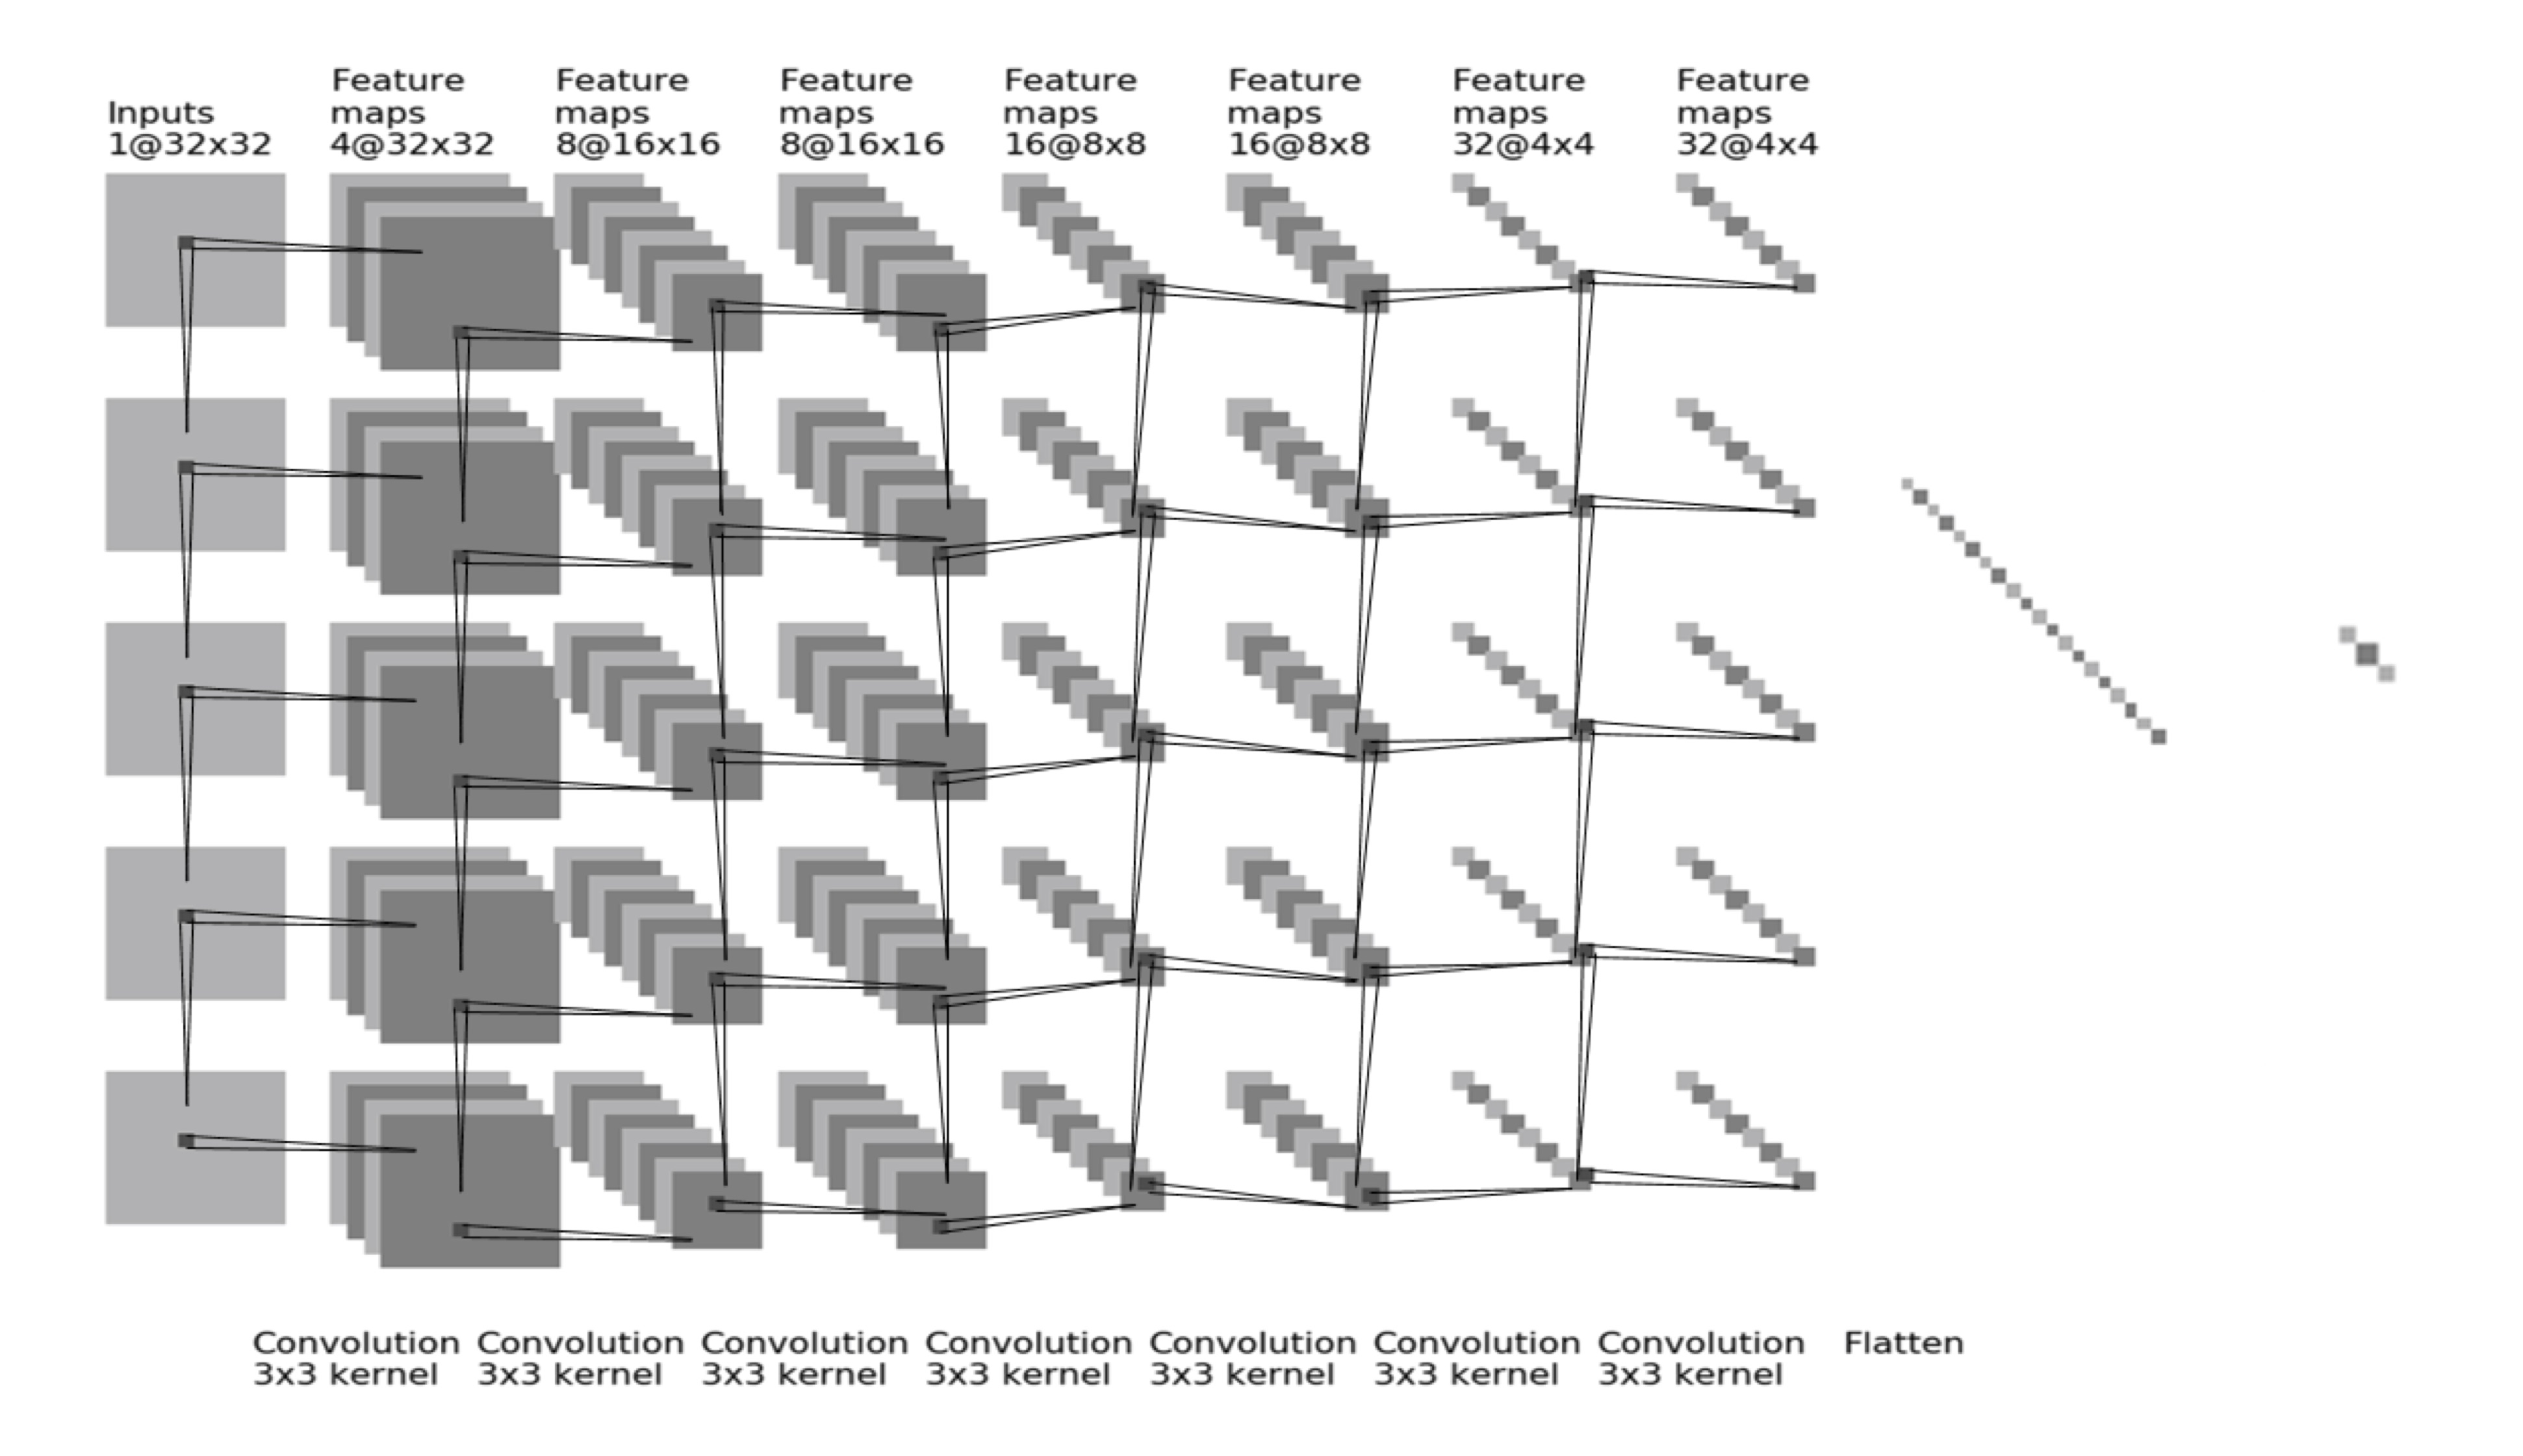
A total of 94 breast cancer patients (mean age 48.5 y/o, range 22-75) were studied. Of these, 14 had triple negative, 29 had HER2-positive, and 51 had Hormonal-positive, HER2-negative breast cancers. MRI was performed on a Siemens 1.5T system. The DCE was acquired by using a 3D gradient echo sequence with 5 time frames, one pre- and 4 post-contrast. The Gd contrast agent [0.1 mmol/kg] was injected after the acquisition of the first pre-contrast frame was completed. Tumors were segmented on T1w contrast-enhanced images using complimentary strategies for mass and non-mass tumors. For mass tumors, a fuzzy-C-means (FCM) clustering-based algorithm was applied [1]. Figures 1-3 show three case examples with different molecular subtypes. For non-mass lesions, a bounding box was first placed around the suspicious regions of interest. The signal intensity histograms of tissues inside and outside the ROI were obtained, and fitted by two unnormalized Gaussian Probability Density functions [2]. The intersection between the two Gaussian functions was used as the threshold for region growing to obtain the tumor boundary. From these tumor segmentations, 11 morphology and 53 texture features were extracted using GLCM, GLRLM, GLSZM, and NGTDM metrics. For differentiation of molecular subtypes using a conventional non-CNN approach, feature selection was first implemented by using a random forest algorithm [3] to find features with the highest significance. These features were then used to train a logistic model to serve as a classifier. In addition, a conventional CNN as well as a CLTSM network were implemented to predict tumor subtypes. Only the DCE images were used in this analysis, which included one pre-contrast and 4 post-contrast set of images. Figure 4 shows a serial convolutional neural network [5-8] by using 5 sets of images as separate inputs. In addition given the temporal relationship of the serial DCE acquisitions, a convolutional long short term memory (CLSTM) network [9] was applied, with details shown in Figure 5. To avoid overfitting, the dataset was augmented by random affine transformation. The algorithm was implemented with a cross entropy loss function and Adam optimizer with initial learning rate of 0.001 [6].Results:
When using the conventional logistic model based on processed morphology and texture parameters, the area under the ROC curve for differentiation of the three subtypes was in the range of 0.70 – 0.80. Using the serial CNN architecture shown in Figure 4, the prediction accuracy upon 10-fold validation is 0.81 – 0.86. By using the CLSTM architecture shown in Figure 5, the prediction accuracy is improved to 0.88 – 0.95.Conclusions:
The results of morphology and texture analysis for differentiating among the three molecular subtypes were moderate in accuracy, in part secondary to the limitations in morphological information from manually derived features used in the logistic model. By comparison, the CNN approaches include portions of peri-tumor tissue in analysis, in part contributing to an overall increased accuracy. Finally, by modeling the temporal relationship of the DCE acquisition using a CLSTM architecture results were improved further. The results show that a CNN based approach is an efficient method to extract subtle information to improve prediction of breast cancer molecular subtype.Acknowledgements
This work was supported in part by NIH R01 CA127929, R21 CA208938.References
[1] Nie K, Chen JH, Yu HJ, Chu Y, Nalcioglu O, Su MY. "Quantitative analysis of lesion morphology and texture features for diagnostic prediction in breast MRI." Academic radiology 15.12 (2008): 1513-1525. [2] Albrecht, Andreas, and Gary Bernstein. "Evaluating dark energy probes using multidimensional dark energy parameters." Physical Review D 75.10 (2007): 103003. [3] Segal, Mark R. "Machine learning benchmarks and random forest regression." Center for Bioinformatics & Molecular Biostatistics (2004). [4] Lin M, Chen J-H, Wang X, Chan S, Chen S, Su M-Y. Template-based automatic breast segmentation on MRI by excluding the chest region. Medical Physics. 2013;40(12):122301. doi:10.1118/1.4828837. [5] LeCun Y, Bengio Y. Convolutional networks for images, speech, and time series. The handbook of brain theory and neural networks. 1995;3361(10):1995. [6] Kingma D, Ba J. Adam: A method for stochastic optimization. arXiv preprint arXiv:1412.6980. 2014 Dec 22. [7] Nair V, Hinton GE. Rectified linear units improve restricted boltzmann machines. In Proceedings of the 27th international conference on machine learning (ICML-10) 2010 (pp. 807-814). [8] Srivastava N, Hinton GE, Krizhevsky A, Sutskever I, Salakhutdinov R. Dropout: a simple way to prevent neural networks from overfitting. Journal of machine learning research. 2014 Jan 1;15(1):1929-58. [9] Xingjian SH, Chen Z, Wang H, Yeung DY, Wong WK, Woo WC. Convolutional LSTM network: A machine learning approach for precipitation nowcasting. In Advances in neural information processing systems 2015 (pp. 802-810).Figures