0988
Imaging collateral ventilation in patients with advanced Chronic Obstructive Pulmonary Disease – relative sensitivity of 3He and 129Xe MRI1University of Sheffield, Sheffield, United Kingdom
Synopsis
The success of lung volume reduction with endobronchial valves in patients with Chronic Obstructive Pulmonary Disease (COPD) depends on the absence of collateral ventilation into the target lung segment. Collateral ventilation can be assessed using time-resolved 3He MRI, but providing this clinical application with 129Xe MRI would be desirable. Two patients with severe COPD were scanned with time-resolved 3He and 129Xe MRI. In both patients, collateral ventilation visualised using 3He MRI was not observed with 129Xe MRI. Although the small sample size is a limitation, this suggests that 129Xe MRI may not be suitable for the assessment of collateral ventilation.
Introduction
The assessment of collateral ventilation in patients with Chronic Obstructive Pulmonary Disease (COPD) is key to the success of lung volume reduction (LVR) with endobronchial valves, as collateral ventilation from adjacent lung regions can prevent collapse of the target lung segment1. The gold standard assessment of collateral ventilation is gas catheter bronchoscopy. Assessment of lobar fissure integrity with CT can also assist in patient selection, but is not recommended as a means of including or excluding patients for LVR due to considerable inter-operator variability1.
Time-resolved 3He imaging at breath-hold can be used to directly visualise collateral ventilation in patients with COPD2, however, the shortage of 3He3 has motivated a shift towards 129Xe MRI for most applications. The aim of this work was to compare 3He and 129Xe time-resolved imaging for the detection of collateral ventilation in patients with severe COPD.
Methods
Two patients with advanced COPD were scanned using a 1.5T whole body MRI system (GE HDx).
3He imaging: Patients were positioned supine in a 3He transmit-receive vest coil (CMRS). A mix of 100ml hyperpolarized 3He (25% polarization) and 900ml N2 was inhaled from functional residual capacity (FRC), and dynamic time-series ventilation images were acquired during breath-hold. Sequence parameters were as follows; 3D coronal steady state free precession (SSFP), full lung coverage, voxel size=6x13x10mm, θ=8.5⁰, TE=0.5ms, TR=1.6ms, BW=167kHz, Cartesian centric phase encoding, and six dynamic volumes acquired at 0, 4, 7, 11, 15 and 19 seconds.
129Xe imaging: Patients were positioned supine in a 129Xe transmit-receive vest coil (CMRS). A mix of 350ml hyperpolarized 129Xe (30% polarization) and 650ml N2 was inhaled from FRC, and dynamic time-series ventilation images were acquired during breath-hold. Sequence parameters were as follows; 3D coronal SSFP, full lung coverage, voxel size=6x13x10mm, θ=6.5⁰, TE=1.4ms, TR=4.5ms, BW=16kHz, Cartesian centric phase encoding, and six dynamic volumes acquired at 0, 4, 8, 12, 16 and 20 seconds.
Whole lung ventilated volume (VV) was calculated for each time point using automated spatial fuzzy C-means segmentation4.
Results and Discussion
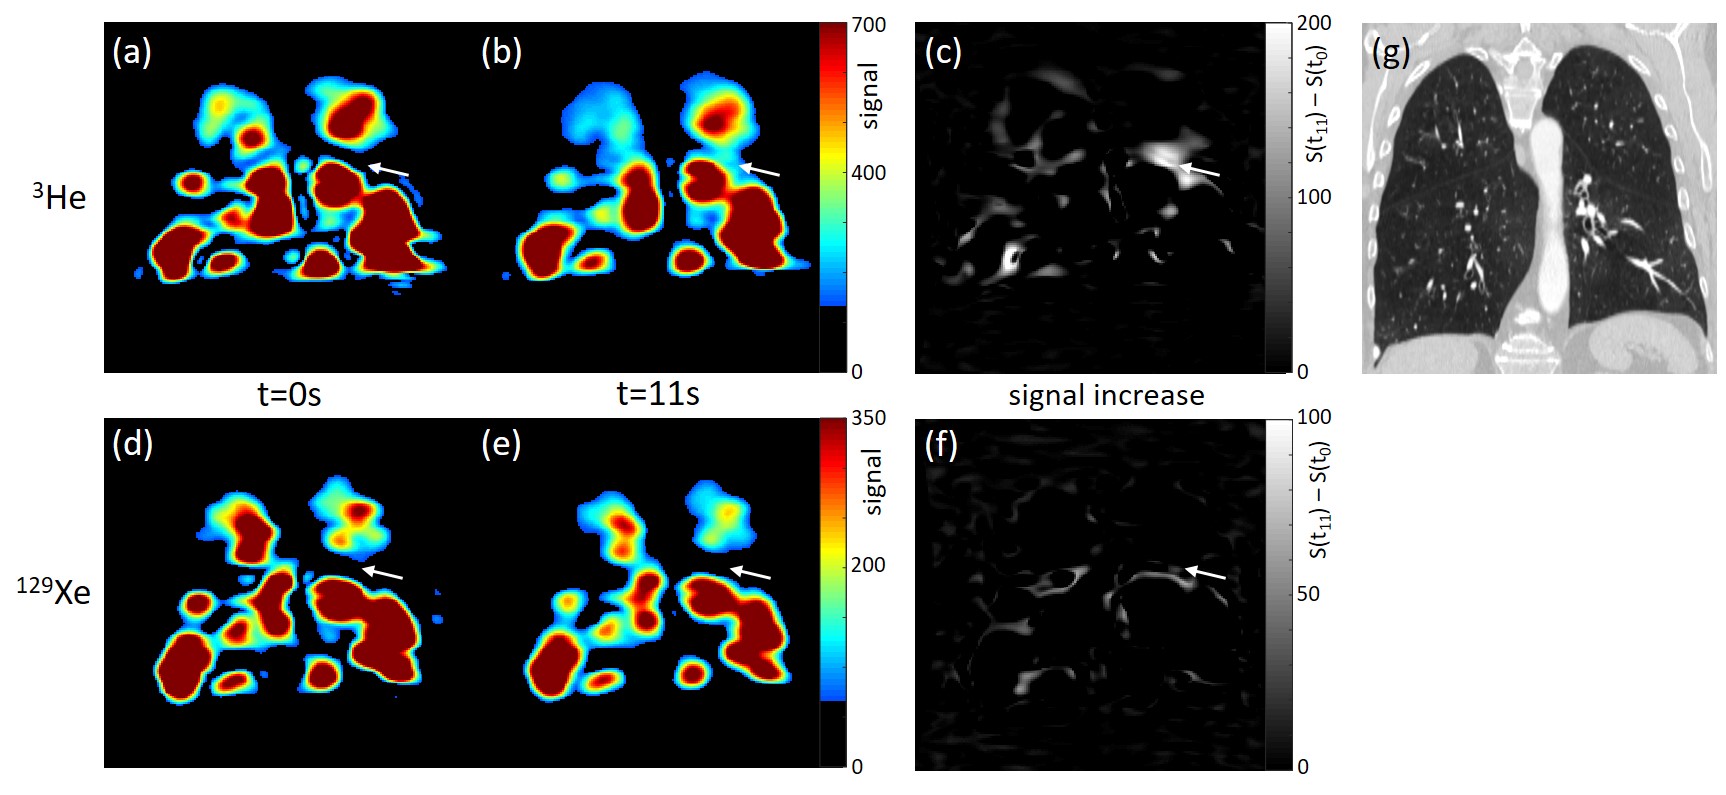
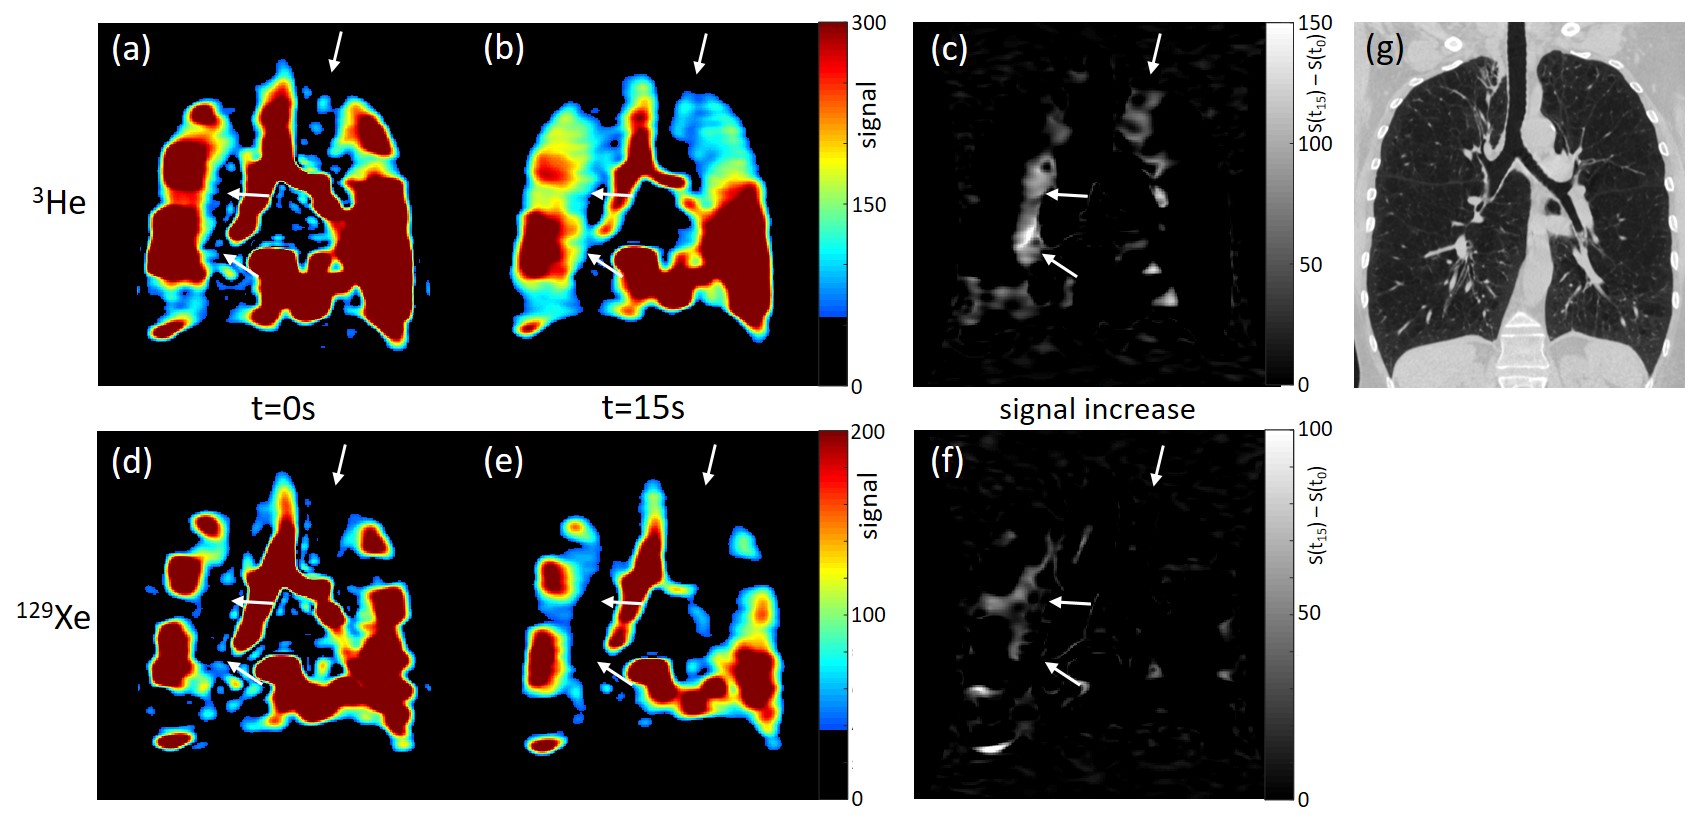
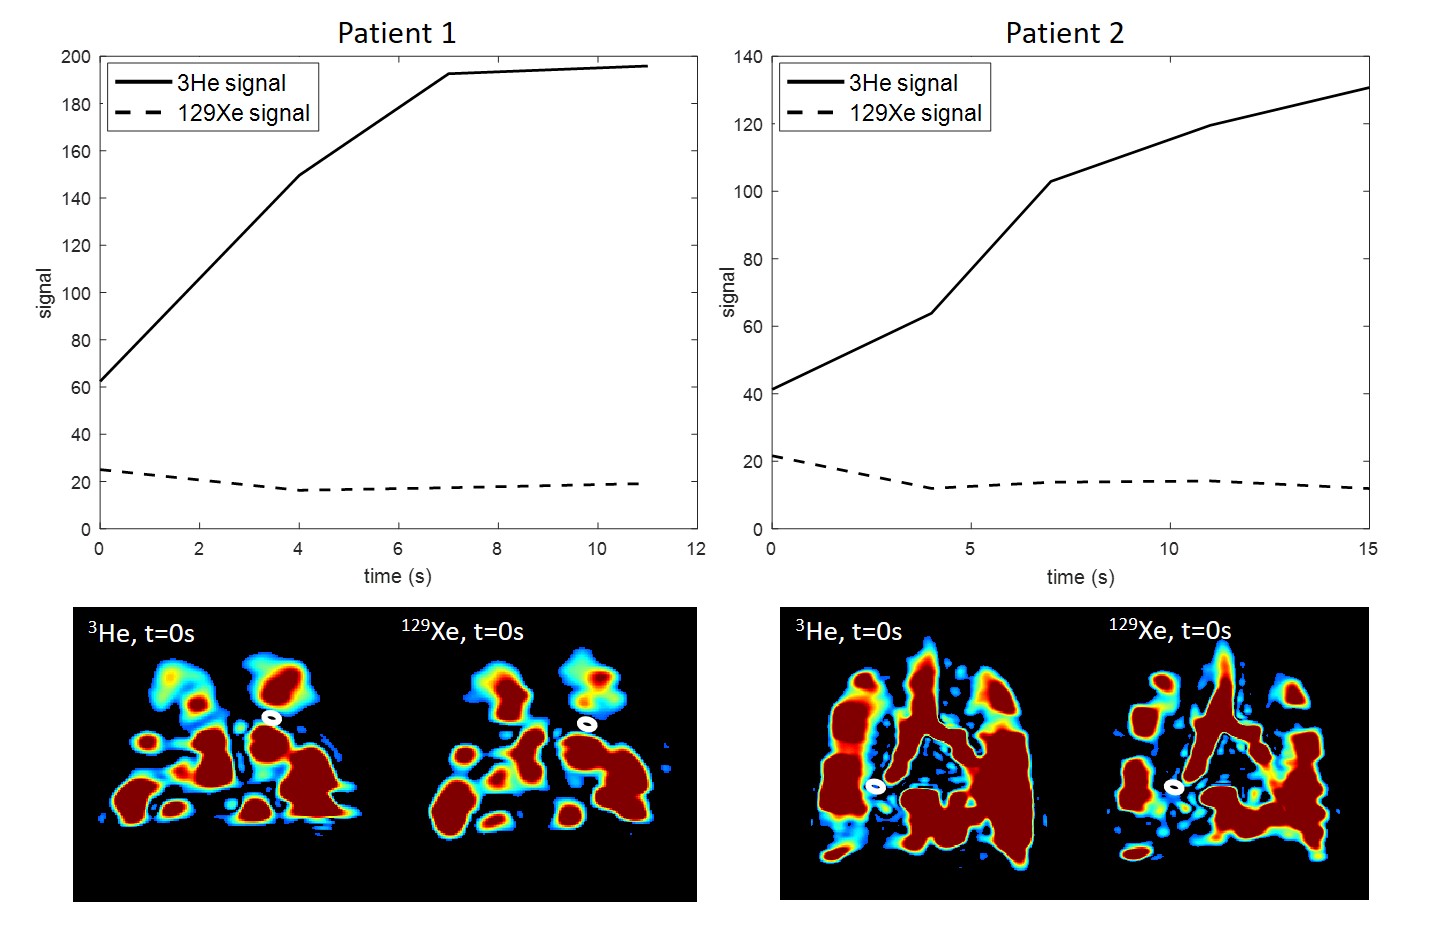
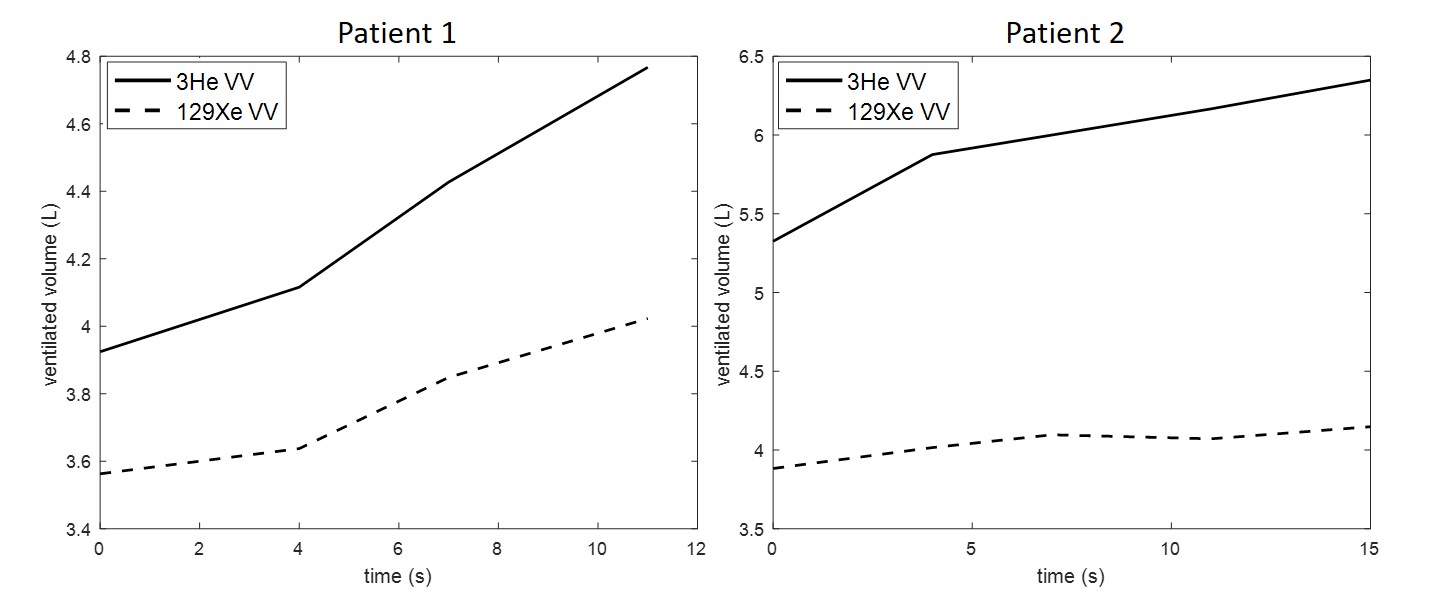
Figures 1 and 2 show 3He and 129Xe images of gas distribution within the lungs at the first and last time-points during breath-hold for the two patients. Arrows highlight initially non-ventilated lung regions where signal increased over time in the 3He images, but 129Xe signal did not. This behaviour is highlighted by the maps of signal increase and region of interest signal plots (figure 3). Some evidence of delayed ventilation was observed with 129Xe but only within lung regions which were ventilated at t=0s with 3He. Whole lung ventilated volume increased over time for both gases (figure 4), but the ratio VV3He/VV129Xe was greater at the end of the breath-holds than at t=0s.
The ratio of 129Xe diffusivity to 3He diffusivity within the hyperinflated lungs of a patient with a FRC of 7L (as measured by body plethysmography in patient 2) was calculated5 as 0.15 for the gas mixtures used (D0(129Xe-air,lungs)=0.13cm2 s-1, D0(3He-air,lungs)=0.87cm2 s-1). This was associated with a mean free diffusion path length (zrms=√(2DΔt)) of 2.0cm for 129Xe and 5.1cm for 3He on the time-course of the time-resolved experiment (Δt~15s). The visualization of collateral ventilation with 3He but not 129Xe, and the increased VV3He/VV129Xe ratio at the end of the breath-holds compared to t=0s, are likely due to this large difference in diffusivity between the gas mixtures used.
The observation of reduced ventilated volume in 129Xe images when compared to 3He images acquired from the same patients with COPD has been reported before for single time-point ventilation imaging6. The diffusion coefficient of 129Xe in air (0.14cm2s-1)5 is closer to that of air alone (0.22cm2s-1)7 than 3He in air (0.86cm2s-1)5. However, in the case of LVR, where the aim is to remove all air from the target lung compartment to enable collapse, the higher diffusivity of 3He highlights delayed ventilation which would take place on a longer time-scale for pure air rather than the 3He-air mixture used for imaging (60s for zrms=5.1cm for pure air).
A limitation of this study is the small sample size. However, in the context of detection of collateral ventilation for LVR, any instances where collateral ventilation was present but not detected indicate a limitation of time-resolved 129Xe MRI for that application.
Conclusions
Collateral ventilation in patients with severe COPD visualized using 3He MRI was not observed with 129Xe MRI. These initial results indicate that the assessment of collateral ventilation in patients with COPD for the planning of lung volume reduction with endobronchial valves may be one application where 129Xe MRI is less sensitive than 3He MRI.Acknowledgements
This work was funded by the Medical Research Council (MRC) and the National Institute of Health Research (NIHR).References
[1] Slebos DJ, Shah PL, Herth FJ, Valipour A. Endobronchial valves for endoscopic lung volume reduction: best practice recommendations from expert panel on endoscopic lung volume reduction. Respiration 93(2):138-50 (2017).
[2] Marshall H, Deppe MH, Parra-Robles J, Hillis S, Billings CG, Rajaram S, Swift A, Miller SR, Watson JH, Wolber J, Lipson DA, Lawson R, Wild JM. Direct visualisation of collateral ventilation in COPD with hyperpolarised gas MRI. Thorax 67(7):613-7 (2012).
[3] Shea DA, Morgan D. The helium-3 shortage: supply, demand, and options for congress. Congressional Research Service, Library of Congress, Technical Report: R41419:7-5700 (2010).
[4] Hughes PJC, Horn FC, Collier GJ, Biancardi A, Marshall H, Wild JM. Spatial fuzzy c-means thresholding for semiautomated calculation of percentage lung ventilated volume from hyperpolarized gas and 1H MRI. J Magn Reson Imaging (2017) doi: 10.1002/jmri.25804;
[5] Chen XJ, Moller HE, Chawla MS, Cofer GP, Driehuys B, Hedlund LW, Johnson GA. Spatially resolved measurements of hyperpolarized gas properties in the lung in vivo. Part I: diffusion coefficient. Magn Reson Med 42:721-8 (1999).
[6] Kirby M, Svenningsen S, Owrangi A, Wheatley A, Farag A, Ouriadov A, Santyr GE, Etemad-Rezai R, Coxson HO, McCormack DG, Parraga G. Hyperpolarized 3He and 129Xe MR imaging in healthy volunteers and patients with chronic obstructive pulmonary disease. Radiology 265(2):600-10 (2012).
[7] Cussler E.L. Diffusion: Mass Transfer in Fluid Systems (2nd Edition). New York: Cambridge University Press, ISBN 0-521-45078-0, (1997).
Figures