0987
Multimodal quantitative MRI biomarkers: identification of the specific damage in Progressive Supranuclear Palsy versus Parkinson’s disease1Centre de NeuroImagerie de Recherche – CENIR, ICM, Paris, France, 2Neuroradiology department, APHP, Pitié-Salpêtrière hospital, Paris, France, 3UMR S 1127, CNRS UMR 7225, ICM, UPMC Univ Paris, Paris, France, 4Clinique des mouvements anormaux, Département des Maladies du Système Nerveux, Hôpital Pitié-Salpêtrière, PARIS, France, 5Service des pathologies du Sommeil, Hôpital Pitié-Salpêtrière, APHP, Paris, France, 6NeuroSpin, CEA, Gif-Sur-Yvette, France
Synopsis
We used quantitative multimodal MRI to investigate the region-specific damage in progressive supranuclear palsy (PSP) in order to generate a precise in-vivo model of neurodegeneration at various levels of the central nervous system. Additionally, we aimed to test the markers for differentiating the PSP from Parkinson disease (PD) patients and from healthy subjects. PSP patients showed extensive volume decrease and microstructural diffusion changes in the brainstem and the basal ganglia in agreement with previous pathological studies. These results suggest the possibility of direct non-invasive assessment of brain damage in PSP even in small brainstem nuclei.
INTRODUCTION
Progressive supranuclear palsy (PSP) is a neurodegenerative clinically heterogeneous disorder characterized by neuronal and glial depositions of abnormally phosphorylated tau protein.1-2 The formal diagnosis of PSP is based on postmortem histological examination of the brian. Lesions are evidenced in the basal ganglia (putamen, globus pallidus, subthalamic nucleus - STN), the nucleus basalis of Meynert (NBM), the midbrain (substantia nigra - SN, nucleus cuneiformis, pedunculopontine nucleus - PPN), the pons (locus coeruleus - LC) and the medulla oblongata.2-3 Diagnosis can be challenging especially in early stages of the disease. Previous MRI studies have observed volume decrease and diffusion imaging changes in PSP patients mostly the basal ganglia and the mesencephalon.4-5 Here, we studied whether multimodal quantitative MRI was able to detect region-specific damage as observed in pathology studies. In addition, we aimed to test the diagnostic accuracy of these markers.METHODS
Subjects: Eleven patients with PSP (mean age: 61.7±7.8 years, disease duration: 3.8±1.5 years) were compared with 26 age-matched healthy controls (HC, mean age 60.8±8.3 years) and 51 age-matched PD patients (mean age: 60.6±8.9 years, disease duration: 8.9±3.5 years). Clinical examination included the Unified Parkinson’s Disease Rating Scale and extensive neuropsychological assessment.
MRI data acquisition: MRI acquisition was performed using a 3 Tesla TRIO TIM system (Siemens, Erlangen, Germany) using a 12-channel receive-only head coil. The protocol included three-dimensional (3D) T1-weighted (T1-w) images, 3D T2-weighted (T2-w) images, diffusion tensor imaging (DTI) and R2* mapping. Neuromelanin(NM)-sensitive images were acquired using two-dimensional (2D) axial turbo spin echo T1-w images (TR/TE/flip angle: 900ms/15ms/180°, voxel size: 0.4*0.4*3mm3, 3 averages). The DTI parameters were as follows: TR/TE/flip angle =14000ms/101ms/90°, voxel size = 1.7*1.7*1.7mm3, b-value=1500s/mm2, 60 diffusion gradients directions). R2* mapping was computed using a gradient-echo planar sequence with 6 TEs (range, 24-94 ms), TR/flip angle: 9000 ms/90° and voxel size: 2*2*2 mm3. T2*-w high-resolution images were also acquired at 7 Tesla with the following parameters: TR/TE/flip angle: 2180ms/29.9ms/65°, field of view: 192 mm2, voxel size of 0.5x0.5x0.5 mm3, 40 slices. Image analysis: Image processing and analysis were performed using in-house software written in MATLAB.
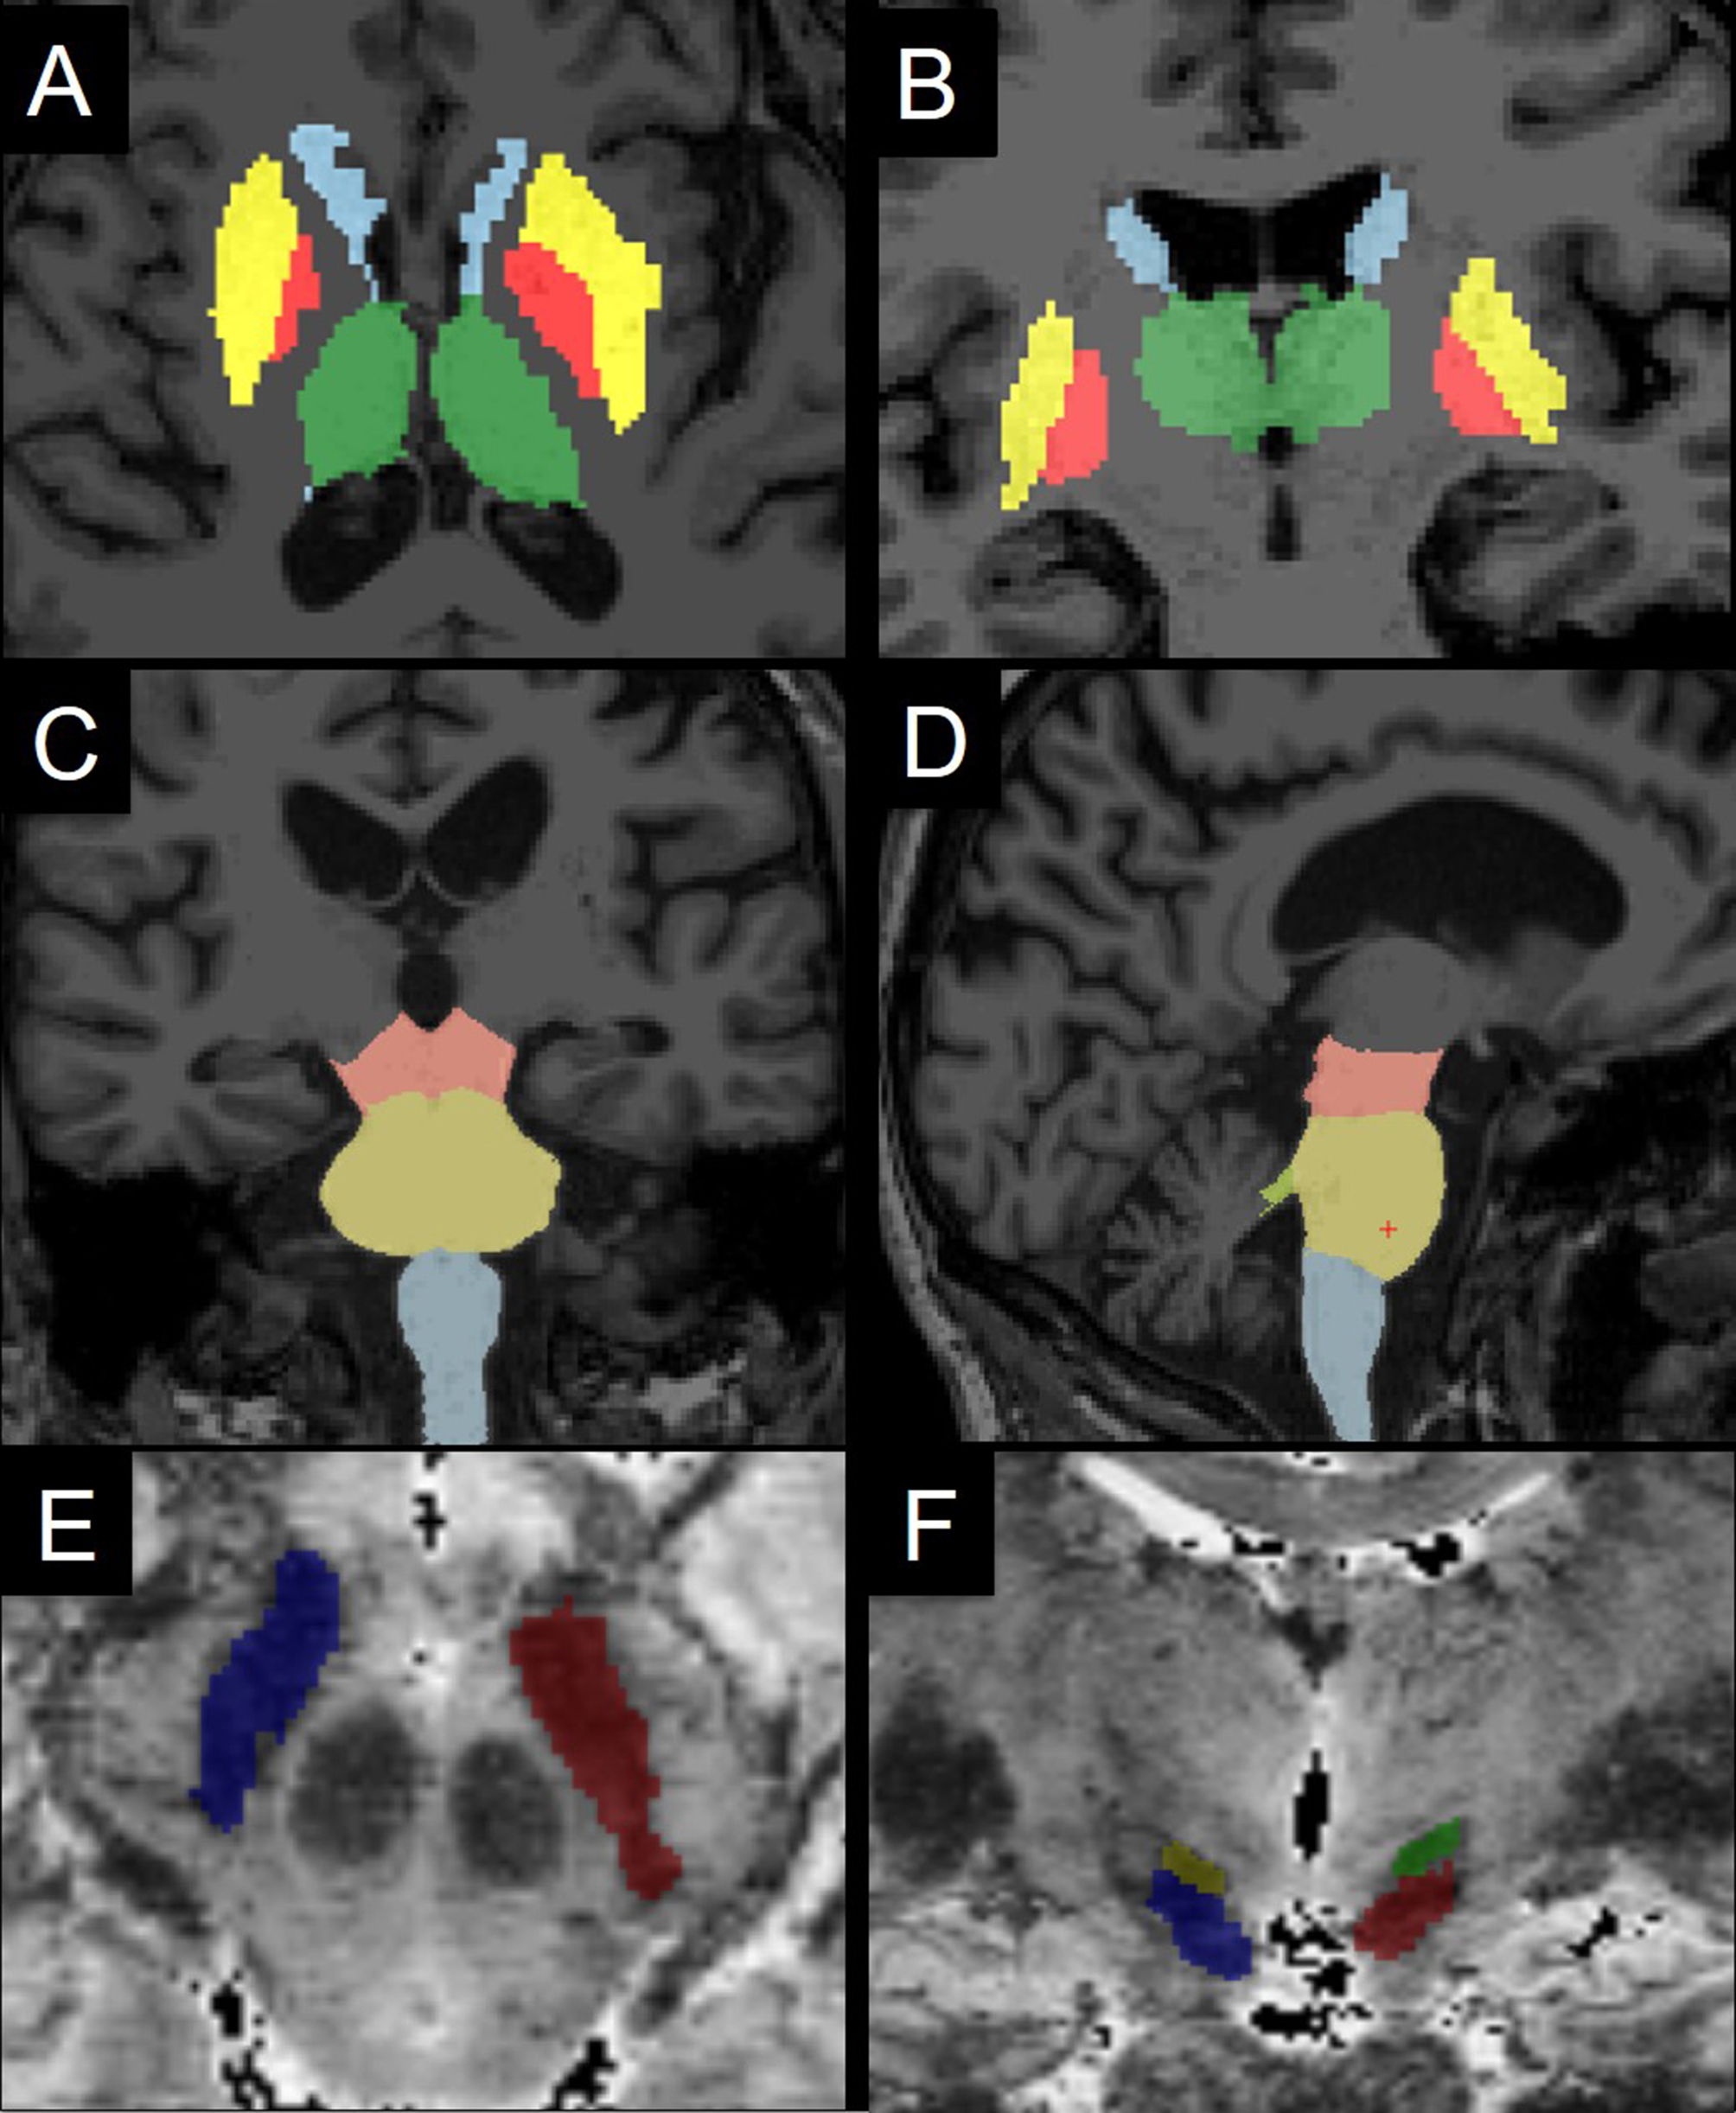
The regions of interest (ROIs) were segmented automatically in the basal ganglia and brainstem as well as in cortical and subcortical regions using FreeSurfer (http://freesurfer.net/, MGH, Boston, MA, USA) software (Figure 1). ROIs were drawn manually at 3T in the SN using NM images, and in the NBM using T1-w and T2-w images, and at 7T in the STN using T2*-w images. The LC, cuneiform nucleus and PPN were segmented semi-automatically with in-house software.6-7 Volume, R2*, fractional anisotropy (FA), and mean diffusivities (MD) were calculated in the ROIs.
Statistical analysis: The statistical analysis was performed using R. Measures were compared using Kruskal-Wallis test. The diagnosis accuracy was evaluated using ROC analysis. Based on cut-off values and local extrema, three damage levels were defined that were associated to each subject/region variable.
RESULTS
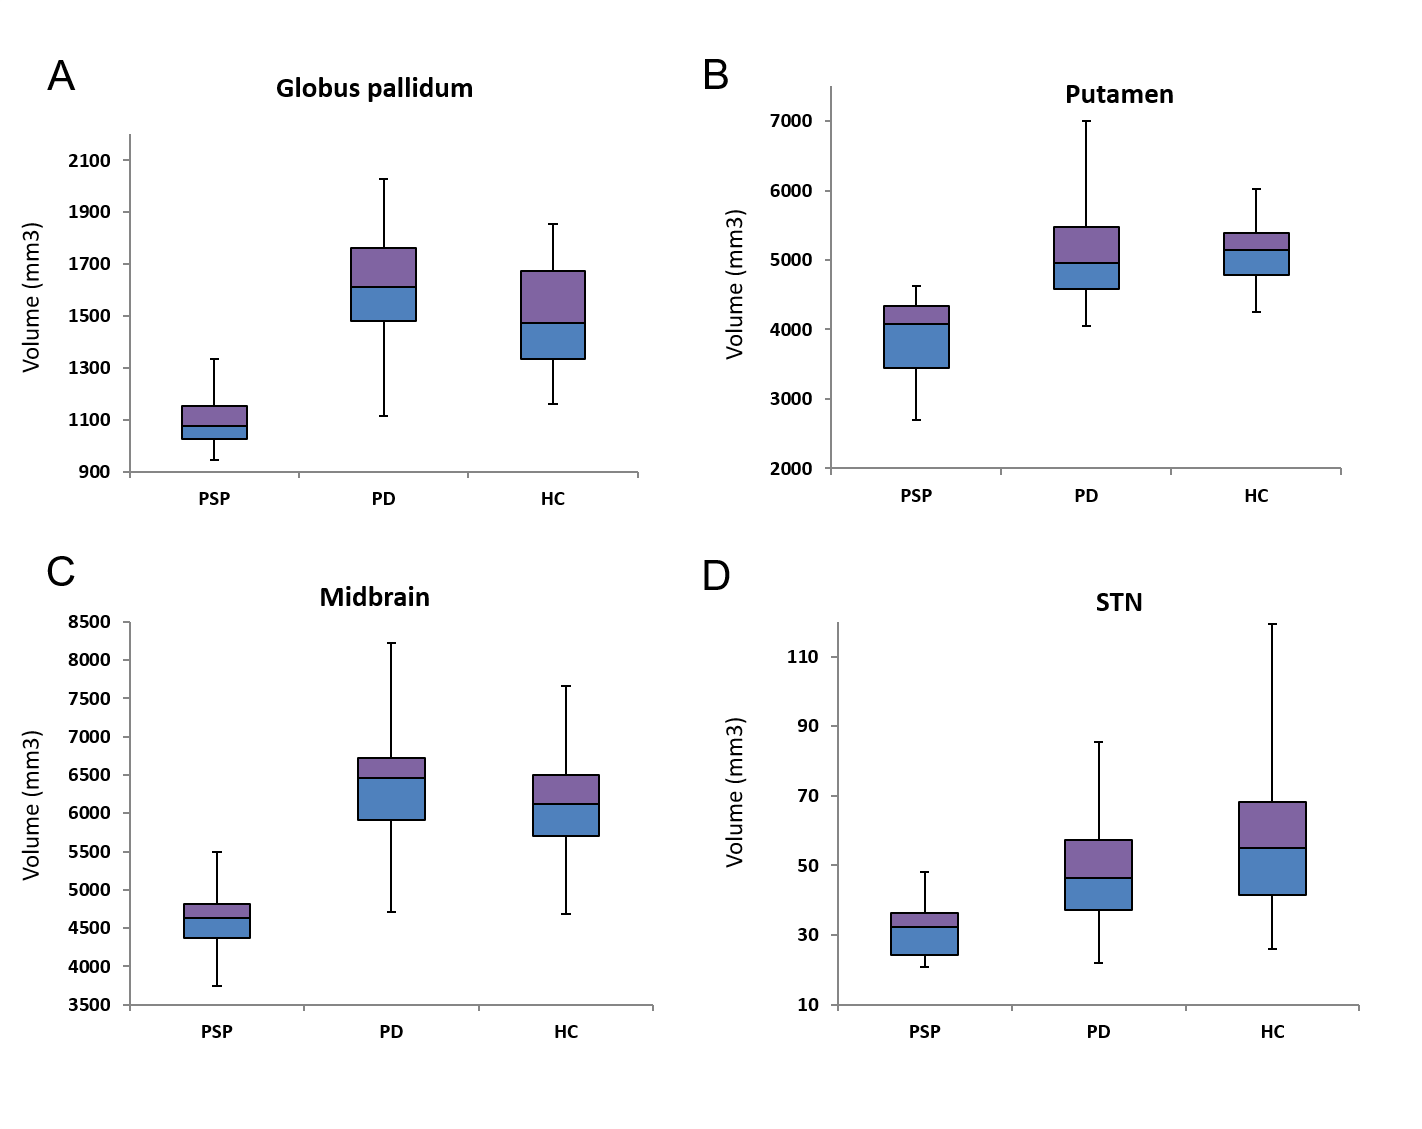
Using all biomarkers patients with PSP showed extensive damage that predominated in the midbrain, SN, STN, globus pallidus, LC and PPN (Figure 2).
Significant volume decrease as compared to PD patients and HC was observed in the putamen (p<0.0001), globus pallidus (p<0.0001), caudate nucleus (p=0.0003), midbrain (p=0.0003), STN (p=0.0008), pons (p=0.001), medulla oblongata (p=0.001) and thalamus (p=0.004). Volume decrease was evidenced in the SN using NM-sensitive images (p<0.0001) as compared to HC, whereas volume did not differ as compared to PD.
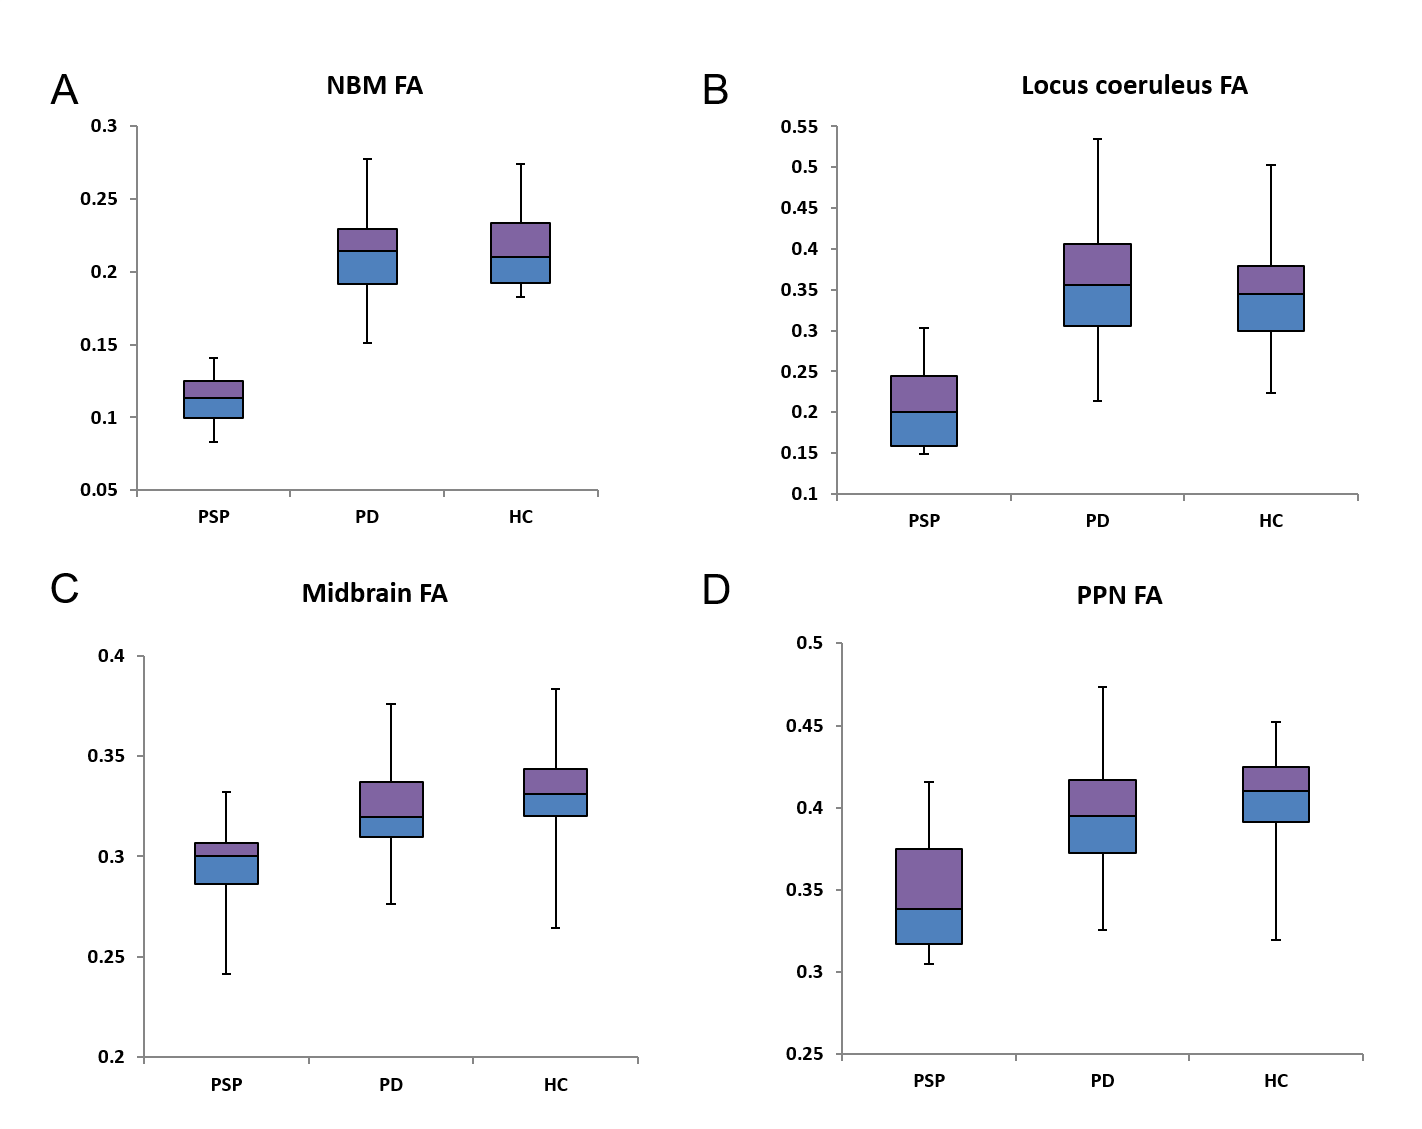
FA was reduced in PSP as compared to both PD and HC in the NBM (p<0.0001), LC (p<0.0001), PPN (p=0.0004), thalamus (p=0.0004), midbrain (p=0.001), pons and cuneiform nucleus (p=0.005) (Figure 3). Several of these biomarkers had excellent diagnostic accuracy >0.9 for differentiating PSP from PD (volume decrease in midbrain, pons, putamen and globus pallidus and FA in the LC and midbrain).
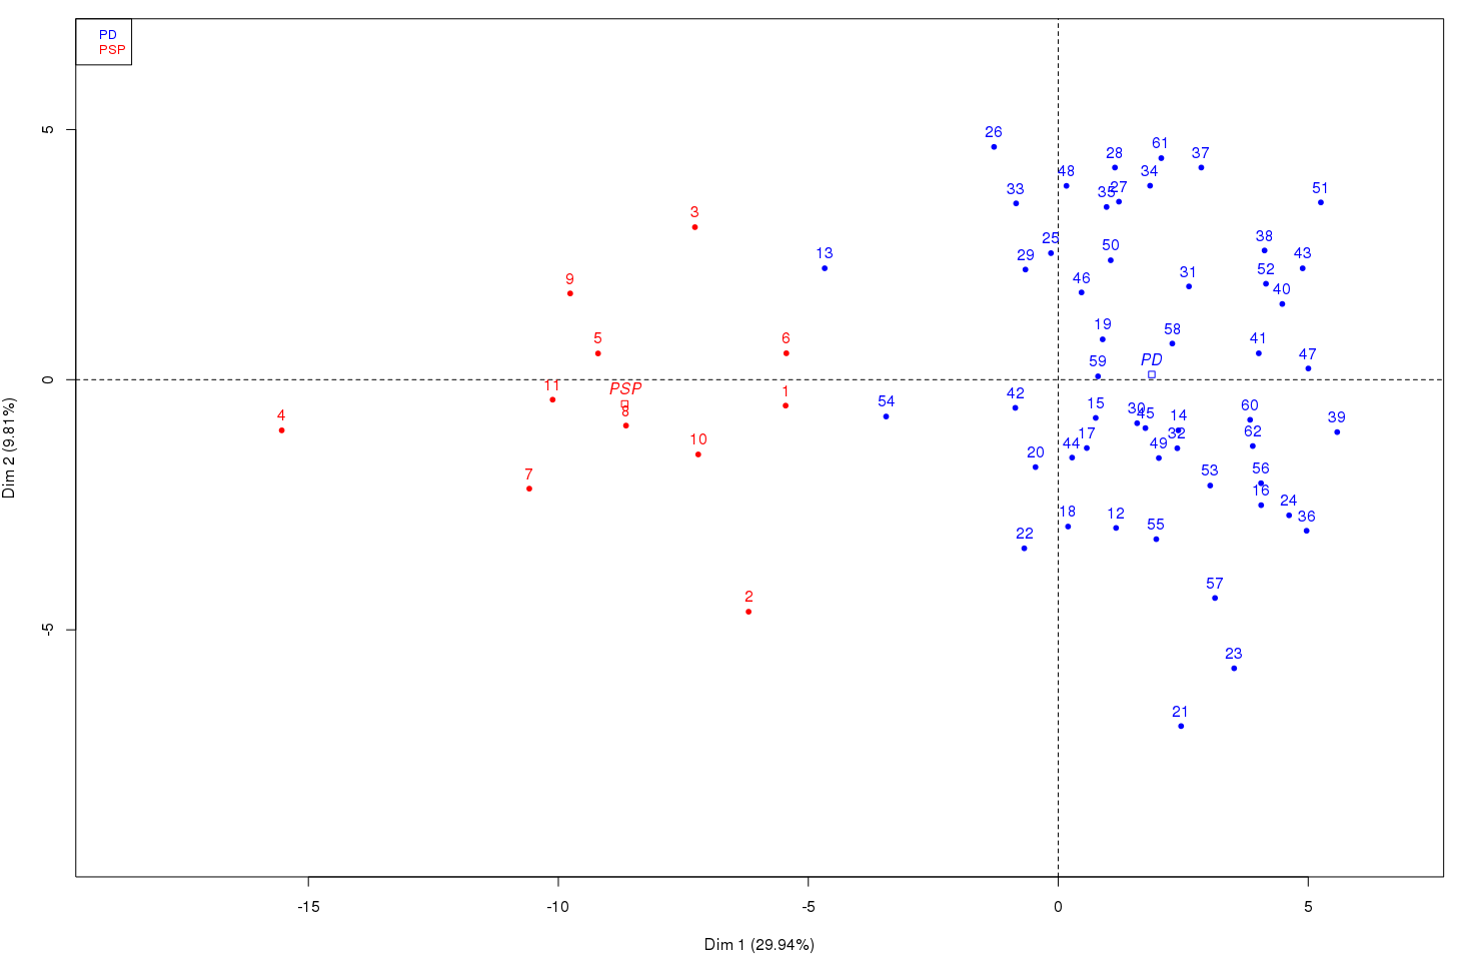
Factorial analysis was conducted and showed an excellent separation between PSP and PD based on the damage levels (Figure 4).
DISCUSSION
There was extensive brain damage in PSP patients, predominant in brainstem and basal ganglia regions. The regions that were damaged as well as the extent of damage corresponded to those previously reported in pathological studies. Quantitative MRI biomarkers allowed direct non-invasive assessment of brain damage in PSP in specific structures including small brainstem and basal forebrain nuclei.CONCLUSION
Our results showed that quantitative MRI biomarkers allowed to evidence in-vivo brain damage in PSP patients not only in large basal ganglia regions but also in small brainstem and basal forebrain structures corresponding to those previously reported in pathological studies. Moreover these biomarkers had an excellent diagnostic accuracy for differentiating PSP from PD patients.Acknowledgements
ANR nucleipark, DHOS-Inserm, France Parkinson, ENP and the Investissements d'Avenir, IHU-A-ICM, Paris Institute of Translational neuroscience ANR-10-IAIHU-06References
1. Colosimo C, Bak TH, Bologna M, Berardelli A. Fifty years of progressive supranuclear palsy. J Neurol Neurosurg Psychiatry, 2014; 85(8):938-44
2. Steele JC, Richardson JC, Olszewski J. Progressive supranuclear palsy. A heterogeneous degeneration involving the brain stem, basal ganglia and cerebellum with vertical gaze and pseudobulbar palsy, nuchal dystonia and dementia. Arch Neurol 1964; 10:333–359
3. David R Williams, Andrew J Lees. Progressive supranuclear palsy: clinicopathological concepts and diagnostic challenges. Lancet Neurol 2009; 8: 270–79
4. Zanignia S, Calandra-Buonaura G, Manners DN et al., Accuracy of MR markers for differentiating Progressive Supranuclear Palsy from Parkinson's disease. NeuroImage: Clinical. 2016; 736–742
5. Piattella MC, Upadhyay N, Bologna M, Neuroimaging evidence of gray and white matter damage and clinical correlates in progressive supranuclear palsy. J Neurol. 2015; 262(8):1850-8.
6. Bardinet E, Bhattacharjee M, Dormont D et al., A three-dimensional histological atlas of the human basal ganglia. II. Atlas deformation strategy and evaluation in deep brain stimulation for Parkinson disease. J Neurosurg. 2009; 110(2):208-19
7. García-Lorenzo D, Longo-Dos Santos C, Ewenczyk C, et al. The coeruleus/subcoeruleus complex in rapid eye movement sleep behaviour disorders in Parkinson’s disease. Brain J Neurol. 2013;136:2120–2129
Figures