0984
Disrupted Grey Matter Network Morphology in Parkinson's Disease1Huaxi MR Research Center (HMRRC), Department of Radiology, West China Hospital of Sichuan University, Chengdu, China, 2Department of Psychosis Studies, Institute of Psychiatry, Psychology & Neuroscience, King’s College London, London, United Kingdom, 3Department of Neurology, West China Hospital of Sichuan University, Chengdu, China
Synopsis
To use graph theory approaches and high resolution T1-weighted structural magnetic resonance imaging to explore the brain grey matter morphological network in patients with Parkinson's disease (PD). The individual morphological brain networks were constructed by estimating interregional similarity in the distribution of regional grey matter volume of 90 brain regions. The higher clustering coefficient and local efficiency in the PD patients relative to healthy controls were found, indicating that brain morphological networks are closer to regularization, which was different from previous functional connectome studies, suggesting relatively fixed structural network organization can produce diverse functional network patterns.
Introduction
Structural magnetic resonance imaging (MRI) has long been used to characterize local morphological features of the human brain. Coordination patterns of the local morphological features among regions, however, are not well understood. Single-subject morphological network analysis is a meaningful and reliable method to characterize structural organization of the human brain.1 Here, we aimed to use morphological networks analysis to examine the topological organization of brain in Parkinson's disease (PD) based on grey matter (GM) networks.Methods
MRI scanning were carried out in Trio Tim (3T) MR imaging system (Siemens; Erlangen). High resolution T1-weighted structural MRI brain images were obtained from 150 patients with PD and 142 age- and gender-matched healthy controls (HC). Briefly, individual structural images were first segmented into GM, white matter and cerebrospinal fluid. The GM maps were then divided into 90 numbers of brain regions according to AAL atlas. Individual morphological brain networks were constructed by estimating interregional similarity in the distribution of regional GM volume in terms of the Kullback–Leibler divergence measure. Graph-based global (clustering coefficient Cp, characteristic path length Lp, normalized Cp γ, normalized Lp λ, local efficiency Eloc ,global efficiency Eglobal, and small-worldness σ) and nodal (nodal degree, nodal efficiency, and nodal betweenness) network measures were then calculated, followed by the statistical comparison and intra-class correlation analysis. Region pairs with between-group differences of nodal characteristics in PD patients were assessed with the network-based statistics (NBS)2 toolbox to define a set of suprathreshold significant changes between any connected regions.Results
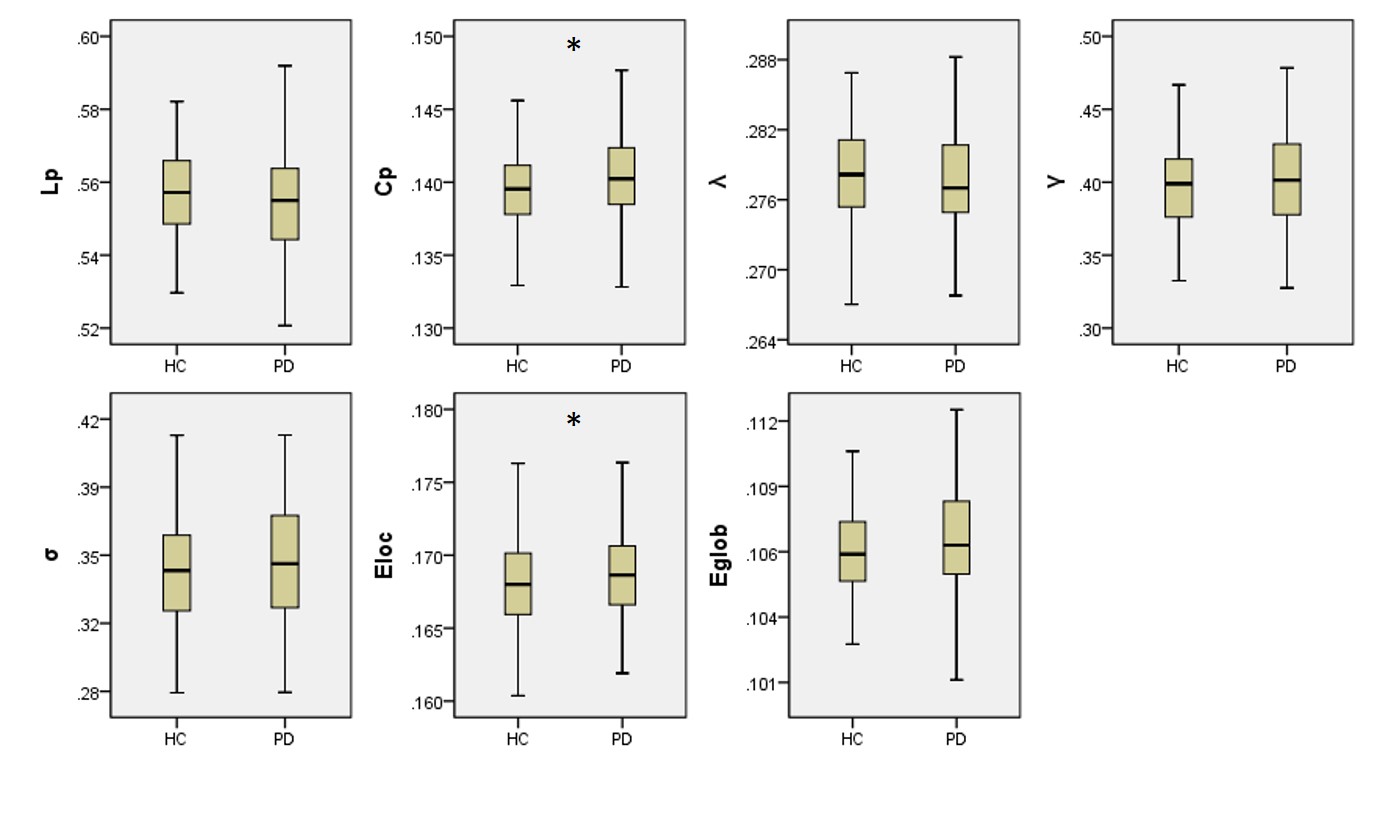
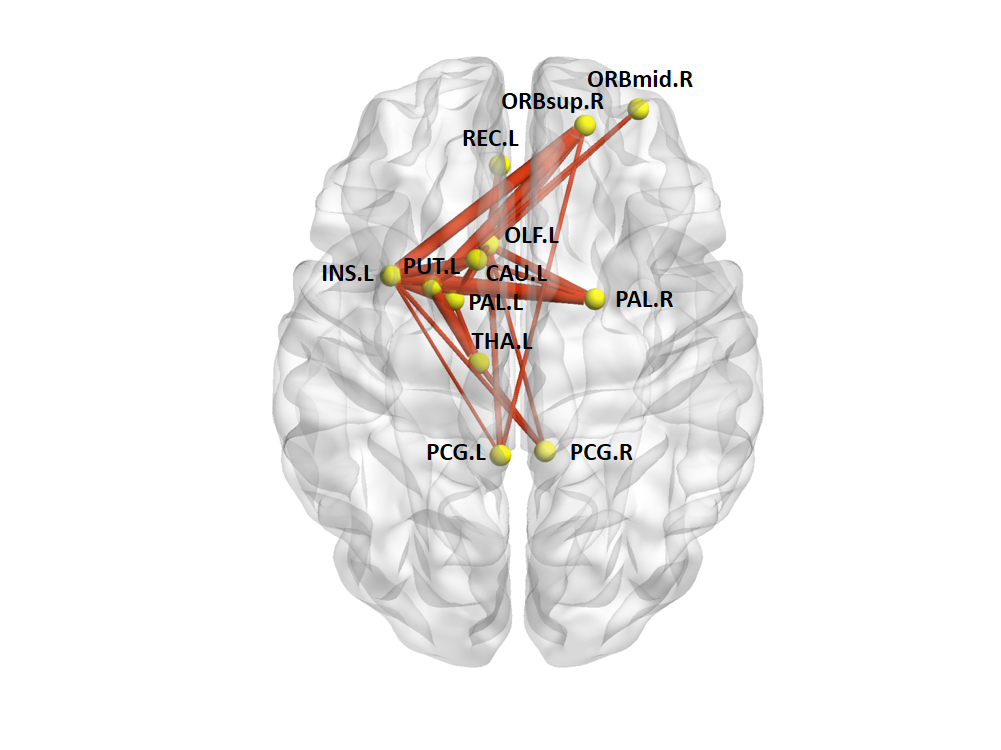
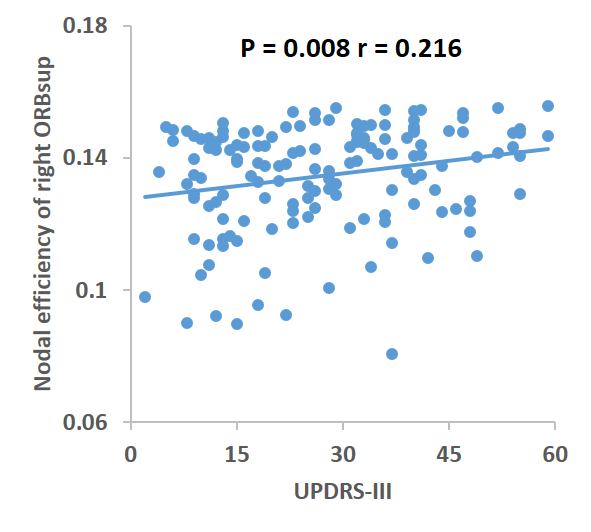
In the defined threshold range (0.10-0.34), both the PD and HC groups showed a γ greater than 1 and a λ approximately equal to 1, indicating that both groups exhibited a small-world architecture in brain morphological networks. However, compared with HC, the brain morphological networks of PD have significantly higher Cp (P = 0.0399) and Eloc (P = 0.0341), with no significant differences in Lp (P = 0.1157), γ (P = 0.3435), λ (P = 0.1463), σ (P = 0.2361) or Eglobal (P =0.0969) (Figure 1). Locally, PD patients exhibited higher nodal centralities in the right superior frontal gyrus, orbital part (ORBsup), left olfactory cortex, left insula, bilateral posterior cingulate cortex, left caudate, left putamen, left thalamus, and bilateral palladium. Lower nodal centralities were found in the right middle frontal gyrus, orbital part and left rectus gyrus (P < 0.05, FDR corrected). The NBS method identified a significantly altered network with 12 nodes and 25 connections in PD, mainly involved in frontal-striatal regions (Figure 2). Within this network, all of the connections were increased in PD compared with HC. Nodal efficiency of right ORBsup was positively with UPDRS-III (P = 0.008, r = 0.216) (Figure 3).Discussion
This study applied graph analysis combined with high resolution T1-weighted structural MRI brain images to assess large-scale brain morphological networks in PD patients. Compared with HC, the higher Cp and Eloc in the PD patients indicated that brain morphological networks are closer to 'regularization' which was different from the 'randomization'3 and 'less-small worldization'4 of previous functional connectome studies in PD. It indicated that relatively fixed structural network organizations can produce diverse functional network patterns. Disrupted nodal centralities in the default-mode and salience networks showed that the PD involves more widespread cerebral cortical areas, besides the mainly pathologic process in the nigrostriatal dopamine system, which was consistent with the previous study.5 Moreover, the disrupted nodal centrality of right ORBsup were related to the disease severity of the patients.Conclusion
Our analyses of topological brain morphological networks in PD indicate a shift toward "regularization" characterized by higher segregated organization. Disrupted nodal centrality are mainly involved in the default-mode and salience networks. These disrupted topological properties of the brain morphological networks help to clarify the pathogenesis of PD and could be potential biomarkers of brain abnormalities.Acknowledgements
This study was supported by the National Natural Science Foundation (Grant Nos. 81501452, 81621003, 81761128023, 81220108013, 81227002 and 81030027), the Program for Changjiang Scholars and Innovative Research Team in University (PCSIRT, grant IRT16R52) of China, the Changjiang Scholar Professorship Award (Award No. T2014190) of China, and the CMB Distinguished a Professorship Award (Award No. F510000/ G16916411) administered by the Institute of International Education. D.L. supported by Newton International Fellowship from the Royal Society.References
1. Wang H, Jin X, Zhang Y, Wang J. Single-subject morphological brain networks: connectivity mapping, topological characterization and test-retest reliability. Brain and behavior. 2016;6(4):e00448.
2. Zalesky A, Fornito A, Bullmore ET. Network-based statistic: identifying differences in brain networks. NeuroImage. 2010;53(4):1197-1207.
3. Luo CY, Guo XY, Song W, et al. Functional connectome assessed using graph theory in drug-naive Parkinson's disease. Journal of neurology. 2015;262(6):1557-1567.
4. Suo X, Lei D, Li N, et al. Functional Brain Connectome and Its Relation to Hoehn and Yahr Stage in Parkinson Disease. Radiology. 2017:162929.
5. Zhang J, Bi W, Zhang Y, et al. Abnormal functional connectivity density in Parkinson's disease. Behavioural brain research. 2015;280:113-118.
Figures