0983
Magnetic resonance spectroscopic imaging based biomarkers of Parkinson’s disease with mild cognitive impairment registered to MNI152 brain atlas after chemical shift correction1Biomedical Engineering Institute, Bogazici University, Istanbul, Turkey, 2Hulusi Behcet Life Sciences Research Center, Istanbul University, Istanbul, Turkey, 3Psychology and Cognition Research Institute, Bremen University, Bremen, Germany, 4Department of Neurology, Istanbul University, Istanbul, Turkey, 5Department of Physiology, Istanbul University, Istanbul, Turkey
Synopsis
Mild cognitive impairment in Parkinson’s disease (PD-MCI) is one of the most significant risk factors for Parkinson’s disease dementia. In this study, we defined proton magnetic resonance spectroscopic imaging (1H-MRSI) based biomarkers of PD-MCI. After chemical shift misregistration correction and registration to MNI152 brain atlas of multi-voxel 1H-MRSI data, 101 regions defined in MNI structural and Harvard-Oxford cortical and subcortical structural atlases were analyzed for metabolic differences between PD-MCI, cognitively normal PD (PD-CN) and healthy controls. Temporal occipital fusiform cortex, and posterior divisions of parahippocampal gyrus and right temporal fusiform cortex were indicated as the main regions for metabolic differences.
Purpose
Mild cognitive impairment in Parkinson’s disease (PD-MCI) is one of the main risk factors for dementia later in life. Proton MR spectroscopic imaging (1H-MRSI) provides metabolic information that could be used to define biomarkers for PD-MCI. Previous single voxel 1H-MRS studies have shown higher Cho/Cr and lower NAA/Cr in posterior cingulate gyrus and occipital lobe of patients with PD-MCI than healthy controls (HC)1,2,3. Chemical shift misregistration is one of the main problems of multi-voxel 1H-MRSI. It is also difficult to integrate 1H-MRSI data into multimodality MR data analysis due to its limited FOV. In this study, we applied chemical shift misregistration correction to 1H-MRSI of PD-MCI, cognitively normal PD patients (PD-CN) and HC subjects and registered 1H MR spectroscopic peak parameter maps overlaid onto reference T2-weighted MR images to MNI152 brain atlas for an atlas-based ROI analysis4,5 of cognitive impairment in PD.Methods
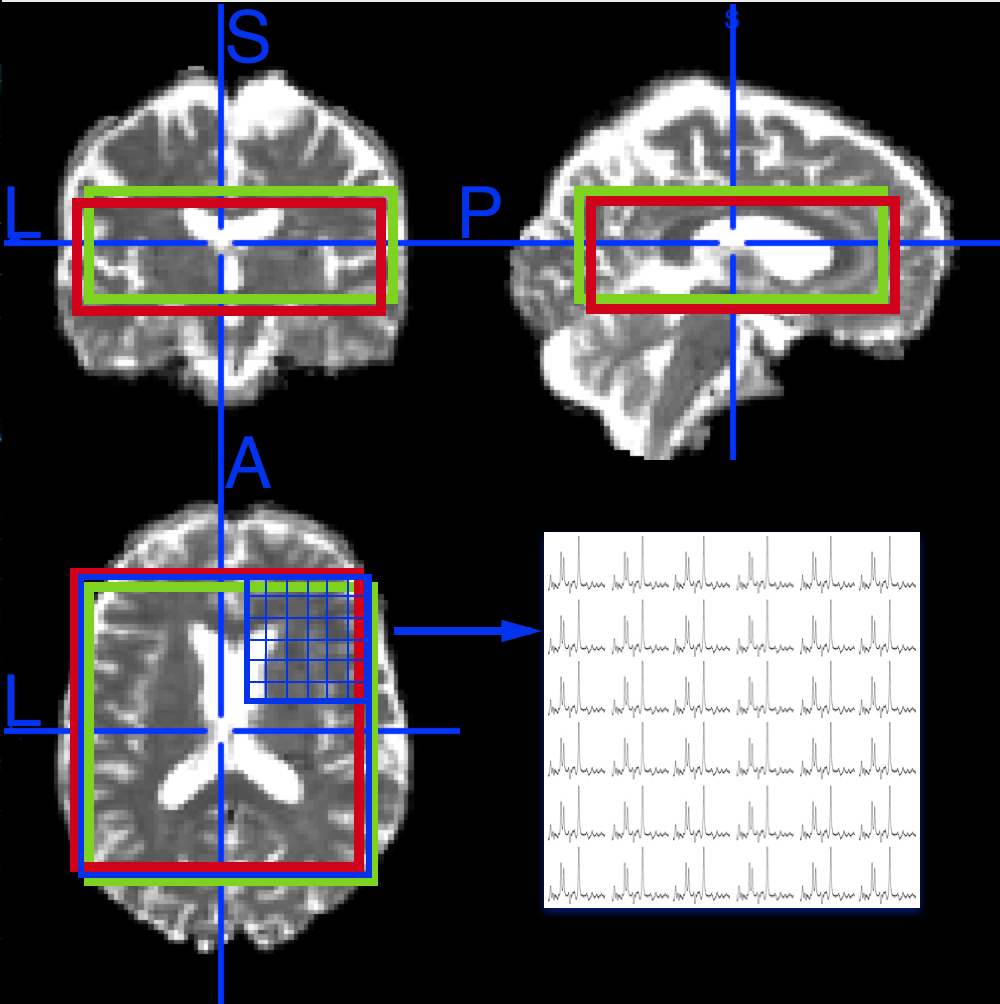
A total of 77 participants (34 with PD-MCI, 25 with PD-CN, and 18 healthy controls) were scanned at a 3T Philips MR scanner (Best, Netherlands) using Point-RESolved Spectroscopy (PRESS) sequence (TR=1000ms, TE=52ms, 1000Hz, 1024 points,14x14x3 array, voxel size=10x10x10mm, scan time=8min). MR spectroscopic metabolite concentrations were quantified by using LCModel6 and chemical shift corrected metabolite concentration maps were produced by calculating the chemical shift amount of each metabolite. Figure 1 shows lactate (red box) and creatine (green box) metabolite map locations after chemical shift correction along with the reference NAA map location for a healthy control subject. Metabolite maps were overlaid onto reference T2-weighted MR images according to their spatial location information and overlaid metabolite concentration maps were then registered to MNI152 brain atlas7 by using FMRIB's Software Library (FSL)8. The metabolite concentration values were determined in 101 different brain regions defined by MNI structural9, and Harvard-Oxford cortical and subcortical structural atlases10. A Kruskal-Wallis test followed by Dunn’s post-hoc test was used to assess statistically significant differences between the subject groups. A P-value of less than 0.05/3 was considered as statistically significant.Results
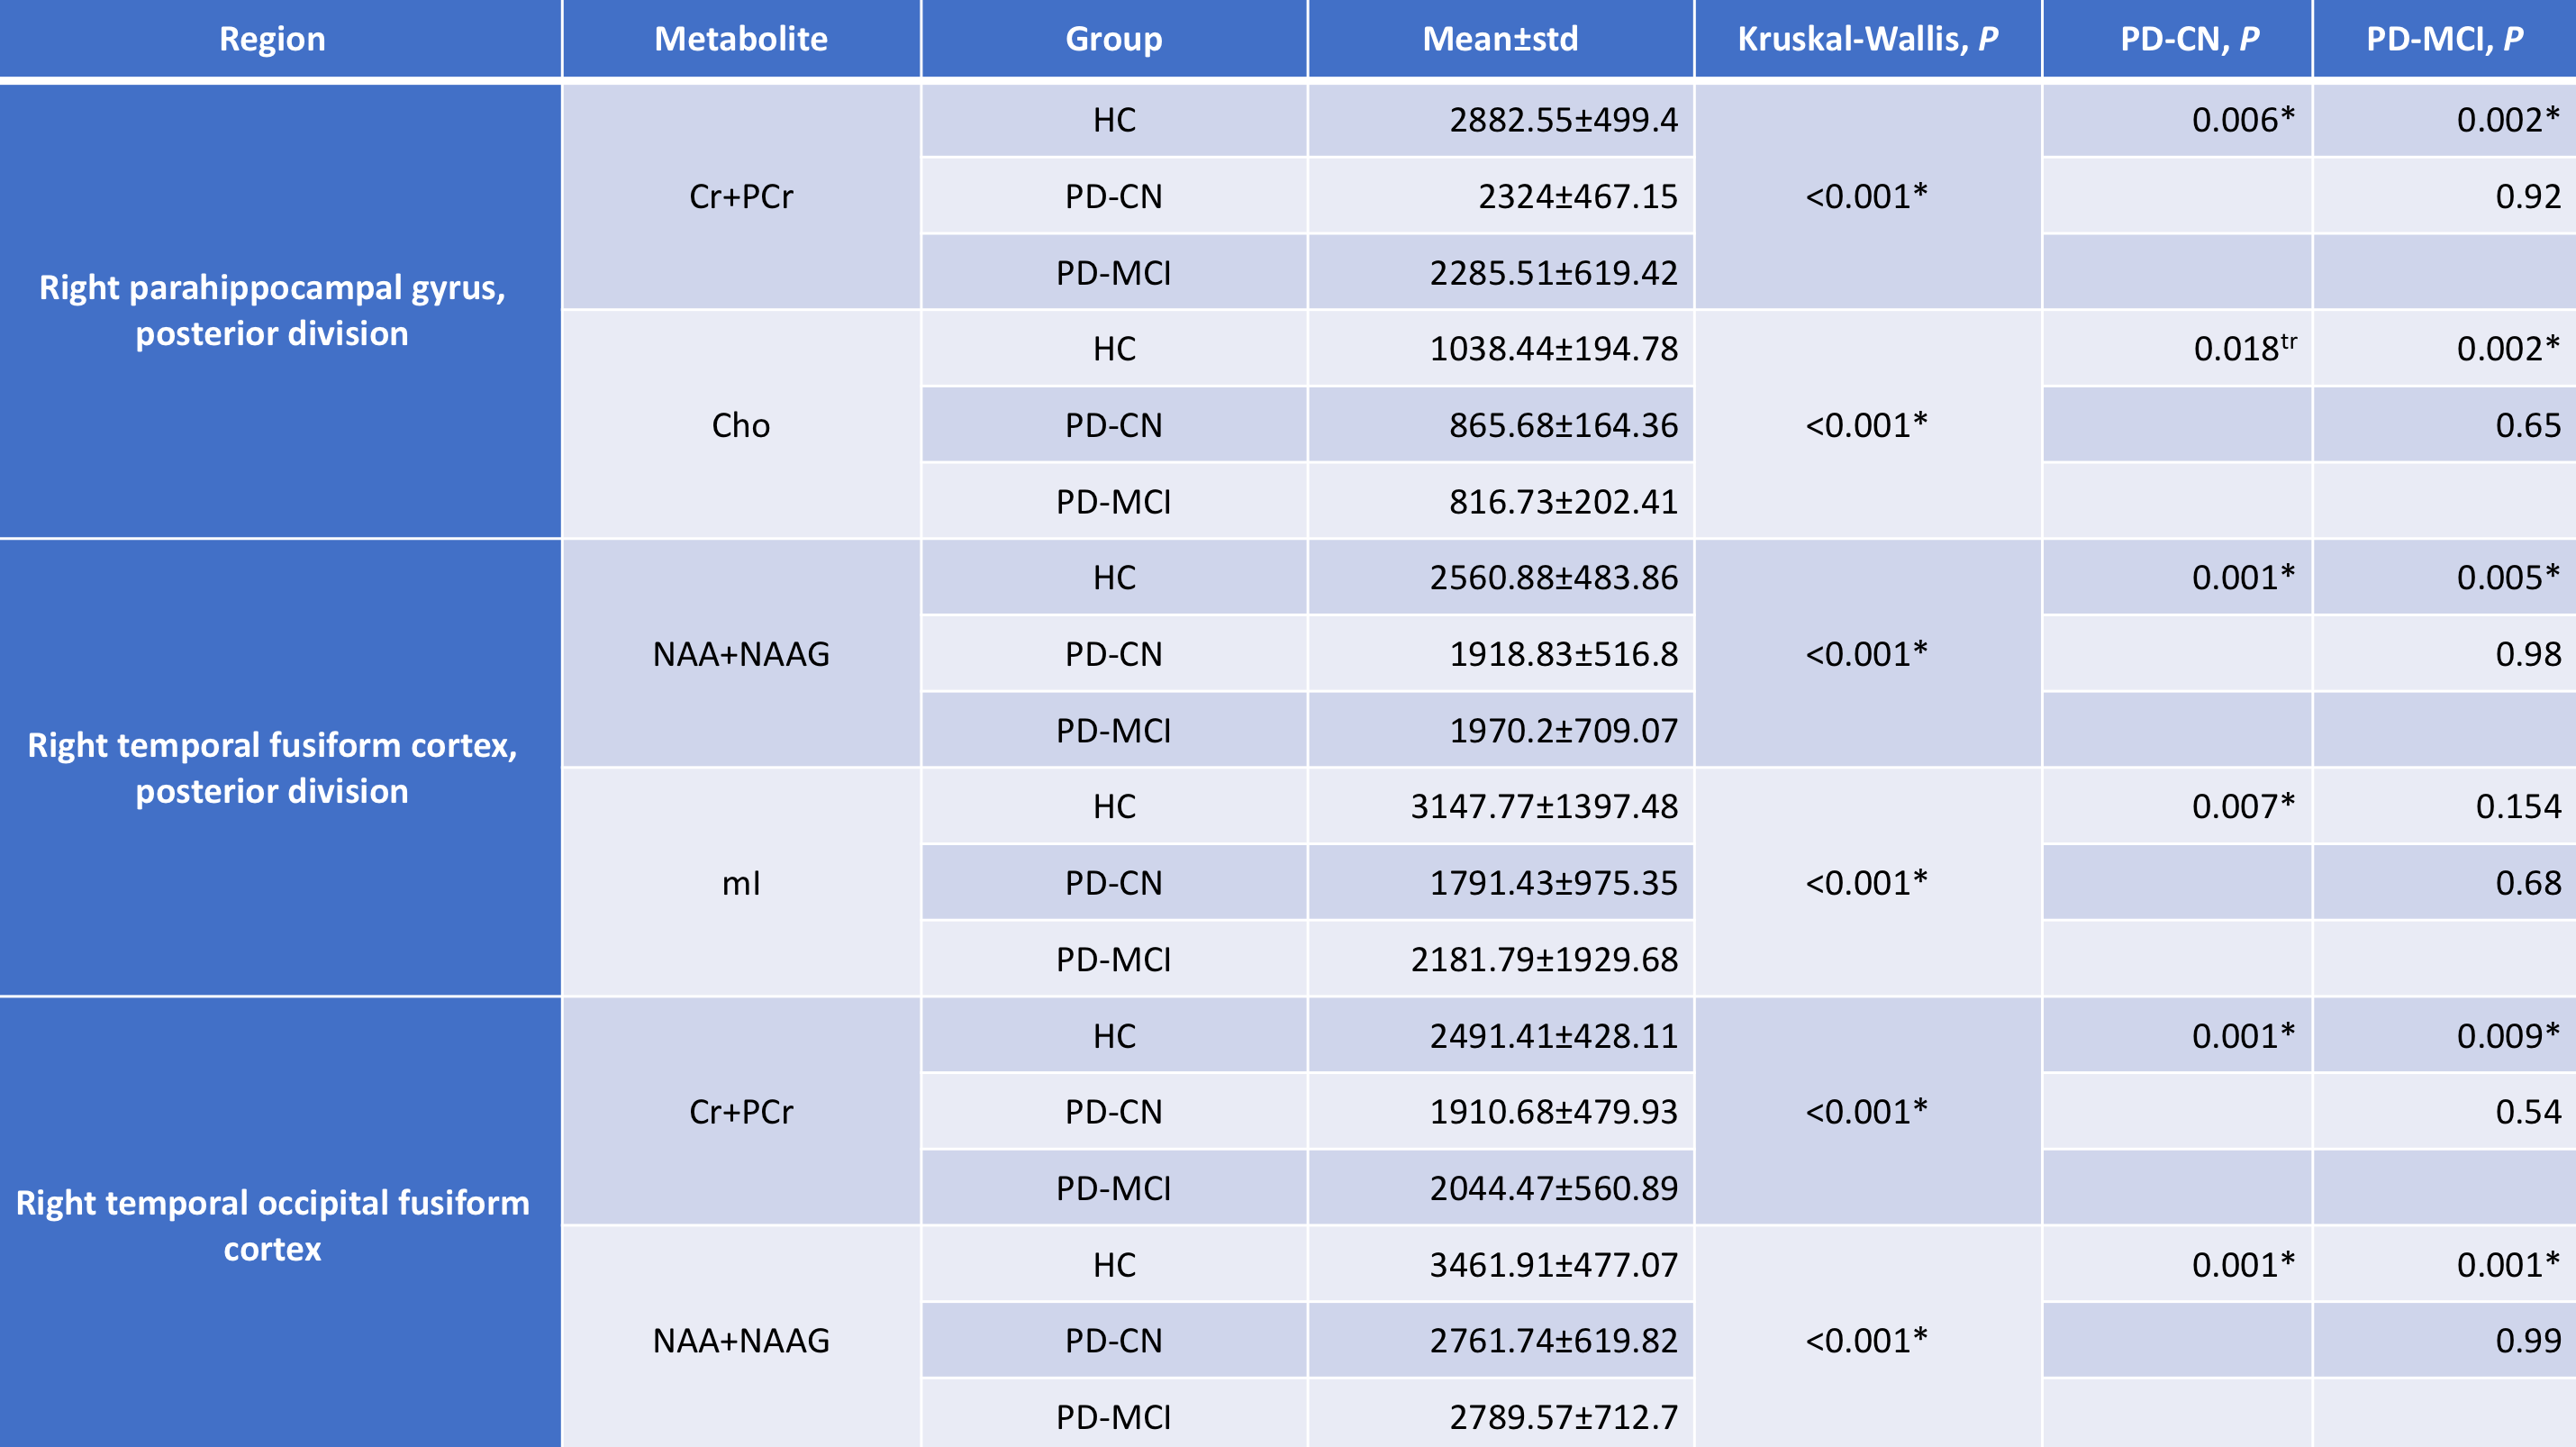
Table 1 shows the mean values (±std) of creatine and phosphocreatine (Cr+PCr), N-acetylaspartate and N-acetyl-aspartyl glutamate (NAA+NAAG), choline (Cho), and myoinositol (mI) in different brain regions and P-values calculated using a Kruskal-Wallis test. According to the results, HC had a higher Cr+PCr and Cho than both PD-MCI (P=0.002) and PD-CN (P=0.006, P=0.018) at the posterior division of right parahippocampal gyrus. In the posterior division of right temporal fusiform cortex, HC had a higher NAA+NAAG (P=0.001) and mI (P=0.007) than PD-CN. Additionally, HC had a higher NAA+NAAG (P=0.005) than PD-MCI at this region. In right temporal occipital fusiform cortex, HC had a higher Cr+PCr and NAA+NAAG than both PD-CN (P=0.001) and PD-MCI (P=0.009, P=0.001).Discussion
Lower NAA+NAAG observed at the posterior division of right temporal fusiform cortex and right temporal occipital fusiform cortex of PD-CN and PD-MCI than HC may be related to cognitive impairment1. Previous studies related volume loss at the posterior part of the parahippocampal gyrus with age-related memory decline11. Our findings of lower Cr+PCr observed at the same region in PD-MCI might indicate a possible energy metabolism deficiency with cognitive impairment.Conclusion
This study produced chemical shift corrected 1H-MRSI metabolite maps registered to MNI152 brain atlas, which enabled an ROI based analysis at over 100 regions. Our future studies will focus on integrated analysis of 1H-MRSI data with other MNI152 registered MRI data for improved definition of biomarkers of cognitive impairment in PD.
Acknowledgements
This study was supported by TUBITAK project #115S219 and the Ministry of Development project #2010K120330.References
1. Nie, K., et al., Marked N-acetylaspartate and choline metabolite changes in Parkinson's disease patients with mild cognitive impairment. Parkinsonism Relat Disord, 2013. 19(3): p. 329-34.
2. Pagonabarraga, J., et al., Spectroscopic changes associated with mild cognitive impairment and dementia in Parkinson's disease. Dement Geriatr Cogn Disord, 2012. 34(5-6): p. 312-8.
3. Camicioli, R.M., et al., Posterior cingulate metabolic changes occur in Parkinson's disease patients without dementia. Neurosci Lett, 2004. 354(3): p. 177-80.
4. Greve, D.N. and B. Fischl, Accurate and robust brain image alignment using boundary-based registration. Neuroimage, 2009. 48(1): p. 63-72.
5. Poldrack, R.A., Region of interest analysis for fMRI. Soc Cogn Affect Neurosci, 2007. 2(1): p. 67-70.
6. Provencher, S.W., Automatic quantitation of localized in vivo 1H spectra with LCModel. NMR Biomed, 2001. 14(4): p. 260-4.
7. Mazziotta, J.C., et al., A probabilistic atlas of the human brain: theory and rationale for its development. The International Consortium for Brain Mapping (ICBM). Neuroimage, 1995. 2(2): p. 89-101.
8. Woolrich, M.W., et al., Bayesian analysis of neuroimaging data in FSL. Neuroimage, 2009. 45(1 Suppl): p. S173-86.
9. Mazziotta, J., et al., A probabilistic atlas and reference system for the human brain: International Consortium for Brain Mapping (ICBM). Philos Trans R Soc Lond B Biol Sci, 2001. 356(1412): p. 1293-322.
10. Makris, N., et al., Decreased volume of left and total anterior insular lobule in schizophrenia. Schizophr Res, 2006. 83(2-3): p. 155-71.
11. Burgmans S, v.B.M., van den Berg KE, Gronenschild EH, Jacobs HI, Jolles J, Uylings HB, The posterior parahippocampal gyrus is preferentially affected in age-related memory decline. Neurobiology of aging. , 2011. 32: p. 1572–1578.
Figures