0979
Connectomics Correlates of Neurocognitive Deficits in Gulf War Illness Patients: A Resting State fMRI Study1Department of Radiology, Emory University, Atlanta, GA, United States, 2University of Houston Clear-Lake, Houston, TX, United States, 3VA RR&D Center of Excellence, Atlanta VAMC, Decatur, GA, United States, 4Department of Neurology, Emory University, Atlanta, GA, United States, 5Department of Internal Medicine, UT Southwestern Medical Center, Dallas, TX, United States
Synopsis
Around 200,000 veterans of the 1991 Gulf War (GW) suffer from GW illness (GWI), which is characterized by multiple deficits in cognitive, emotion, sensory and interoception domains. In this study we examined resting state fMRI data from 23 GWI patients and 30 age-matched controls with group independent components analysis (ICA). Deficits in neurocognitive assessment scores of different brain function domains in GWI veterans strongly correlated with impaired functional connectivity within and between specific brain function networks engaged during performance of the corresponding neuropsychological tests, thereby elucidating brain mechanisms underlying cognitive deficits in GWI.
INTRODUCTION
Around 200,000 veterans (up to 32% of those deployed) of the 1991 Gulf War (GW) suffer from GW illness (GWI). GWI is a poorly understood chronic medical condition, characterized by multiple symptoms indicative of brain function deficits in cognitive, emotion, sensory and interoception domains1-8. In this study, we employed resting state fMRI (rsFMRI) to probe impairments in specific brain function networks that underlie the deficits in fine motor skills, visuospatial ability, and sustained attention functions in GWI veterans observed previously through neurocognitive assessments.METHODS
Twenty-three GWI veterans (mean age 49.4 yrs.) and thirty normal controls (NC) (mean age 49.8 yrs.), were scanned in a Siemens 3T MRI scanner using a 12-channel Rx head coil. Written informed consent was obtained from all participants in the protocol approved by the local Institutional Review Board. rsFMRI data were acquired with a 10-min whole-brain gradient echo EPI (TR/TE/FA = 2000/24ms/90°, resolution = 3mm x 3mm x 3.5mm). rsFMRI preprocessing steps included attenuation of signal related to subject-motion and physiological responses, using advanced independent components analysis (ICA) based artifact reduction techniques9, and spatial smoothing with FWHM = 6mm isotropic Gaussian kernel. A group spatial ICA10 was performed on temporally concatenated data of the whole group of 53 subjects, with the Infomax algorithm, using the GIFT software10,11. In order to adequately account for differences in resting state networks between GWI and control subjects, high-dimensional group ICA12 (with 44 independent components) was employed, with the stability of the resultant ICs checked with GIFT’s Icasso13 utility. For each subject, the functional network connectivities (FNCs) between the different ICs (obtained through back-projection10 of the group ICs), were assessed with cross-correlation (CC) analysis. The neuropsychological test battery results available for each subject, included performance scores from the grooved pegboard (GP) test for fine motor dexterity, Rey-Osterrieth complex figure (ROCF) test for visuospatial ability, and the Connors’ continuous performance test (CPT) for sustained attention and concentration. The relationship between the FNCs (quantified by z-transformed CCs) between different brain networks relevant to a given neuropsychological assessment (e.g., CPT), and the subjects’ performances scores, were assessed with linear regression.RESULTS & DISCUSSION
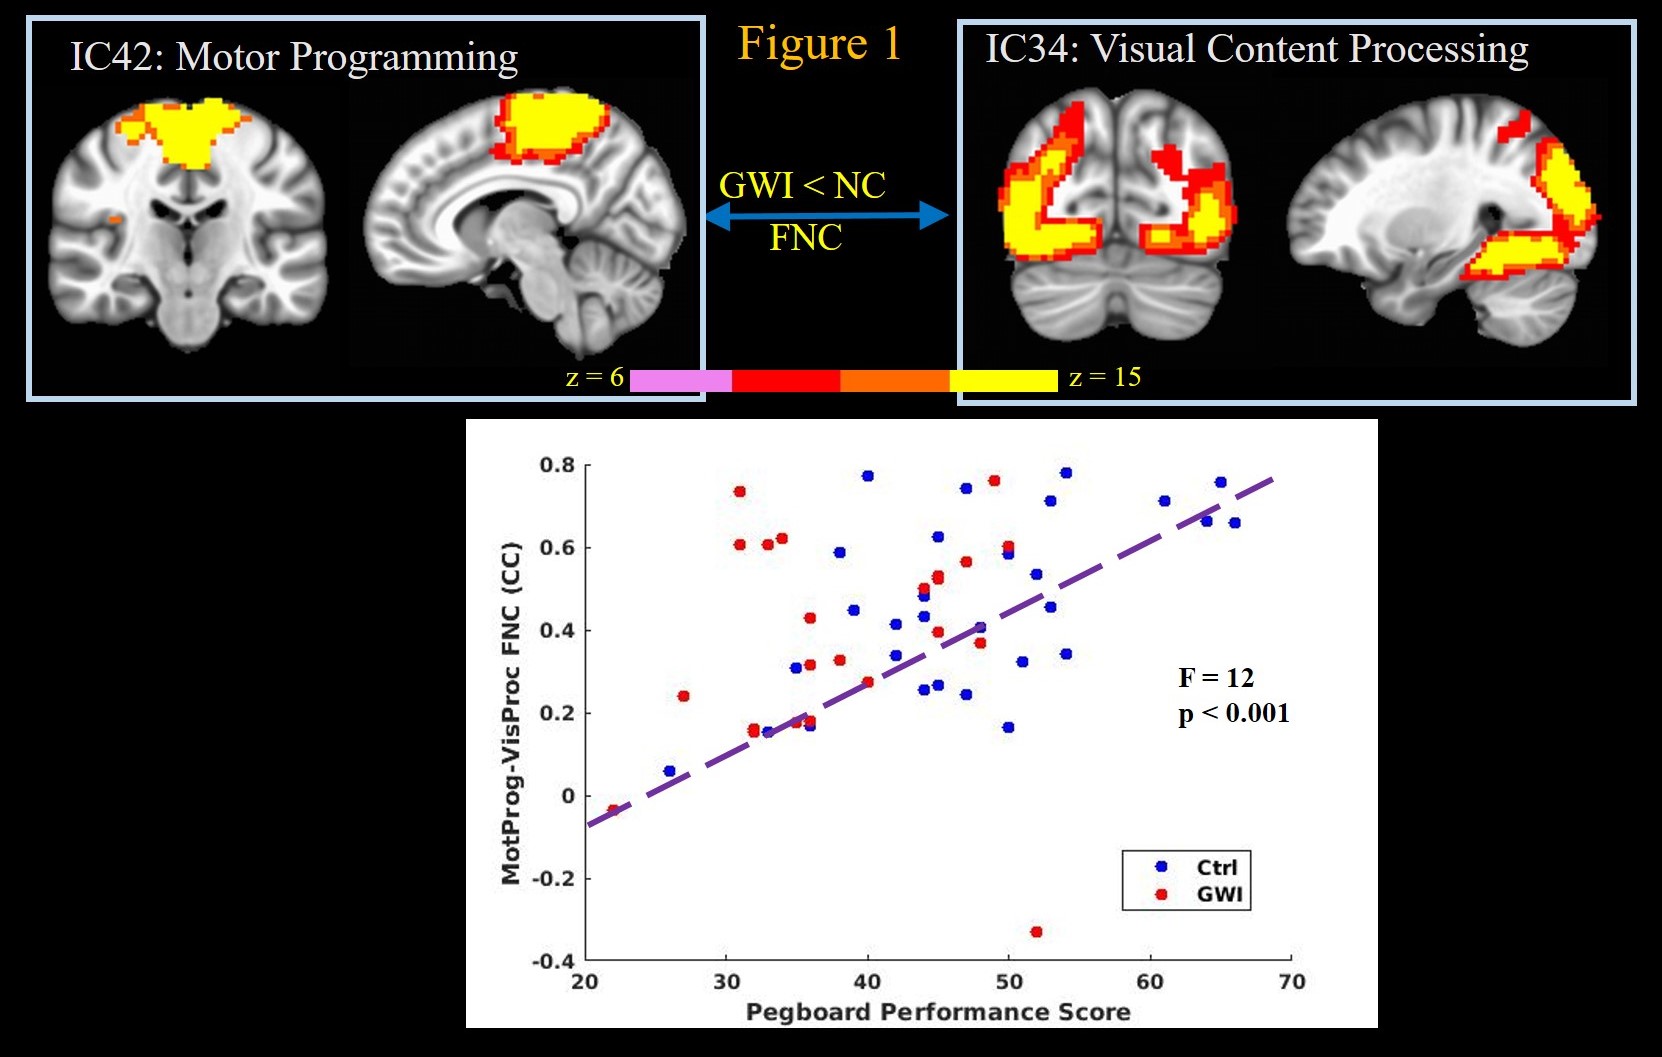
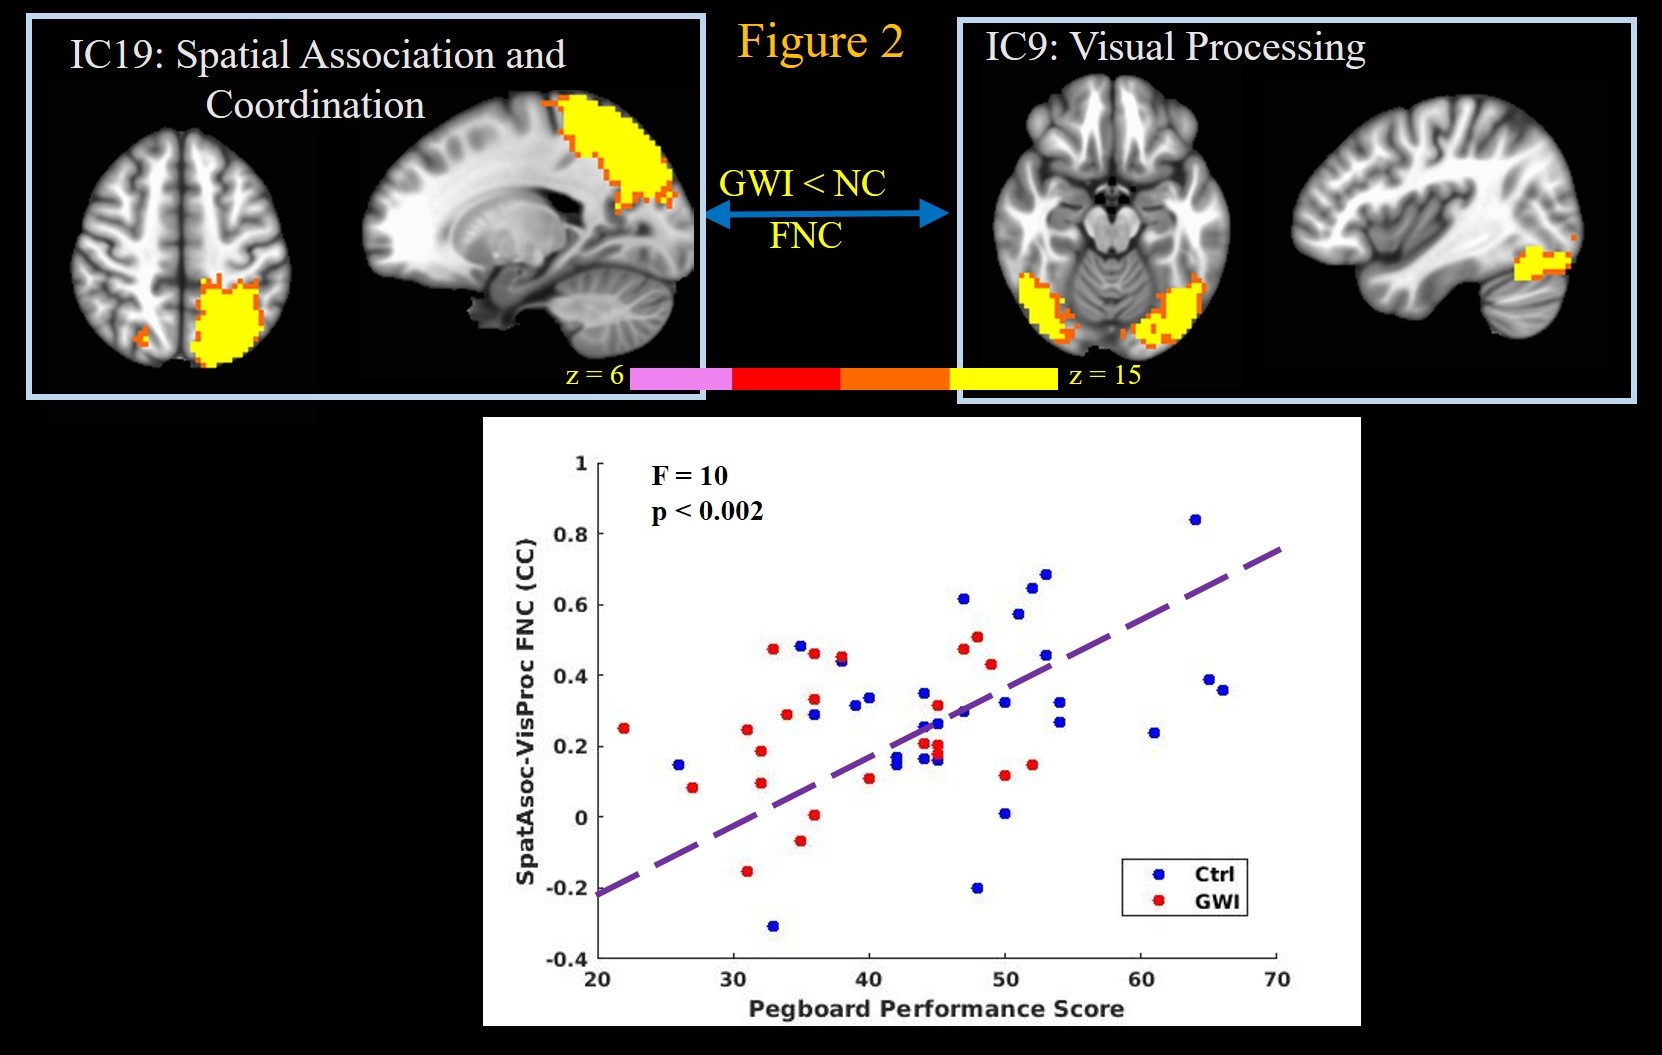
GWI veterans exhibited significantly (2-sample t-test p < 0.006 and p < 0.03 respectively) decreased GP, and ROCF performance scores, and committed significantly (p < 0.001) more errors in the CPT test, compared to normal controls. The GP test engages simple motor, motor planning, spatial coordination, visual, as well as multi-sensory processing functions14. Linear regression revealed highly significant (p < 0.002) relationships between GP performance scores and FNCs of IC that constituted motor programming with visual content processing (Figure 1), and motor network (not shown) ICs; as well as FNC of parietal spatial association/coordination network IC with the visual processing network IC (Figure 2); with better GP performance scores predicting stronger FNCs. These results indicate loss of fine motor skills in GWI veterans arising from impaired visual coordination and ability to perform complex motor functions.
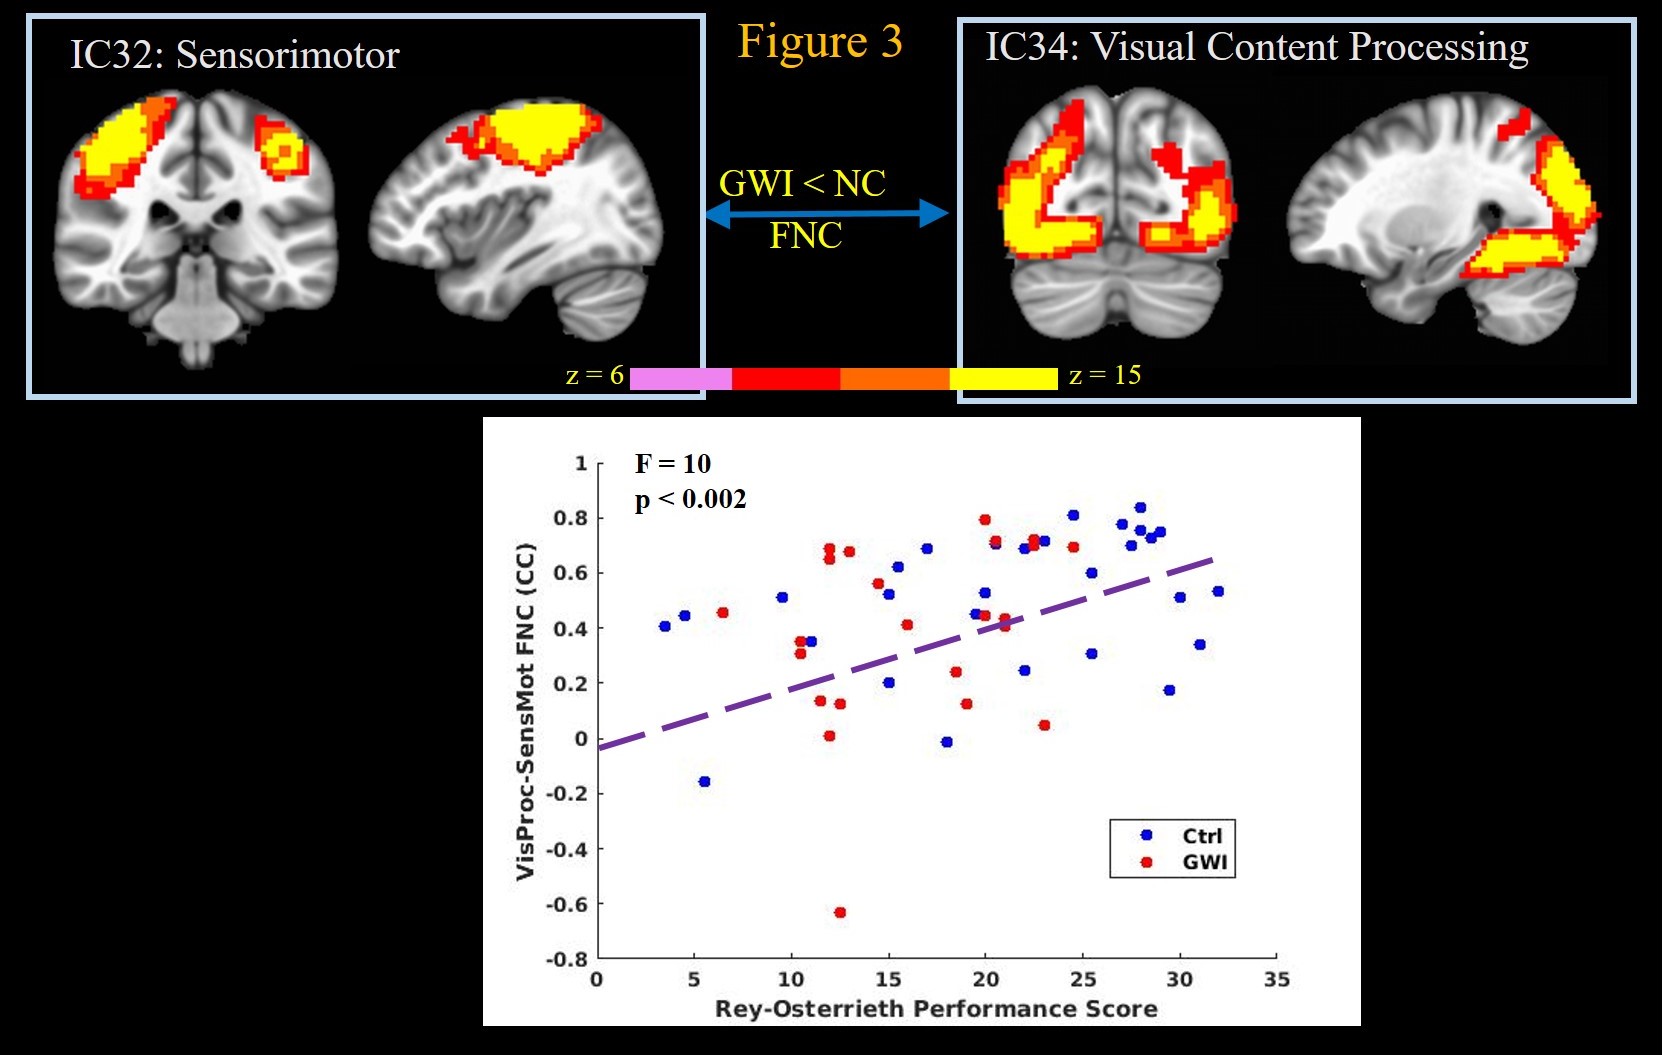
ROCF test engages visuospatial ability, memory, multisensory processing, motor planning, executive function, and attention15. Higher ROCF delayed recall scores in subjects correlated (p < 0.002) with stronger FNC between ICs constituting visual content processing and sensorimotor ICs (Figure 3); as well as with FNC between primary visual cortex IC and scene processing network IC (not shown). Thus impaired performance of GWI veterans in ROCF test arises from decreased connectivity between primary and higher level visual systems, as well as deficits in multisensory processing abilities, arising from decreased connectivity between sensorimotor and visual processing networks.
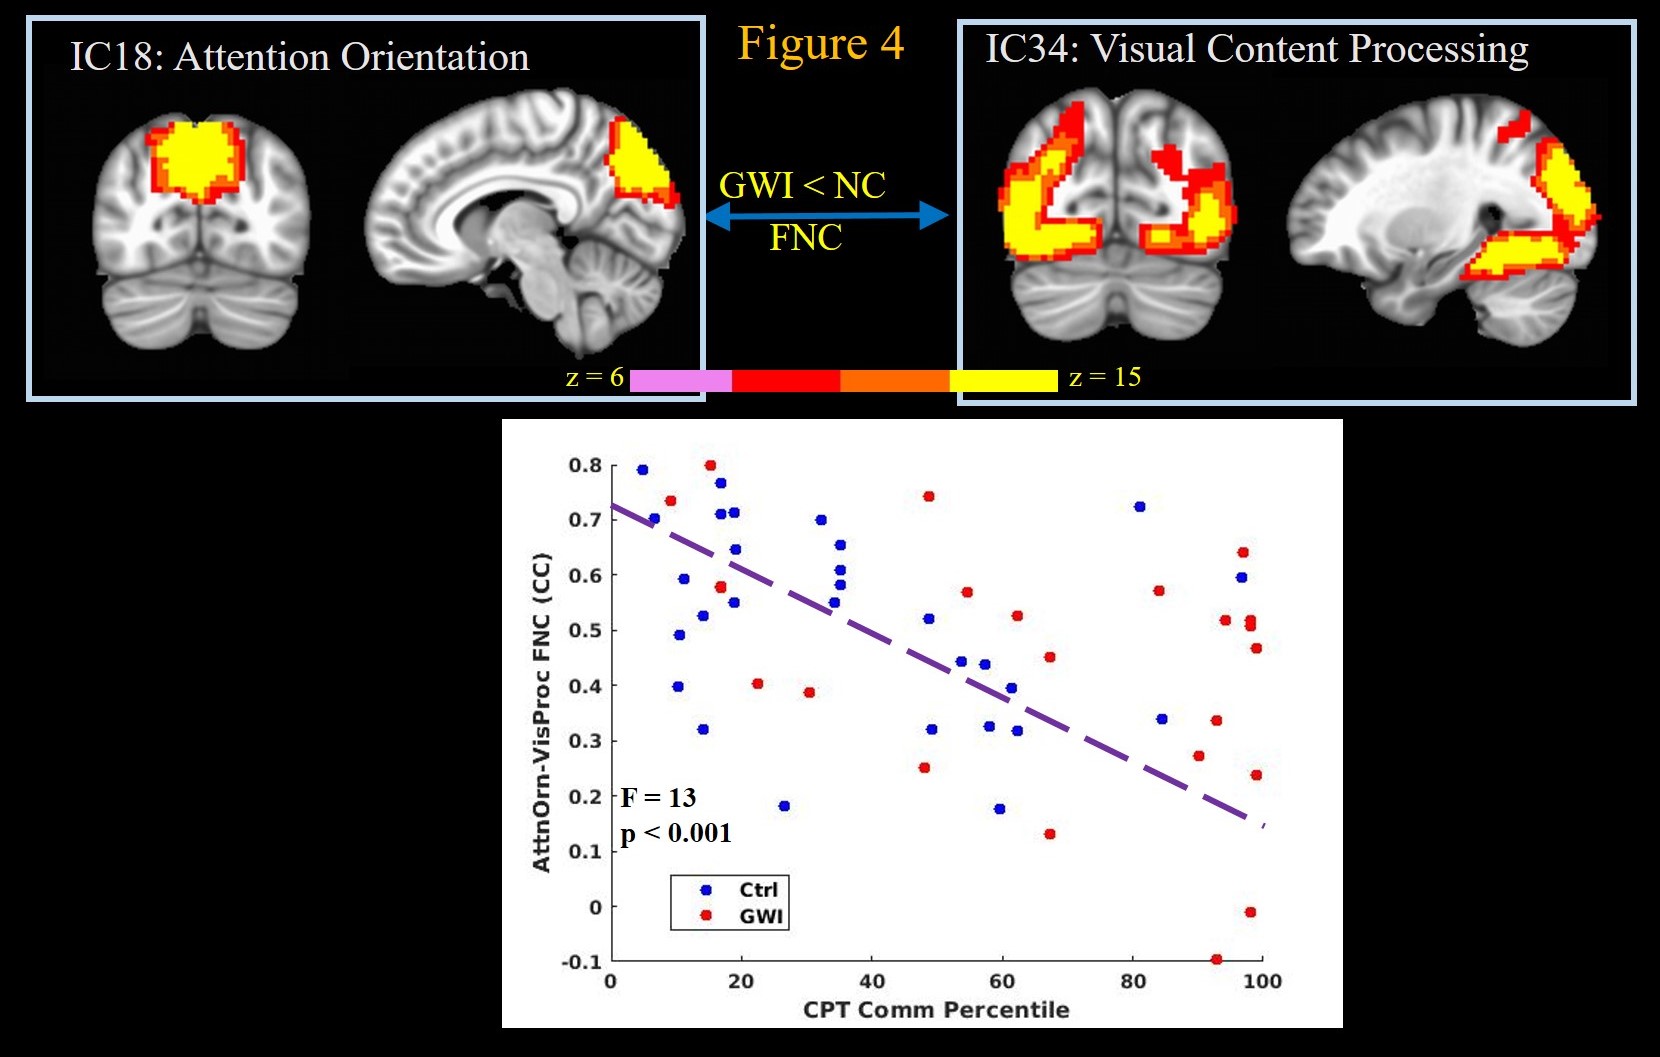
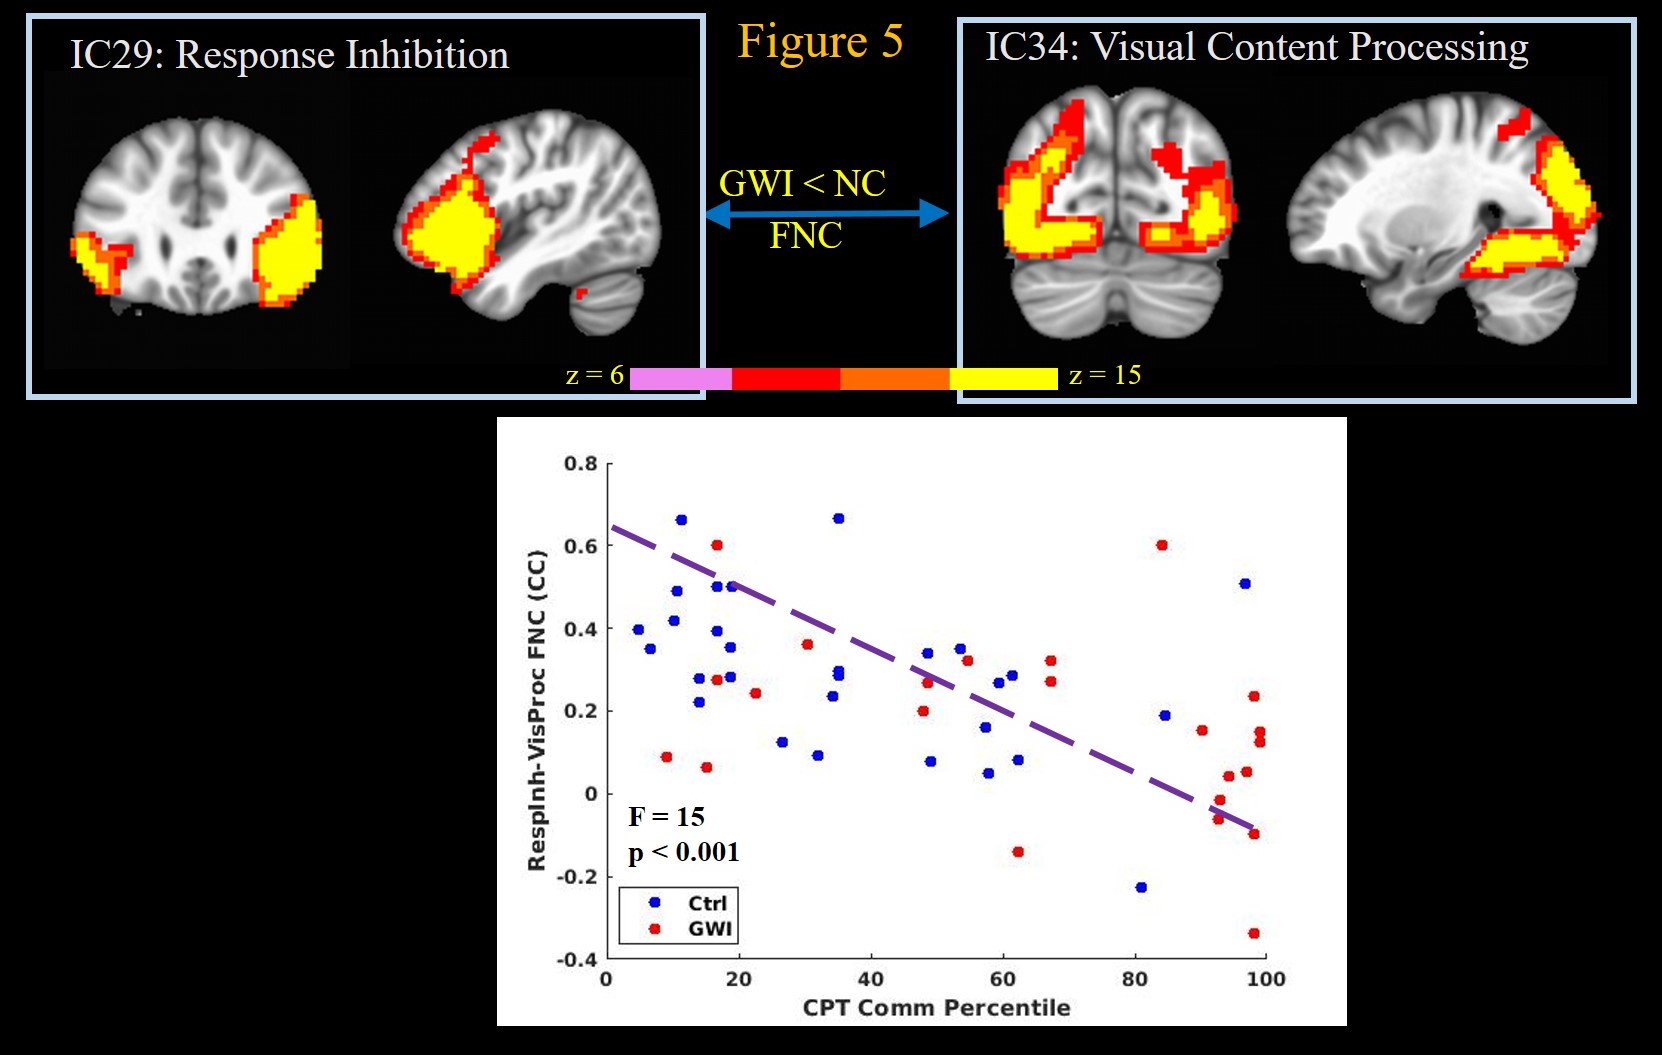
Finally the CPT task engages attention, concentration, visual and motor networks16. Increased commission of errors in the CPT strongly correlated (p < 0.002) with decreased FNC between attention orientation network IC and visual processing (Figure 4) and sensorimotor (not shown) network ICs; and decreased FNC between response inhibition and visual processing network ICs (Figure 5); and decreased FNC between sensorimotor and motor programming network ICs (not shown). Thus increased commission of errors during CPT task by GWI veterans seems to arise from impaired connectivity of attention orientation and response inhibition areas with those of visual input processing and motor execution components of the task.
CONCLUSION
The results elucidate brain mechanisms underlying behavioral deficits observed in GWI veterans quantified by neurocognitive assessments. Thus, the results support a neurological basis for GWI, which could have been potentiated by various neurotoxic exposures experienced by these veterans in the Gulf War theater 1,2. In future work, we will extend our analyses to a larger GW veterans cohort.Acknowledgements
This work was supported by the Office of Assistant Secretary of Defense for Health Affairs, through the Gulf War Illness Research Program under Award No.W81XWH-16-1-0744 (PI: Gopinath). Opinions, interpretations, conclusions and recommendations are those of the author and are not necessarily endorsed by the Department of Defense.References
1. Haley RW, Kurt TL, et al. Is there a Gulf War Syndrome? Searching for syndromes by factor analysis of symptoms. JAMA 1997;277:215-22.
2. Binns JH, Barlow C, et al. Report of Research Advisory Committee on Gulf War Veterans’ Illnesses. In: Affairs DoV, ed. Washington, D.C.: U.S. Government Printing Office; 2008.
3. Gopinath K, Gandhi P, et al. FMRI reveals abnormal central processing of sensory and pain stimuli in ill Gulf War veterans. Neurotoxicology 2012;33:261-71.
4. Moffett K, Crosson B, et al. Word-finding impairment in veterans of the 1991 Persian Gulf War. Brain Cogn 2015;98:65-73.
5. Goldstein G, Beers SR, et al. A preliminary neuropsychological study of Persian Gulf veterans. J Int Neuropsychol Soc 1996;2:368-71.
6. White RF, Proctor SP, et al. Neuropsychological function in Gulf War veterans: relationships to self-reported toxicant exposures. Am J Ind Med 2001;40:42-54.
7. Toomey R, Alpern R, et al. Neuropsychological functioning of U.S. Gulf War veterans 10 years after the war. J Int Neuropsychol Soc 2009;15:717-29.
8. Calley CS, Kraut MA, et al. The neuroanatomic correlates of semantic memory deficits in patients with Gulf War illnesses: a pilot study. Brain Imaging Behav 2010;4:248-55.
9. Pruim RH, Mennes M, et al. ICA-AROMA: A robust ICA-based strategy for removing motion artifacts from fMRI data. Neuroimage 2015;112:267-77.
10. Calhoun VD, Adali T, et al. A method for making group inferences from functional MRI data using independent component analysis. Hum Brain Mapp 2001;14:140-51.
11. Eolf E, Rachakonda S, et al. Group ICA fMRI Toolbox (GIFT): New signal processing techniques applied to brain imaging: Abstracts of the Society of Biological Psychiatry 59th Annual Meeting. April 29-May 1, 2004, New York, New York, USA. Biol Psychiatry 2004;55:1S-256S.
12. Dipasquale O, Griffanti L, et al. High-Dimensional ICA Analysis Detects Within-Network Functional Connectivity Damage of Default-Mode and Sensory-Motor Networks in Alzheimer's Disease. Front Hum Neurosci 2015;9:43.
13. Himberg J, Hyvarinen A, et al. Validating the independent components of neuroimaging time series via clustering and visualization. Neuroimage 2004;22:1214-22.
14. Fujisaki W. Effects of delayed visual feedback on grooved pegboard test performance. Front Psychol 2012;3:61.
15. Shin MS, Park SY, et al. Clinical and empirical applications of the Rey-Osterrieth Complex Figure Test. Nat Protoc 2006;1:892-9.
16. Ogg RJ, Zou P, et al. Neural correlates of a clinical continuous performance test. Magn Reson Imaging 2008;26:504-12.
Figures