0978
CO2-challenge measured with dual echo arterial spin labeling as a whole brain biomarker to assess the effect of amyloid deposition in HCHWA-D on the cerebrovascular reactivity.1C.J. Gorter Center, Radiology, Leiden University Medical Center, Leiden, Netherlands, 2Leiden Institute of Brain and Cognition (LIBC), Leiden, Netherlands, 3Neurology, Leiden University Medical Center, Leiden, Netherlands, 4Radiology, Leiden University Medical Center, Leiden, Netherlands
Synopsis
In this study a CO2-challenge was applied to test the effect of amyloid deposition in HCHWA-D, a hereditary form of cerebral amyloid angiopathy (CAA), on the cerebrovascular reactivity (CVR). With dual echo arterial spin labeling, providing cerebral blood flow (CBF) and BOLD images, the CVR was measured in grey and white matter and the CO2-challenge was evaluated as a whole brain biomarker. The effect of the CO2-challenge was best measured with CBF in the grey matter. Future research should prove whether it is sensitive enough to detect treatment induced changes in (pre-)symptomatic CAA patients.
Introduction
In cerebral amyloid angiopathy (CAA) the toxic protein amyloid accumulates in the arterial and arteriolar vessel walls in the brain and is accompanied by degeneration of medial smooth muscle cells1. Sporadic CAA has a high prevalence in the general elderly population with a prevalence of 80% in the oldest elderly and in patients with Alzheimer’s Disease (AD)2. Provocation of neuronal activation by a visual task has been proposed to detect microvascular impairment in CAA. However, per definition, the effect of a visual stimulus is limited to the visual cortex. Alternatively, a CO2-challenge can be used to probe the functioning of the (micro)vascular bed with the advantage of covering the entire brain.
Hereditary cerebral hemorrhage with amyloidosis, Dutch-type (HCHWA-D), is an autosomal dominant type of CAA causing lobar hemorrhages and hemorrhagic infarcts at an early age of approximately 503,4. HCHWA-D is considered to be a useful model to study sporadic CAA, since it allows for studying pure CAA independent of other age-related pathology and DNA-analysis can prove the presence of the condition, allowing early (pre-symptomatic) stages of the disease. Previously, it has been shown that the BOLD-response upon visual activation is already impaired in the pre-symptomatic HCHWA-D patient7.
The aim of this study was to assess cerebrovascular reactivity in HCHWA-D patients using a CO2-challenge as a whole brain biomarker.
Methods
Eleven HCHWA-D patients with a genetic-based diagnosis of the presence of the amyloid precursor protein codon 693-mutation and one or more clinically and radiologically confirmed intracerebral hemorrhage(s), as well as eleven age and gender-matched healthy controls (Table 1), were scanned on a 3T Philips Achieva scanner using a 32-channel head-coil. This study was approved by the local Institutional research board, and participants provided written informed consent prior to inclusion.
Dual-echo pseudo-continuous arterial spin labeling (DE-ASL) scans were acquired with 17 slices at a 2.75x2.75x7mm3 resolution (multi-slice single-shot two-dimensional EPI read-out), see figure 1A. ASL images acquired at the first echo time (9.2ms) are perfusion (cerebral blood flow, CBF) weighted, whereas the second echo time (30ms) is primarily T2*-weighted, thus sensitive to the BOLD signal6. A block-design CO2-inhalation paradigm (2 minutes alternating normocapnia/hypercapnia by inhalation of 5% CO2, 21% O2 and 74% N2 delivered through a non-rebreathing face mask, 10 minutes in total), applied with custom build gas-mixer was employed to target the (micro)vascular bed function over the whole brain, see figure 1B.
A 3D-anatomical (1mm isotropic) and M0-scan were acquired for post-processing and CBF-quantification7. DE-ASL images were motion corrected and registered to an MNI-standard brain in FSL. Grey and white matter masks were segmented from the T1-weighted images using FAST. End-tidal CO2 (etCO2) was recorded to correct for delays. Cerebrovascular reactivity (CVR) was calculated as: $$\text{CVR = }100\text{%}\times\frac{\text{hypercapnic MR signal}-\text{baseline MR signal}}{\text{baseline MR signal}\times\left(\text{hypercapnic etCO}_{2}-\text{baseline etCO}_{2}\right)}$$
Results
A significant lower hypercapnic CBF (p<0.05, unpaired t-test) was found in the HCHWA-D compared to the control group, while at baseline p=0.055, see figure 2 and 3. The lowest p-value (=0.077) of the CVR was in the GM CBF between HCHWA-D and control subjects. The effect of the CO2-challenge was significantly larger in WM BOLD in the patient than the control group. A negative CVR was even observed in the frontal region of the controls subjects, as seen in figure 4. All other CVR-values showed no significant difference between the groups.Discussion
The 5% CO2-challenge was well tolerated by the subjects and the effect on the whole brain GM was best measured with CBF. The negative CVR in the WM of the control group could be explained by a steal effect, due to lower resistance in GM during CO2-stimulation, while this GM resistance change might be smaller in patients. A study limitation was that it was performed in a small, heterogeneous group of symptomatic subjects.Therefore, the statistical power of this study was limited and a larger study cohort should be used to further study the effect of the amyloid deposition on the cerebrovascular reactivity.Conclusion
Since several therapeutic strategies for CAA are becoming available, the search for a sensitive biomarker to detect CAA in vivo has become essential. Whereas the BOLD-response to a visual stimulus has proved to be a good candidate, it is limited to the posterior brain and, therefore, probably a less favourable marker for more advanced disease stages in which this region is already significantly affected. A CO2-challenge is a good whole brain alternative and future research should prove whether it is sensitive enough to detect treatment induced changes in a small group of pre-symptomatic and/or symptomatic patients as part of a clinical trial.Acknowledgements
This study was part of the CAVIA project (nr. 733050202), which has been made possible by ZonMW. The CAVIA project is part of ‘Memorabel’, the research and innovation programme for dementia, as part of the Dutch national ‘Deltaplan for Dementia’. The CAVIA project is a consortium of Radboudumc, LUMC, Erasmus MC, VUmc, ADX Neurosciences, Philips Healthcare, Stony Brook University and Massachusetts General Hospital.
References
- Vinters HV, Natté R, Maat-Schieman MLC, van Duinen SG, Hegeman-Kleinn I, Welling-Graafland C, et al. Secondary microvascular degeneration in amyloid angiopathy of patients with hereditary cerebral hemorrhage with amyloidosis, Dutch type (HCHWA-D). Acta Neuropathol. 1998 1998/02/01;95(3):235-244.
- Coria F, Prelli F, Castano EM, Larrondo-Lillo M, Fernandez-Gonzalez J, van Duinen SG, et al. Beta-protein deposition: a pathogenetic link between Alzheimer's disease and cerebral amyloid angiopathies. Brain Res. 1988 Oct 25;463(1):187-91.
- Luyendijk W, Bots GT, Vegter-van der Vlis M, Went LN, Frangione B. Hereditary cerebral haemorrhage caused by cortical amyloid angiopathy. Journal of the neurological sciences. 1988 Jul;85(3):267-80.
- Wattendorff AR, Bots GT, Went LN, Endtz LJ. Familial cerebral amyloid angiopathy presenting as recurrent cerebral haemorrhage. Journal of the neurological sciences. 1982 Aug;55(2):121-35.
- Van Opstal AM, Van Rooden A, Van Harten T, Ghariq E, Labadie E, Fotiadis P, et al. Cerebrovascular function in presymptomatic and symptomatic individuals with hereditary cerebral amyloid angiopathy: a case-control study. The Lancet Neurology 2017; 16: 115–22
- Woolrich MW, Chiarelli P , Gallichan D, Perthen J, Liu TT, Bayesian inference of hemodynamic changes in functional arterial spin labeling data, Magnetic resonance in Medicine 2006; 56(4): 891-906.
- Alsop DC, Detre JA, Golay X, Günther M, Hendrikse J, Hernandez-Garcia L, et al. Recommended implementation of arterial spin-labeled perfusion MRI for clinical applications: A consensus of the ISMRM perfusion study group and the European consortium for ASL in dementia., Magnetic resonance in Medicine. 2015; 73(1): 102–116.
Figures
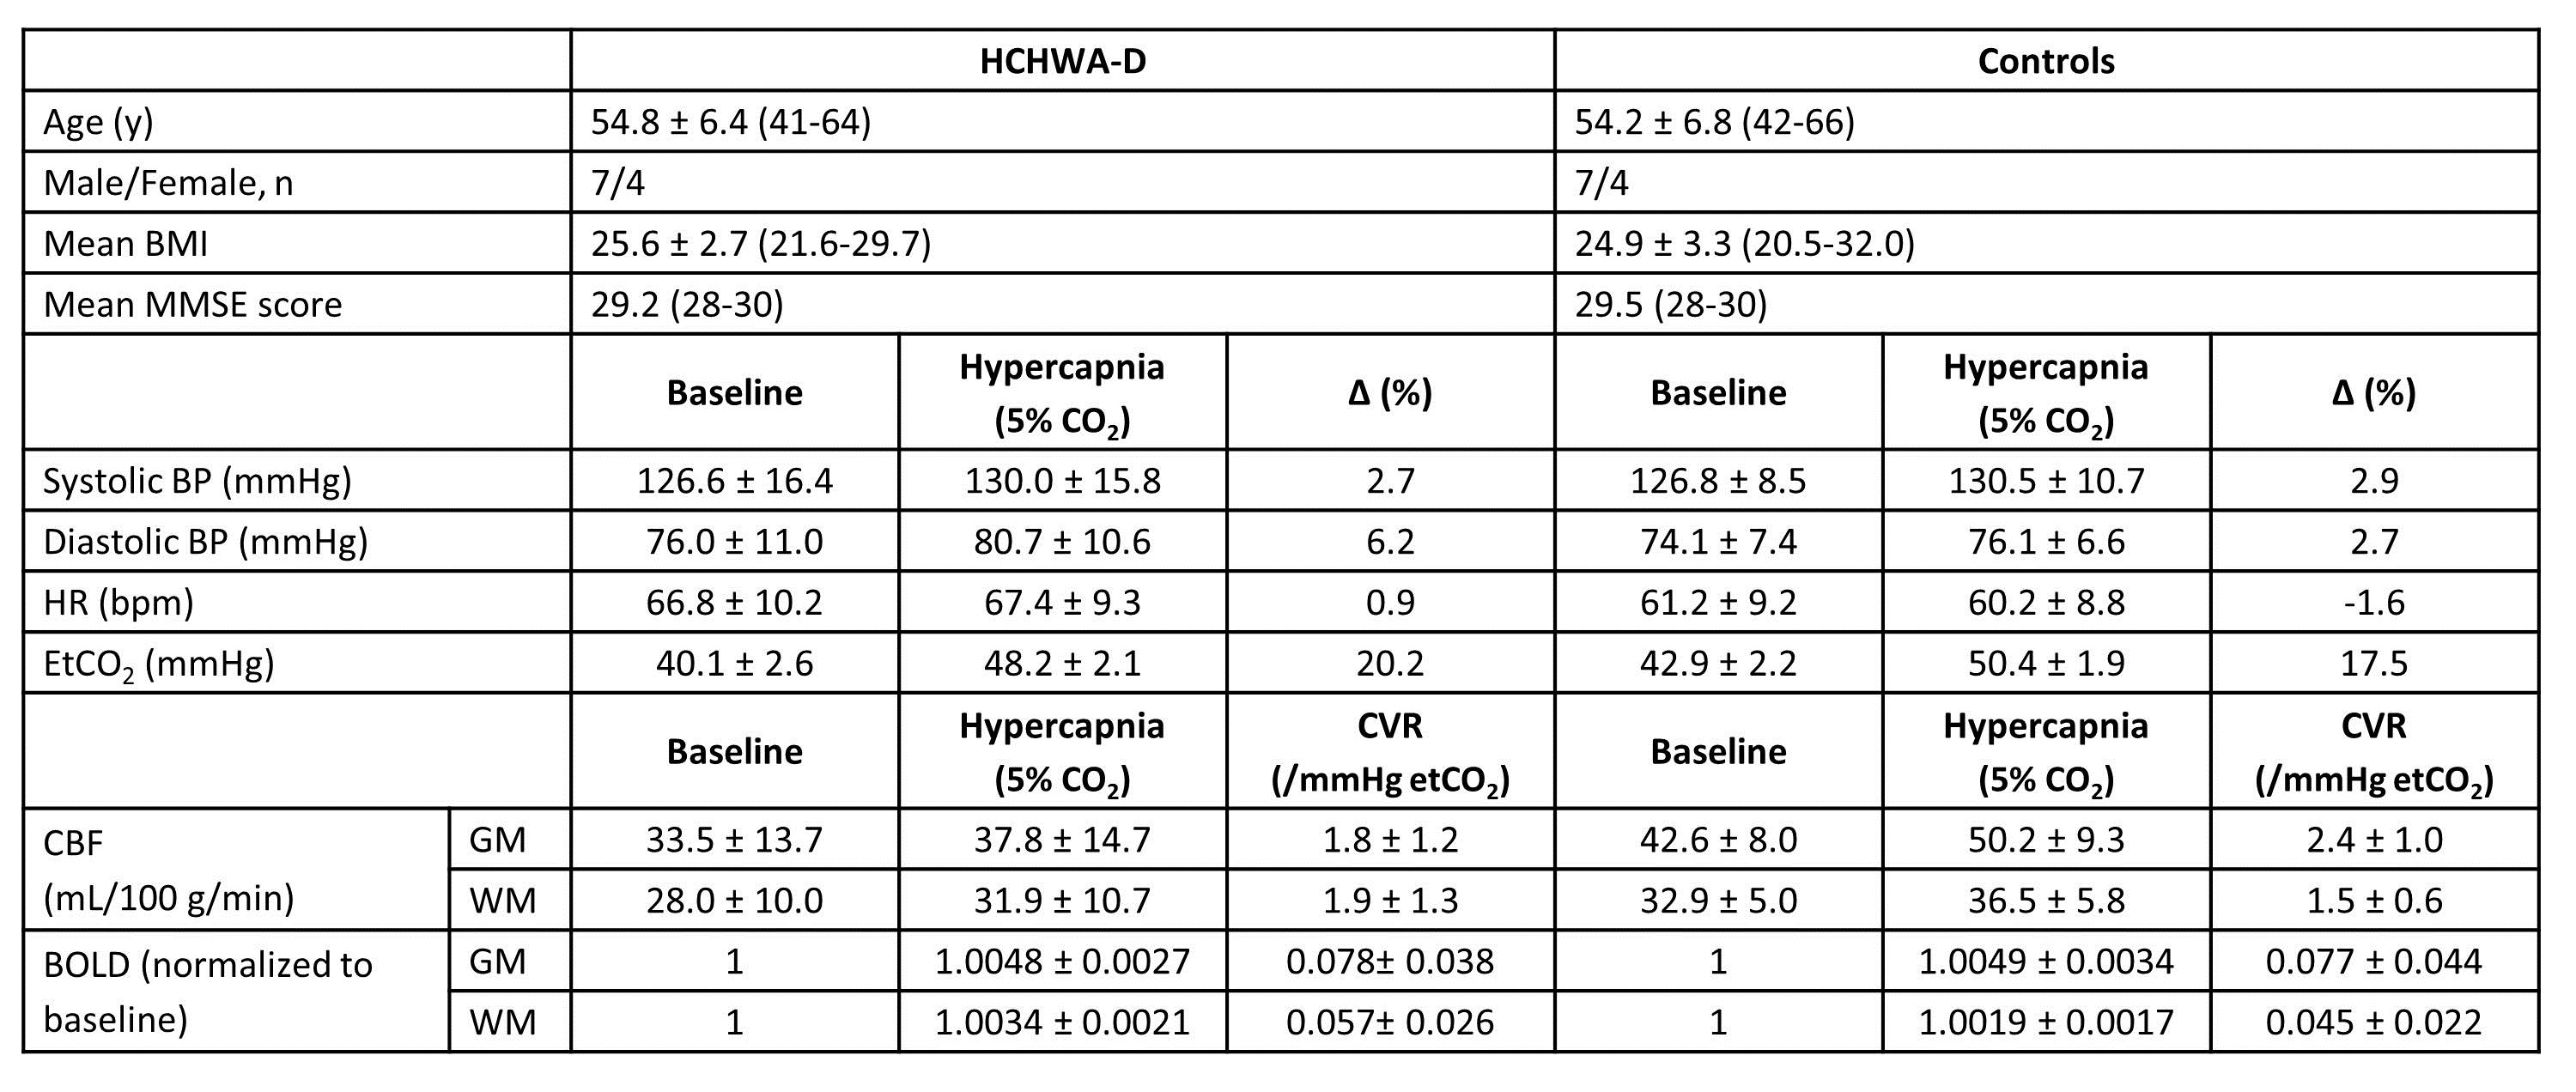

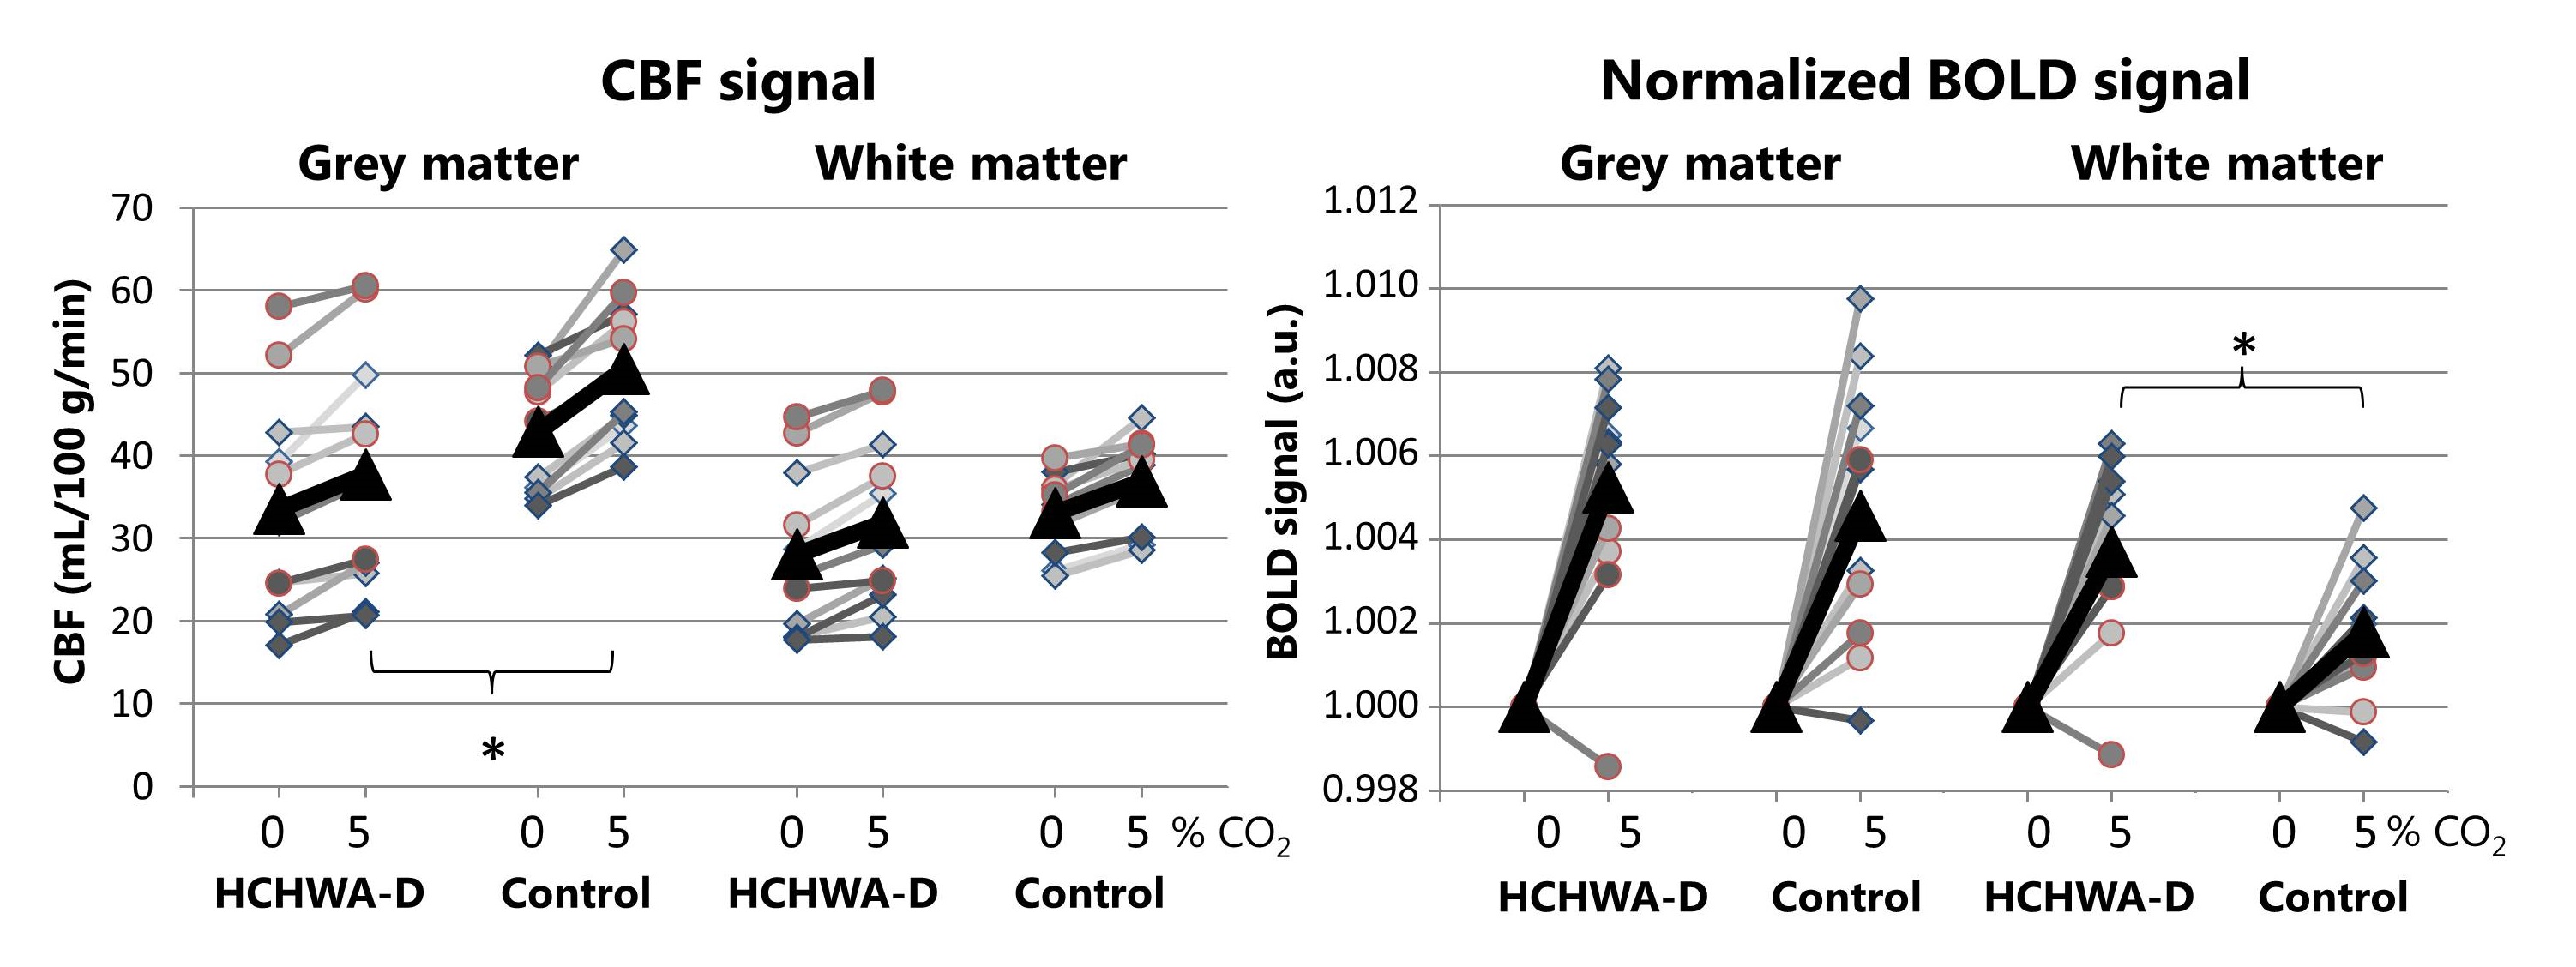
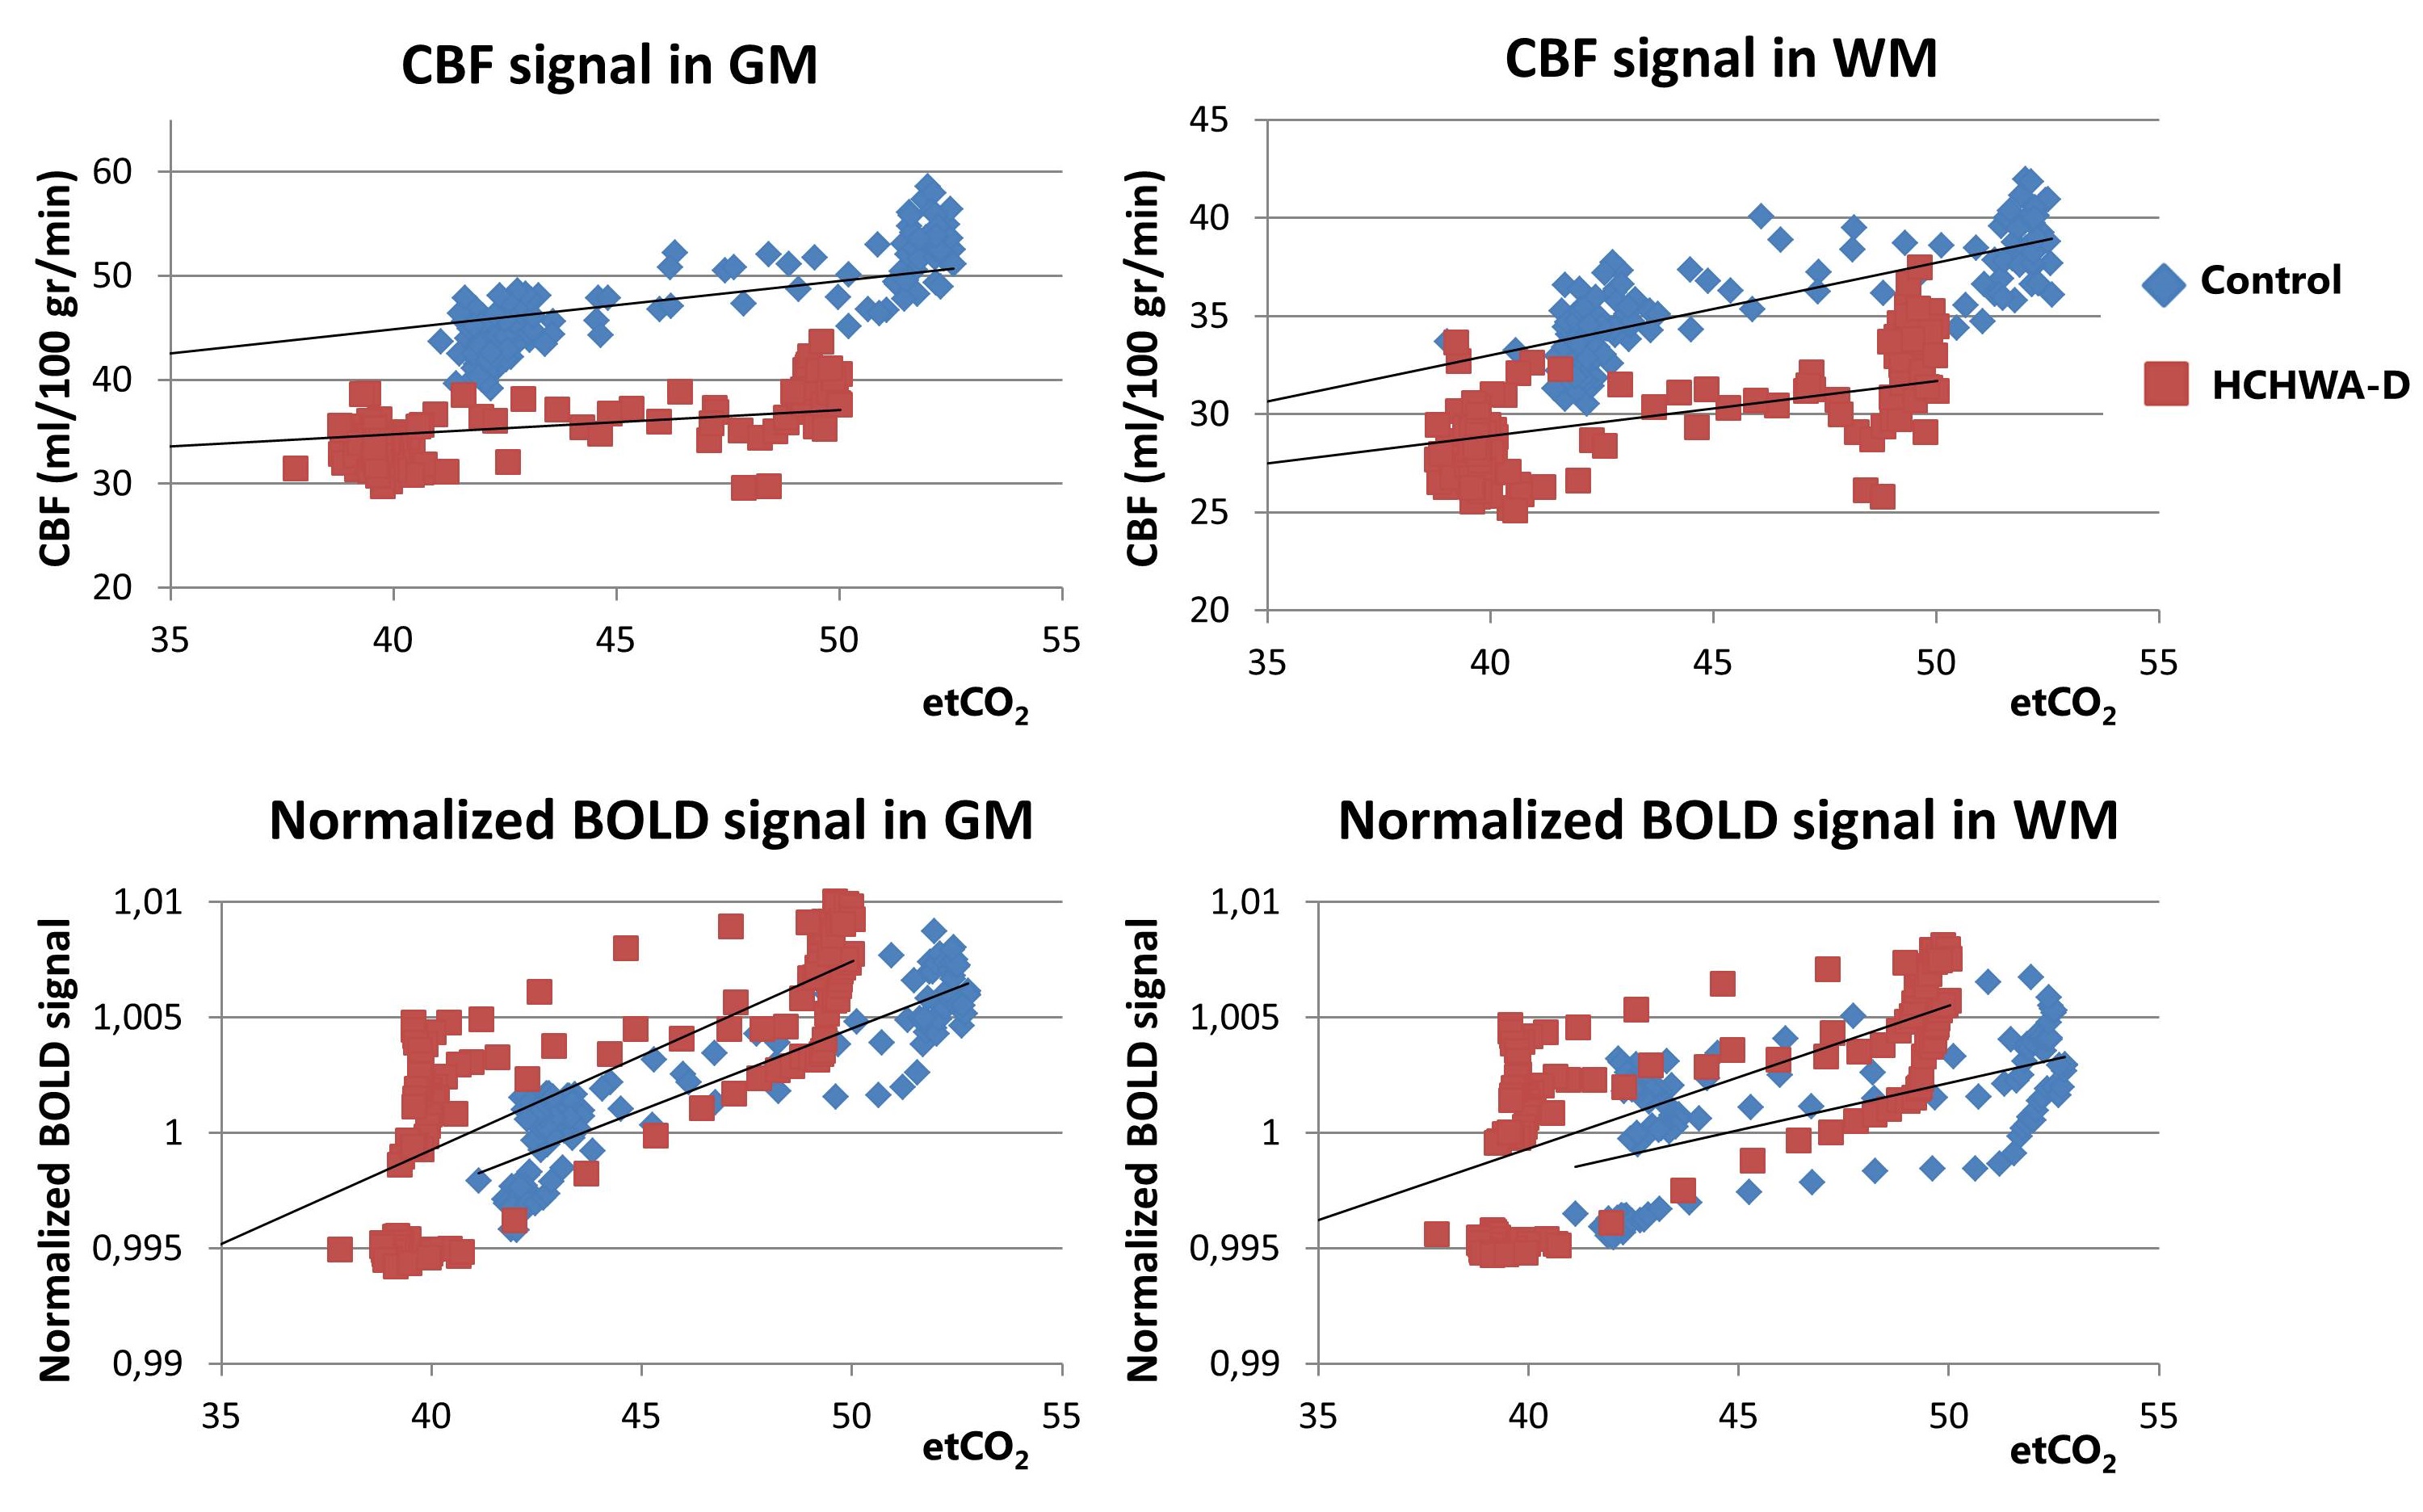
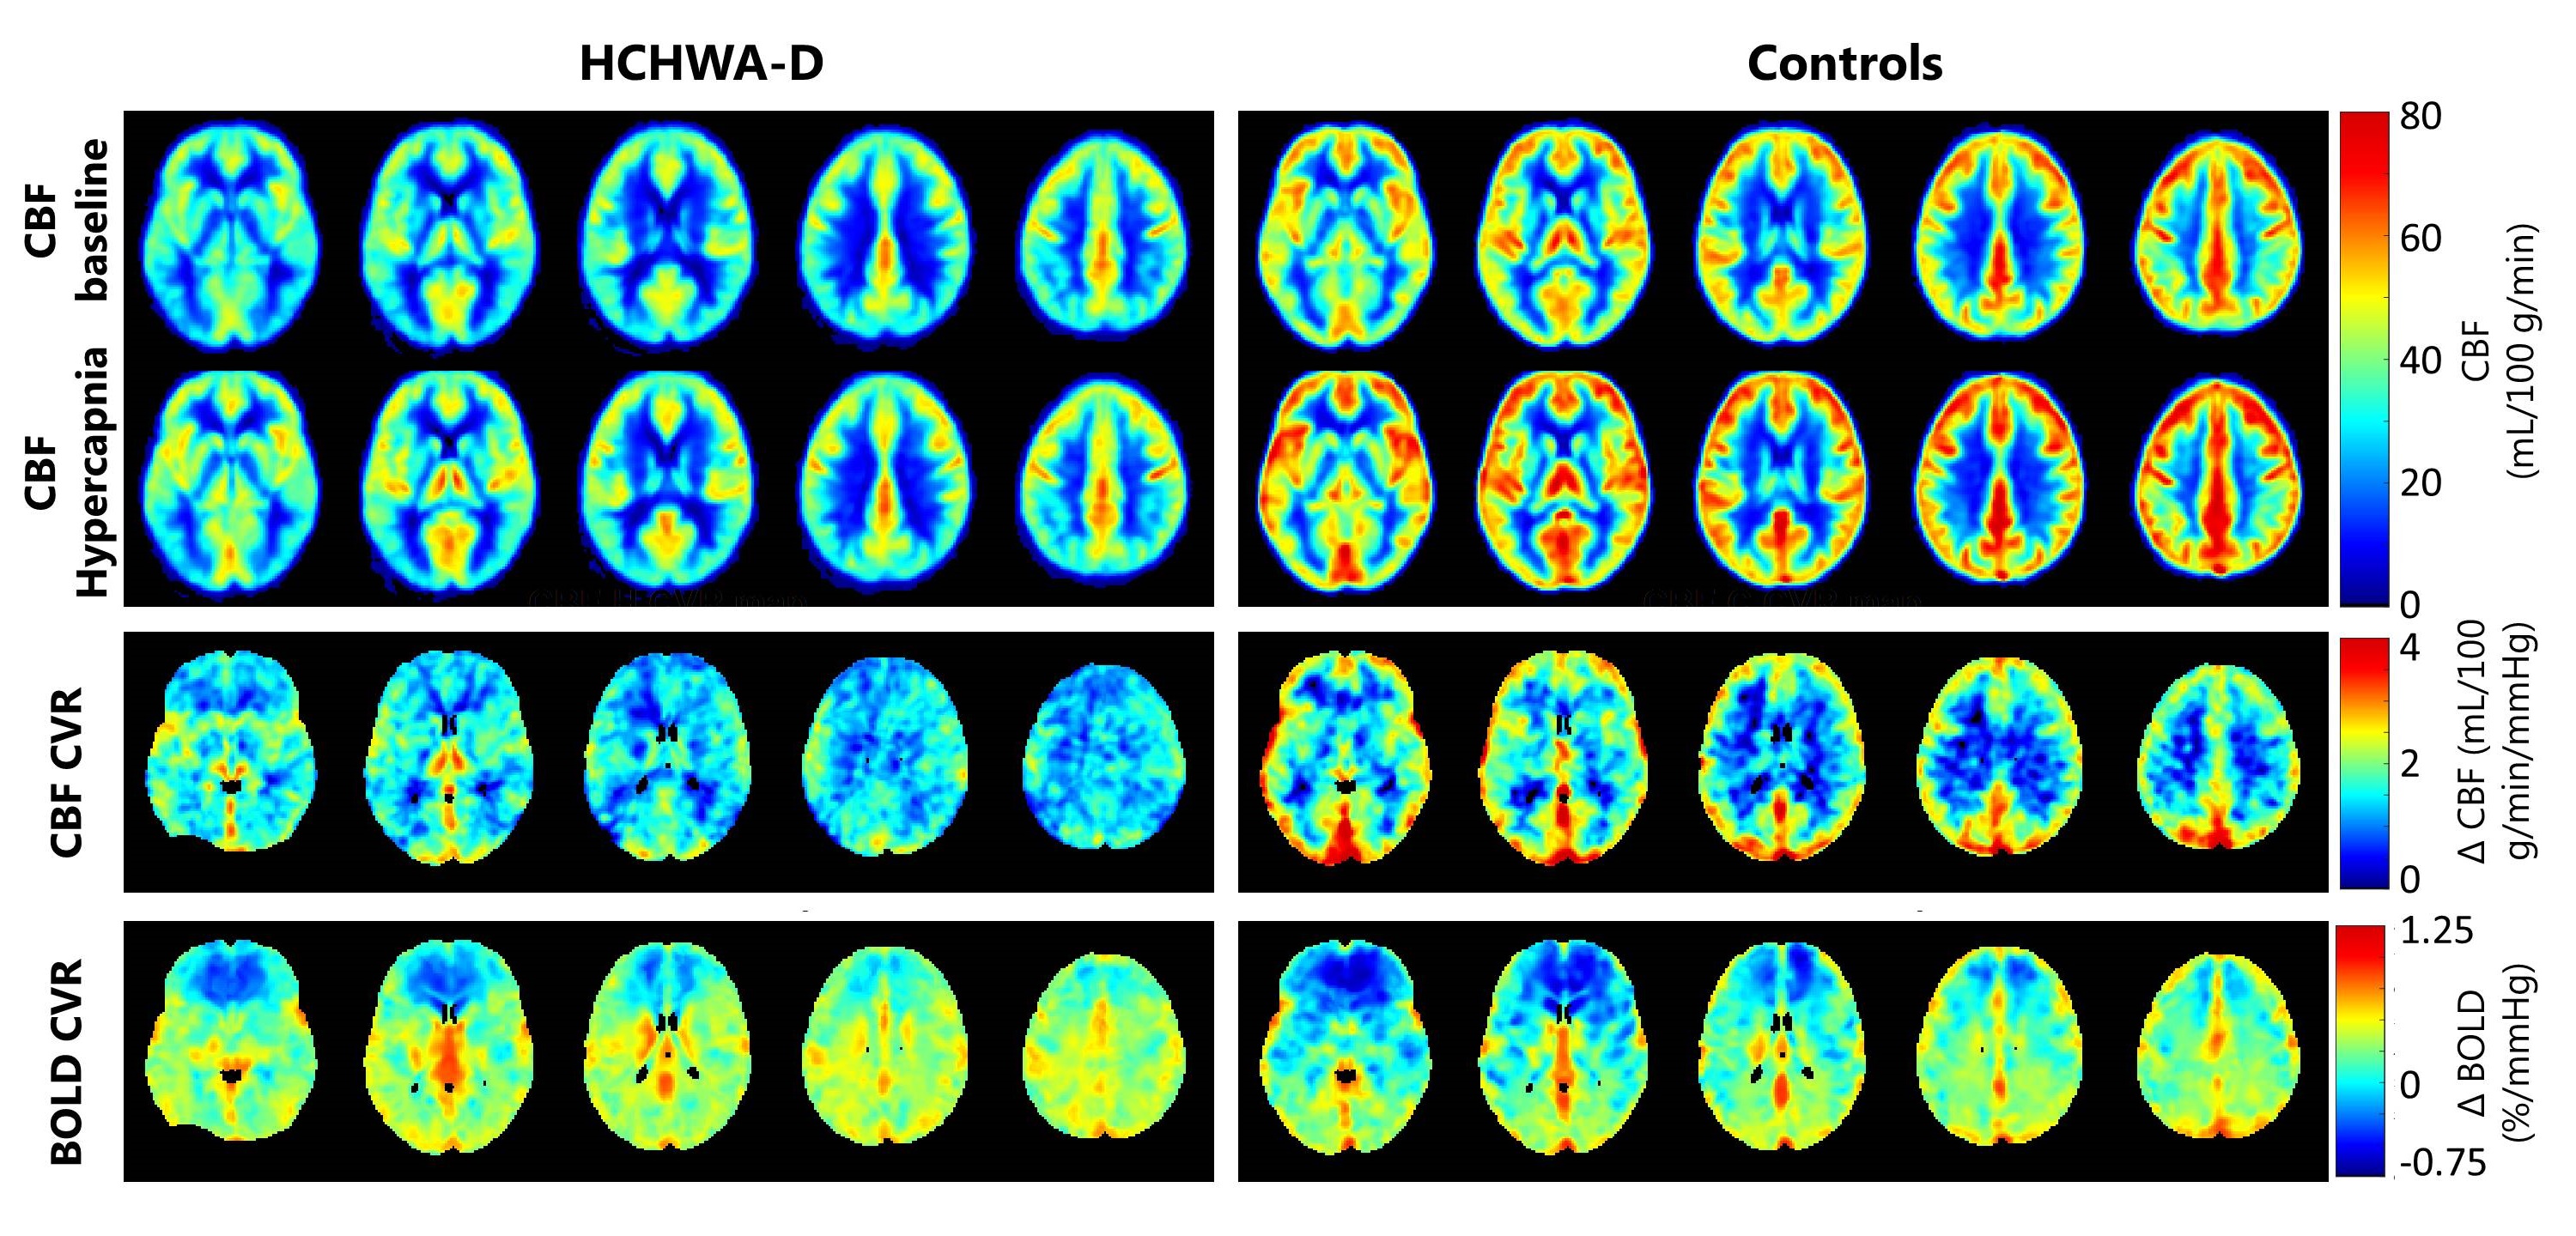
Figure 4. Group average CBF-maps at baseline and during hypercapnia (top), CBF CVR-maps (middle) and BOLD CVR-maps (bottom) as signal change per mmHg etCO2 for HCHWA-D (left) and controls (right). On average the CBF is lower in the patient group. The average grey matter CBF CVR showed a trend towards being significantly higher in the control group compared to HCHWA-D. White matter BOLD CVR is higher in the HCHWA-D subjects.