0976
Impaired oxygen metabolism in the brain during visual stimulation in premanifest Huntington's Disease patients detected by 3D-TRIP MRI at 7T1Department of Electrical and Computer Engineering, Johns Hopkins University, Baltimore, MD, United States, 2F.M. Kirby Research Center for Functional Brain Imaging, Kennedy Krieger Institute, Baltimore, MD, United States, 3Division of MRI Research, Department of Radiology, Johns Hopkins University School of Medicine, Baltimore, MD, United States, 4Department of Neurology, Johns Hopkins University School of Medicine, Baltimore, MD, United States, 5Department of Psychiatry and Behavioral Sciences, Johns Hopkins University School of Medicine, Baltimore, MD, United States, 6Department of Neuroscience and Pharmacology, Johns Hopkins University School of Medicine, Baltimore, MD, United States
Synopsis
Huntington’s disease (HD) is a neurodegenerative disease caused by a single genetic mutation. Neurovascular abnormalities have been implicated in the pathophysiology of HD. Here, dynamic responses in BOLD, cerebral-blood-flow (CBF) and -volume (CBV) during visual stimulation were measured using 3D-TRiple-acquisition-after-Inversion-Preparation (3D-TRIP) MRI in premanifest HD patients and healthy controls, from which cerebral-metabolic-rate-of-oxygen (CMRO2) response was estimated. Decreased ΔCMRO2 and increased ΔCBV were observed in HD patients compared to controls, which correlated with genetic measures. The results suggested potential value of ΔCMRO2 as a biomarker for HD, and may shed light on the pathophysiology in HD in terms of mitochondrial deficiency.
Introduction
Huntington’s disease (HD) is a neurodegenerative disease caused by a CAG expansion in the Huntingtin gene1. The progression of HD can be separated into premanifest and manifest periods, where the approximate year-to-onset (YTO) of motor symptoms can be predicted from the length of CAG repeats2. Progressive atrophy of striatum is an imaging hallmark for HD3-7. However, ample evidence indicates existence of brain abnormalities in HD not reflected in brain structural changes (atrophy). Such abnormalities include perturbations in brain microvasculature8-15 and brain metabolic disturbances16-21. Previously, we have shown significantly altered baseline cerebral perfusion indicated by increased arteriolar-cerebral-blood-volume (CBVa) in the brain of prodromal HD patients22. Here, in addition to baseline microvascular changes, we examine potential abnormalities in dynamic responses in microvascular and metabolic parameters during functional stimulation in premanifest HD patients. The recently developed 3D-TRiple-acquisition-after-Inversion-Preparation (3D-TRIP) MRI allows the measurement of signal responses in BOLD, cerebral-blood-flow (CBF) and -volume (CBV) during functional stimulation in one single scan23, from which the cerebral-metabolic-rate-of-oxygen (CMRO2) response can be estimated24.Methods
23 HD patients (15 premanifest, 8 early manifest), and 16 healthy controls matched in age and sex were studied. fMRI experiments were performed on a 7T Philips scanner using 3D-TRIP MRI (TR/TI1/TI2/TI3/FA=4.0s/0.6s/1.5s/2.4s/7º, voxel=3.5mm isotropic) during a flashing checker-board paradigm (4 blocks of alternating 20s flashing and 40s rest periods). Data analysis was performed using a pipeline implemented for 3D-TRIP MRI23. Only voxels that met activation detection criteria in all three modalities in the visual cortex were used to calculate signal changes in the analysis. The activation detection threshold was identical in all three modalities (adjusted P<0.05), and signal-to-noise ratio (SNR) thresholds established in previous studies were used to exclude voxels with low SNR23,25. Group comparisons were performed with two-tailed T-tests. Correlations between dynamic responses in BOLD, CBF, CBV, and CMRO2, and YTO were calculated using multiple regression. Age, sex, and brain atrophy were all accounted for as covariates. Multiple comparisons were corrected with the false-discovery rate (adjusted P<0.05).Results
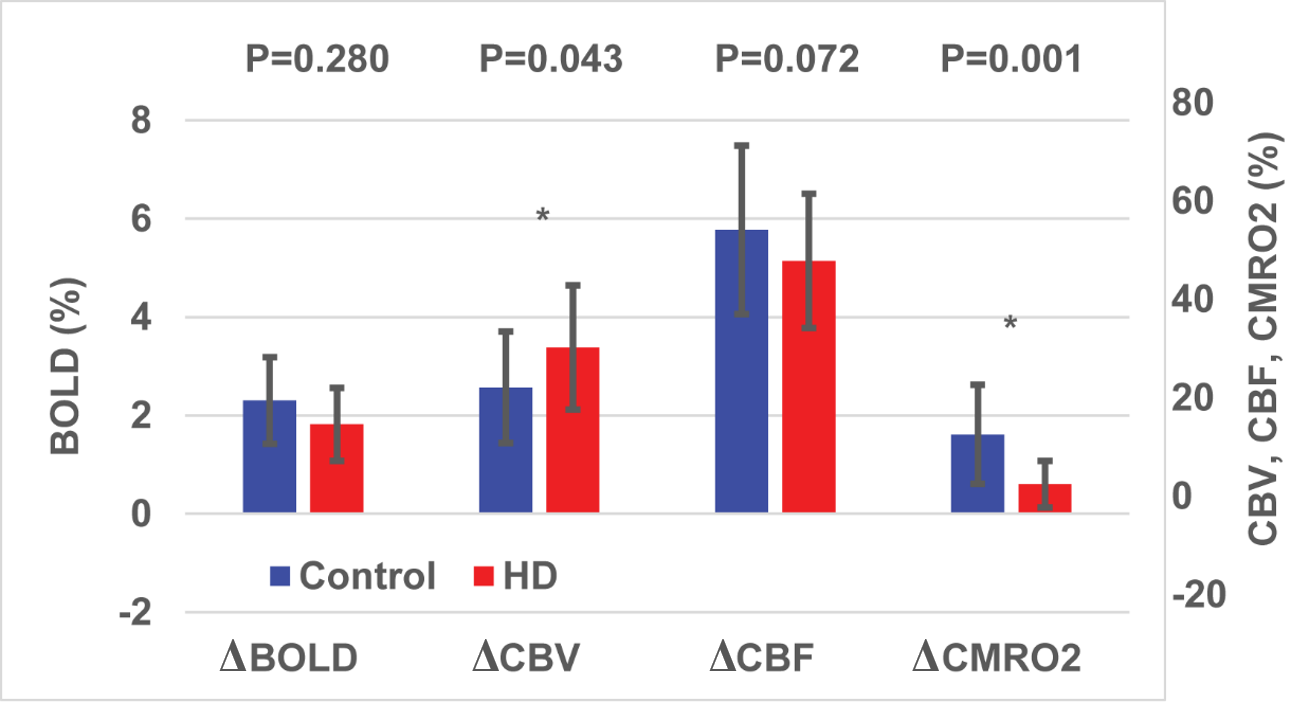
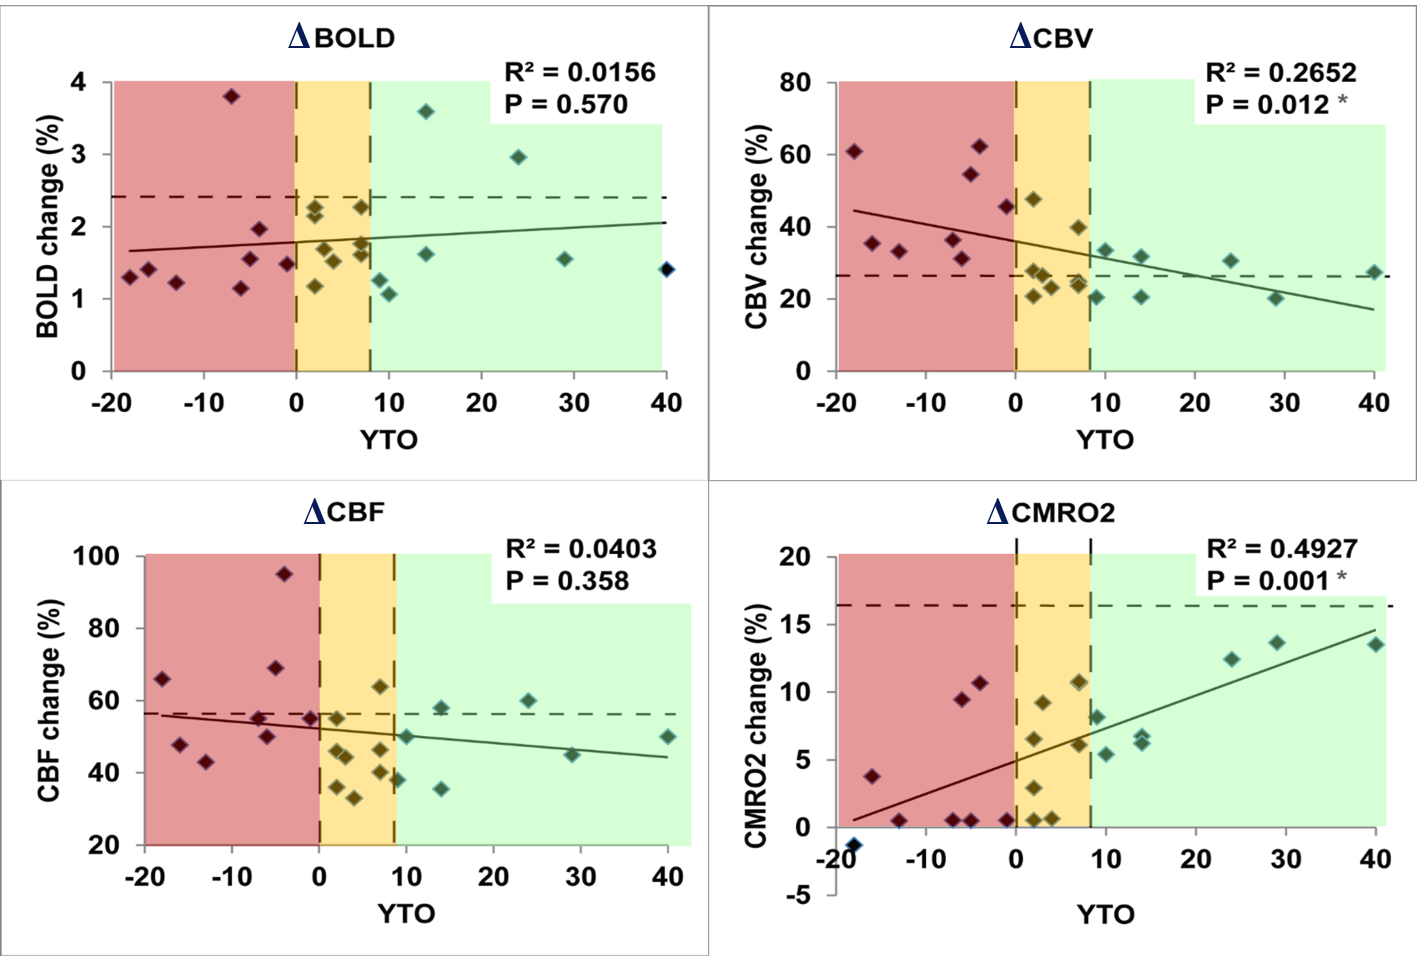
As shown in Fig. 1, trends (but not significant) of reduced responses in BOLD (ΔBOLD) and CBF (ΔCBF) during visual stimulation were observed in HD patients compared to controls, in congruence with some previous reports8-15. Meanwhile, CBV response (ΔCBV) significantly increased in HD patients, leading to the deduction of a significantly reduced CMRO2 response (ΔCMRO2) in HD patients. Note that all signal responses in the control group were in normal range23-25. Significant correlations (Fig. 2) were detected between YTO and ΔCBV (negative correlation) and ΔCMRO2 (positive correlation), but not between YTO and ΔBOLD and ΔCBF in HD patients. Note that all HD patients showed lower ΔCMRO2 than the average value from the control group, including the three patients with YTO>20yr (Fig. 2). Some of the patients showed completely abolished CMRO2 response during the visual stimulation (Fig. 2). To make sure that the subjects are awake during the flashing checker-board presentation, they were asked to press a button at the start and end of each flashing period.Discussion and Conclusion
The impaired CMRO2 response during visual stimulation in HD patients can most likely be linked to the well-known mitochondrial deficiency in HD pathology16-21. It seems to be consistent with some prior literature. For instance, Mochel et al. showed unchanged Pi/PCr and Pi/ATP ratios during and after visual stimulation in early manifest HD patients using 31P MRS26. Our data also imply that metabolic deficits (ΔCMRO2) seem to occur earlier and present greater effect sizes than microvascular abnormalities (ΔCBV). Interestingly, ΔCBV increased here in HD patients, despite an elevated baseline CBVa shown previously22. This is somewhat surprising as a larger baseline value usually results in a smaller response during stimulation. One possible explanation is that the larger ΔCBV response may primarily originate from the venous vessels, whereas the baseline abnormality mainly occurs in the arteriolar compartment (CBVa). We chose to use visual stimulation here as a simple and robust paradigm to test our methodology. Nevertheless, the visual cortex is usually considered relatively spared in the early stages of HD. The fact that we can detect significant abnormality in the visual cortex in premanifest HD patients suggests that such effects may be more prominent in other brain regions more affected in HD. We believe that these preliminary results merit further investigation in a larger cohort and with a longitudinal design.Acknowledgements
Funding through the Huntington’s Society of America (HDSA) and the Dana Foundation, NIBIB P41 EB015909.
References
- Group, T.H.s.D.C.R. A novel gene containing a trinucleotide repeat that is expanded and unstable on Huntington's disease chromosomes. Cell 72, 971-983 (1993).
- Langbehn, D.R., Brinkman, R.R., Falush, D., Paulsen, J.S. & Hayden, M.R. A new model for prediction of the age of onset and penetrance for Huntington's disease based on CAG length. Clin Genet 65, 267-277 (2004).
- Aylward, E.H., et al. Longitudinal change in regional brain volumes in prodromal Huntington disease. J Neurol Neurosurg Psychiatry 82, 405-410 (2011).
- Tabrizi, S.J., et al. Biological and clinical manifestations of Huntington's disease in the longitudinal TRACK-HD study: cross-sectional analysis of baseline data. Lancet Neurol 8, 791-801 (2009).
- Tabrizi, S.J., et al. Biological and clinical changes in premanifest and early stage Huntington's disease in the TRACK-HD study: the 12-month longitudinal analysis. Lancet Neurol 10, 31-42 (2011).
- Tabrizi, S.J., et al. Potential endpoints for clinical trials in premanifest and early Huntington's disease in the TRACK-HD study: analysis of 24 month observational data. Lancet Neurol 11, 42-53 (2012).
- Paulsen, J.S., et al. Striatal and white matter predictors of estimated diagnosis for Huntington disease. Brain Res Bull 82, 201-207 (2010).
- Chen, J.J., Salat, D.H. & Rosas, H.D. Complex relationships between cerebral blood flow and brain atrophy in early Huntington's disease. Neuroimage (2011).
- Deckel, A.W., Weiner, R., Szigeti, D., Clark, V. & Vento, J. Altered patterns of regional cerebral blood flow in patients with Huntington's disease: a SPECT study during rest and cognitive or motor activation. J Nucl Med 41, 773-780 (2000).
- Harris, G.J., et al. Reduced basal ganglia blood flow and volume in pre-symptomatic, gene-tested persons at-risk for Huntington's disease. Brain 122 ( Pt 9), 1667-1678 (1999).
- Hasselbalch, S.G., et al. Reduced regional cerebral blood flow in Huntington's disease studied by SPECT. J Neurol Neurosurg Psychiatry 55, 1018-1023 (1992).
- Ma, Y. & Eidelberg, D. Functional imaging of cerebral blood flow and glucose metabolism in Parkinson's disease and Huntington's disease. Mol Imaging Biol 9, 223-233 (2007).
- Wolf, R.C., et al. Magnetic resonance perfusion imaging of resting-state cerebral blood flow in preclinical Huntington's disease. J Cereb Blood Flow Metab 31, 1908-1918 (2011).
- Deckel, A.W., Cohen, D. & Duckrow, R. Cerebral blood flow velocity decreases during cognitive stimulation in Huntington's disease. Neurology 51, 1576-1583 (1998).
- Deckel, A.W. & Duffy, J.D. Vasomotor hyporeactivity in the anterior cerebral artery during motor activation in Huntington's disease patients. Brain Res 872, 258-261 (2000).
- Browne, S.E. Mitochondria and Huntington's disease pathogenesis: insight from genetic and chemical models. Ann N Y Acad Sci 1147, 358-382 (2008).
- Su, B., et al. Abnormal mitochondrial dynamics and neurodegenerative diseases. Biochim Biophys Acta 1802, 135-142 (2010).
- Quintanilla, R.A. & Johnson, G.V. Role of mitochondrial dysfunction in the pathogenesis of Huntington's disease. Brain Res Bull 80, 242-247 (2009).
- Li, X.J., Orr, A.L. & Li, S. Impaired mitochondrial trafficking in Huntington's disease. Biochim Biophys Acta 1802, 62-65 (2010).
- Reddy, P.H. & Shirendeb, U.P. Mutant huntingtin, abnormal mitochondrial dynamics, defective axonal transport of mitochondria, and selective synaptic degeneration in Huntington's disease. Biochim Biophys Acta 1822, 101-110 (2012).
- Mochel, F. & Haller, R.G. Energy deficit in Huntington disease: why it matters. J Clin Invest 121, 493-499 (2011).
- Hua, J., Unschuld, P.G., Margolis, R.L., van Zijl, P.C. & Ross, C.A. Elevated arteriolar cerebral blood volume in prodromal Huntington's disease. Mov Disord 29, 396-401 (2014).
- Cheng, Y., Qin, Q., van Zijl, P.C., Pekar, J.J. & Hua, J. A three-dimensional single-scan approach for the measurement of changes in cerebral blood volume, blood flow, and blood oxygenation-weighted signals during functional stimulation. Neuroimage 147, 976-984 (2017).
- Lu, H., Golay, X., Pekar, J.J. & Van Zijl, P.C. Sustained poststimulus elevation in cerebral oxygen utilization after vascular recovery. J Cereb Blood Flow Metab 24, 764 (2004).
- Hua, J., Stevens, R.D., Huang, A.J., Pekar, J.J. & van Zijl, P.C. Physiological origin for the BOLD poststimulus undershoot in human brain: vascular compliance versus oxygen metabolism. J Cereb Blood Flow Metab 31, 1599-1611 (2011).
- Mochel, F., et al. Abnormal response to cortical activation in early stages of Huntington disease. Mov Disord 27, 907-910 (2012).
- Niatsetskaya, Z., et al. HIF prolyl hydroxylase inhibitors prevent neuronal death induced by mitochondrial toxins: therapeutic implications for Huntington's disease and Alzheimer's disease. Antioxid Redox Signal 12, 435-443 (2010).
Figures