0974
Progressive Cortical Thinning in Specific Motor Regions in Different Clinical Stages of Patients with Amyotrophic Lateral Sclerosis1Department of Medical Imaging, The First Affiliated Hospital of Xi'an Jiaotong University, Xi'an, China
Synopsis
Staging system for ALS is important for clinical practice. Howerer, the validation of the mechanism that underneath the proposed stages in ALS remains unclear. We used surface-based cortical morphology and more precise anatomical evaluation for 72 patients at different stages and 88 controls, confirmed the consecutive involvement of cortical thinning in PrG along disease progression. Moreover, the extensive but similar PrG involvement in patients at stage 2 and stage 3, highlighted a critical therapeutic window from stage 1 to stage 2, and also underlined the incorporation of cortical evaluation as additional features to King’s clinical stages for promising clinical management.
INTRODUCTION
The King’s clinical staging system for amyotrophic lateral sclerosis (ALS) based on simple clinical milestones of the natural history provides an objective measure of disease progression with benefits for patient care, and has been suggested as helpful endpoints in clinical trials.1 However, the mechanism that underlying the proposed stages of ALS remains unclear, which hampered the clinical validity and use. A valid objective biomarker that correlated with disease pathology was desirable for monitoring treatment benefits in clinical trials of ALS. Recently, the cortical thinning of primary motor cortex has been served as reliable biomarker that reflected motor neuron degeneration in ALS.2 Therefore, in order to clarify the mechanisms of the King’s clinical staging system and provide direct evidence for its validity in clinical use, cortical thickness analyses were performed.METHODS
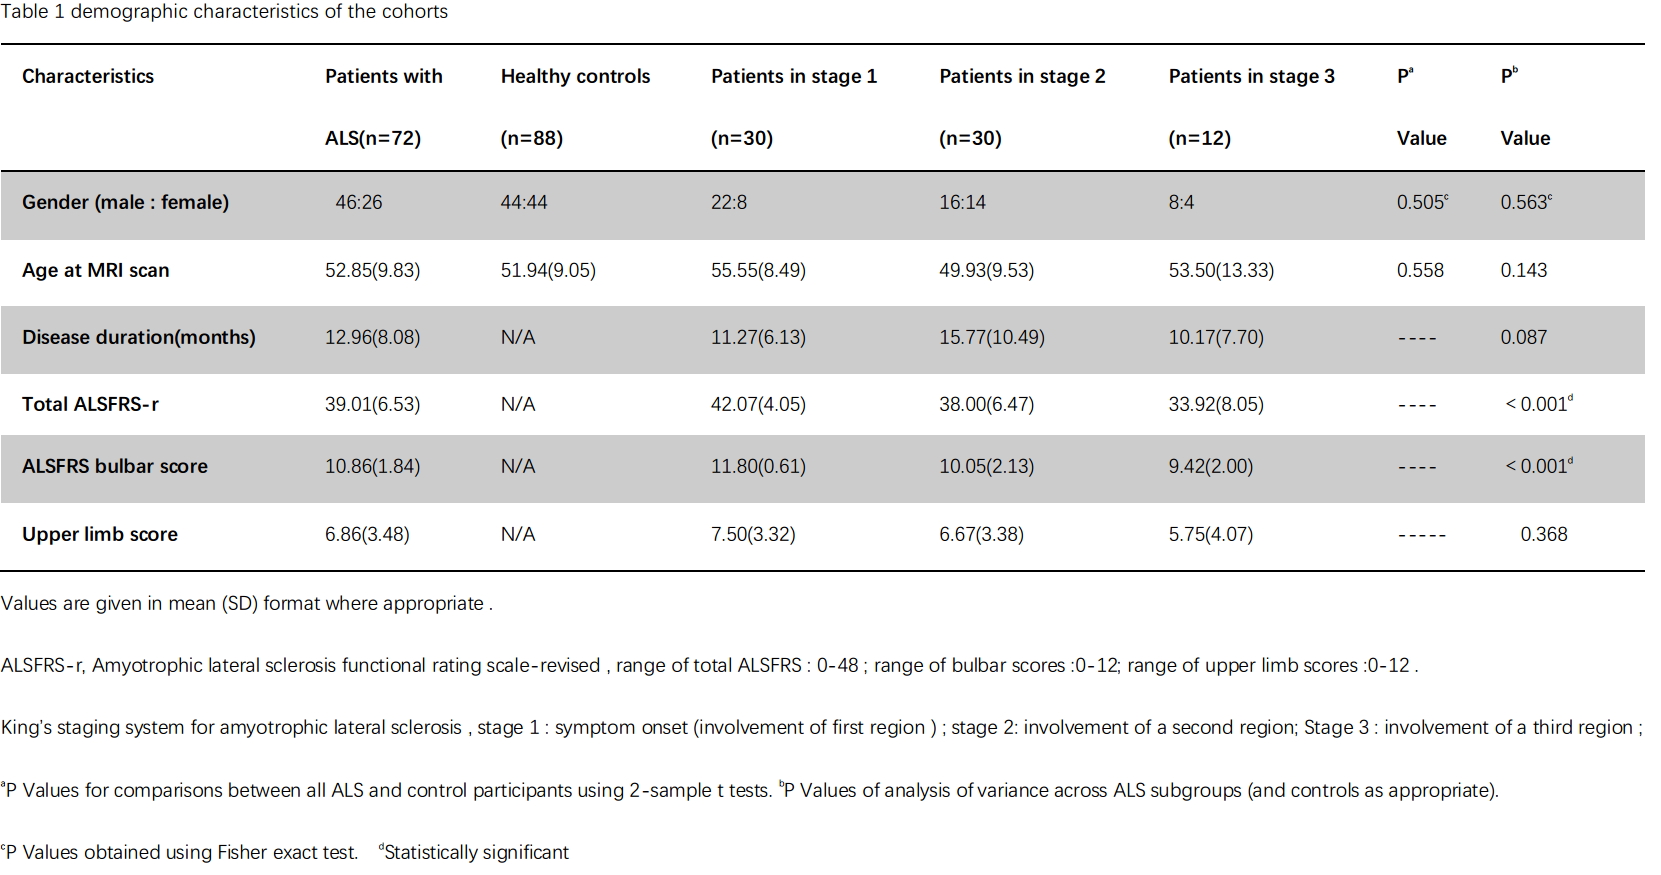
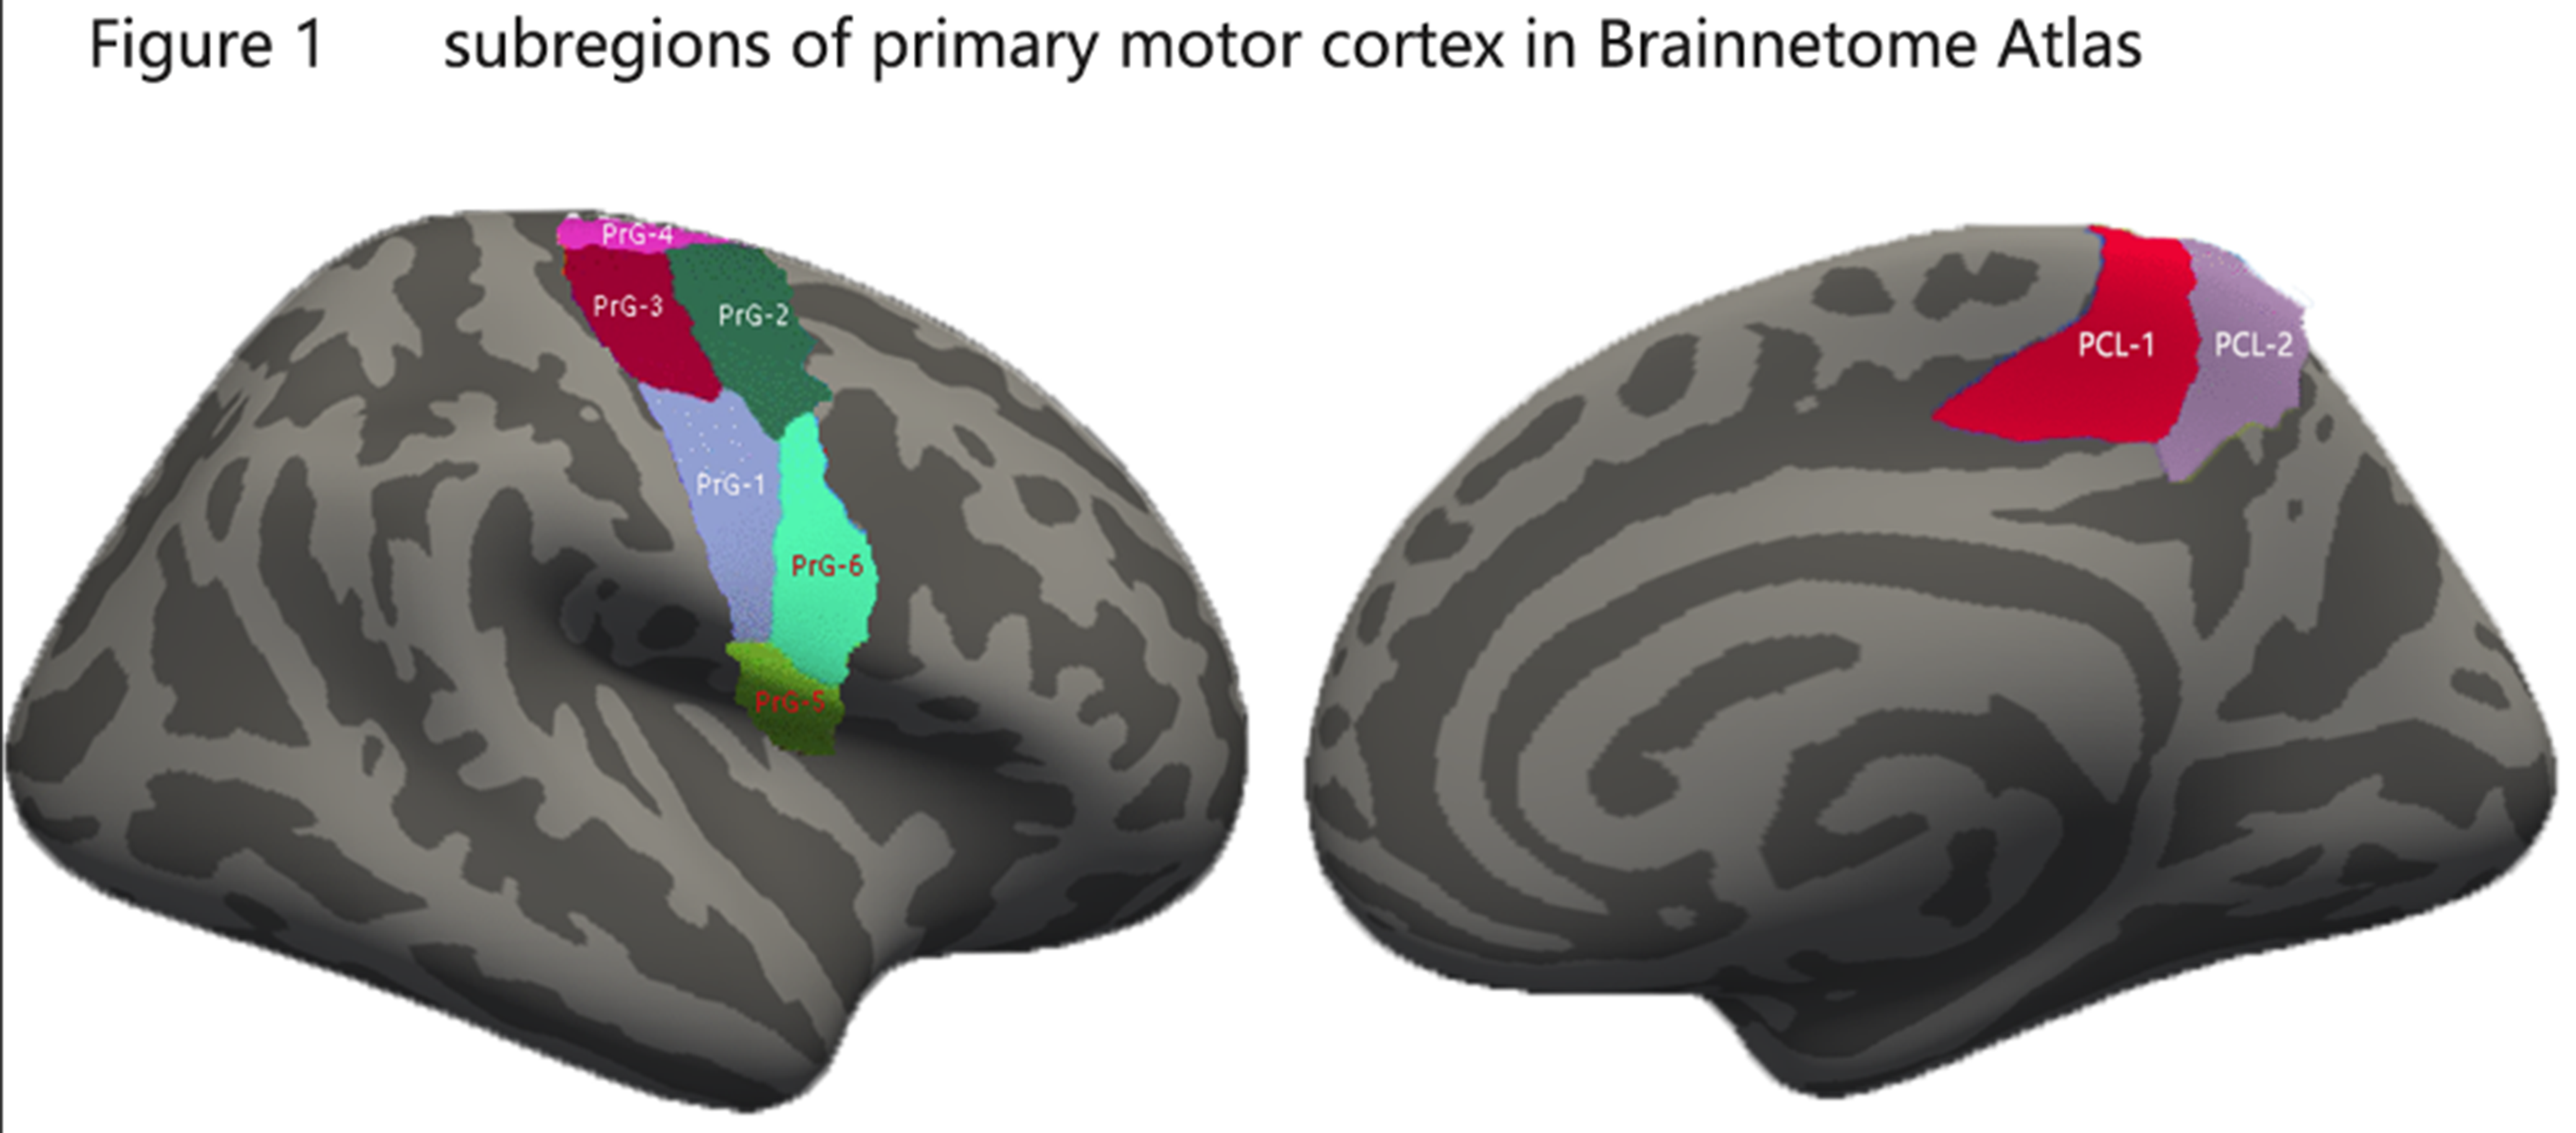
Seventy-two ALS patients with upper limb onset and 88 healthy controls were enrolled in this study. The exclusion of lower or bulbar onset ALS patients was aimed to reduce the heterogeneity of patients that may confound cortical changes, as suggested by Bede et al.3 Demographic and clinical characteristics are listed in table 1. T1-weighted images of the brain were acquired using a 3T scanner. Surface based cortical morphology measurements were performed using the FreeSurfer software. Based on previous observations,4 primary motor cortex was selected as region of interest. Besides, in order to evaluate more precise brain morphometric changes, we used the Brainnetome Atlas,5 in which primary motor cortex was segmented into 8 subregions according to different function of motor homunculus (Figure 1). Multivariates analysis of covariance (ANCOVA) with controlling age and averaged cortical thickness was conducted. Post-hoc multiple comparison with Bonferroni test was performed. The Pearson correlation analyses were used to assess relationship between cortical thickness with clinical measurements.RESULTS
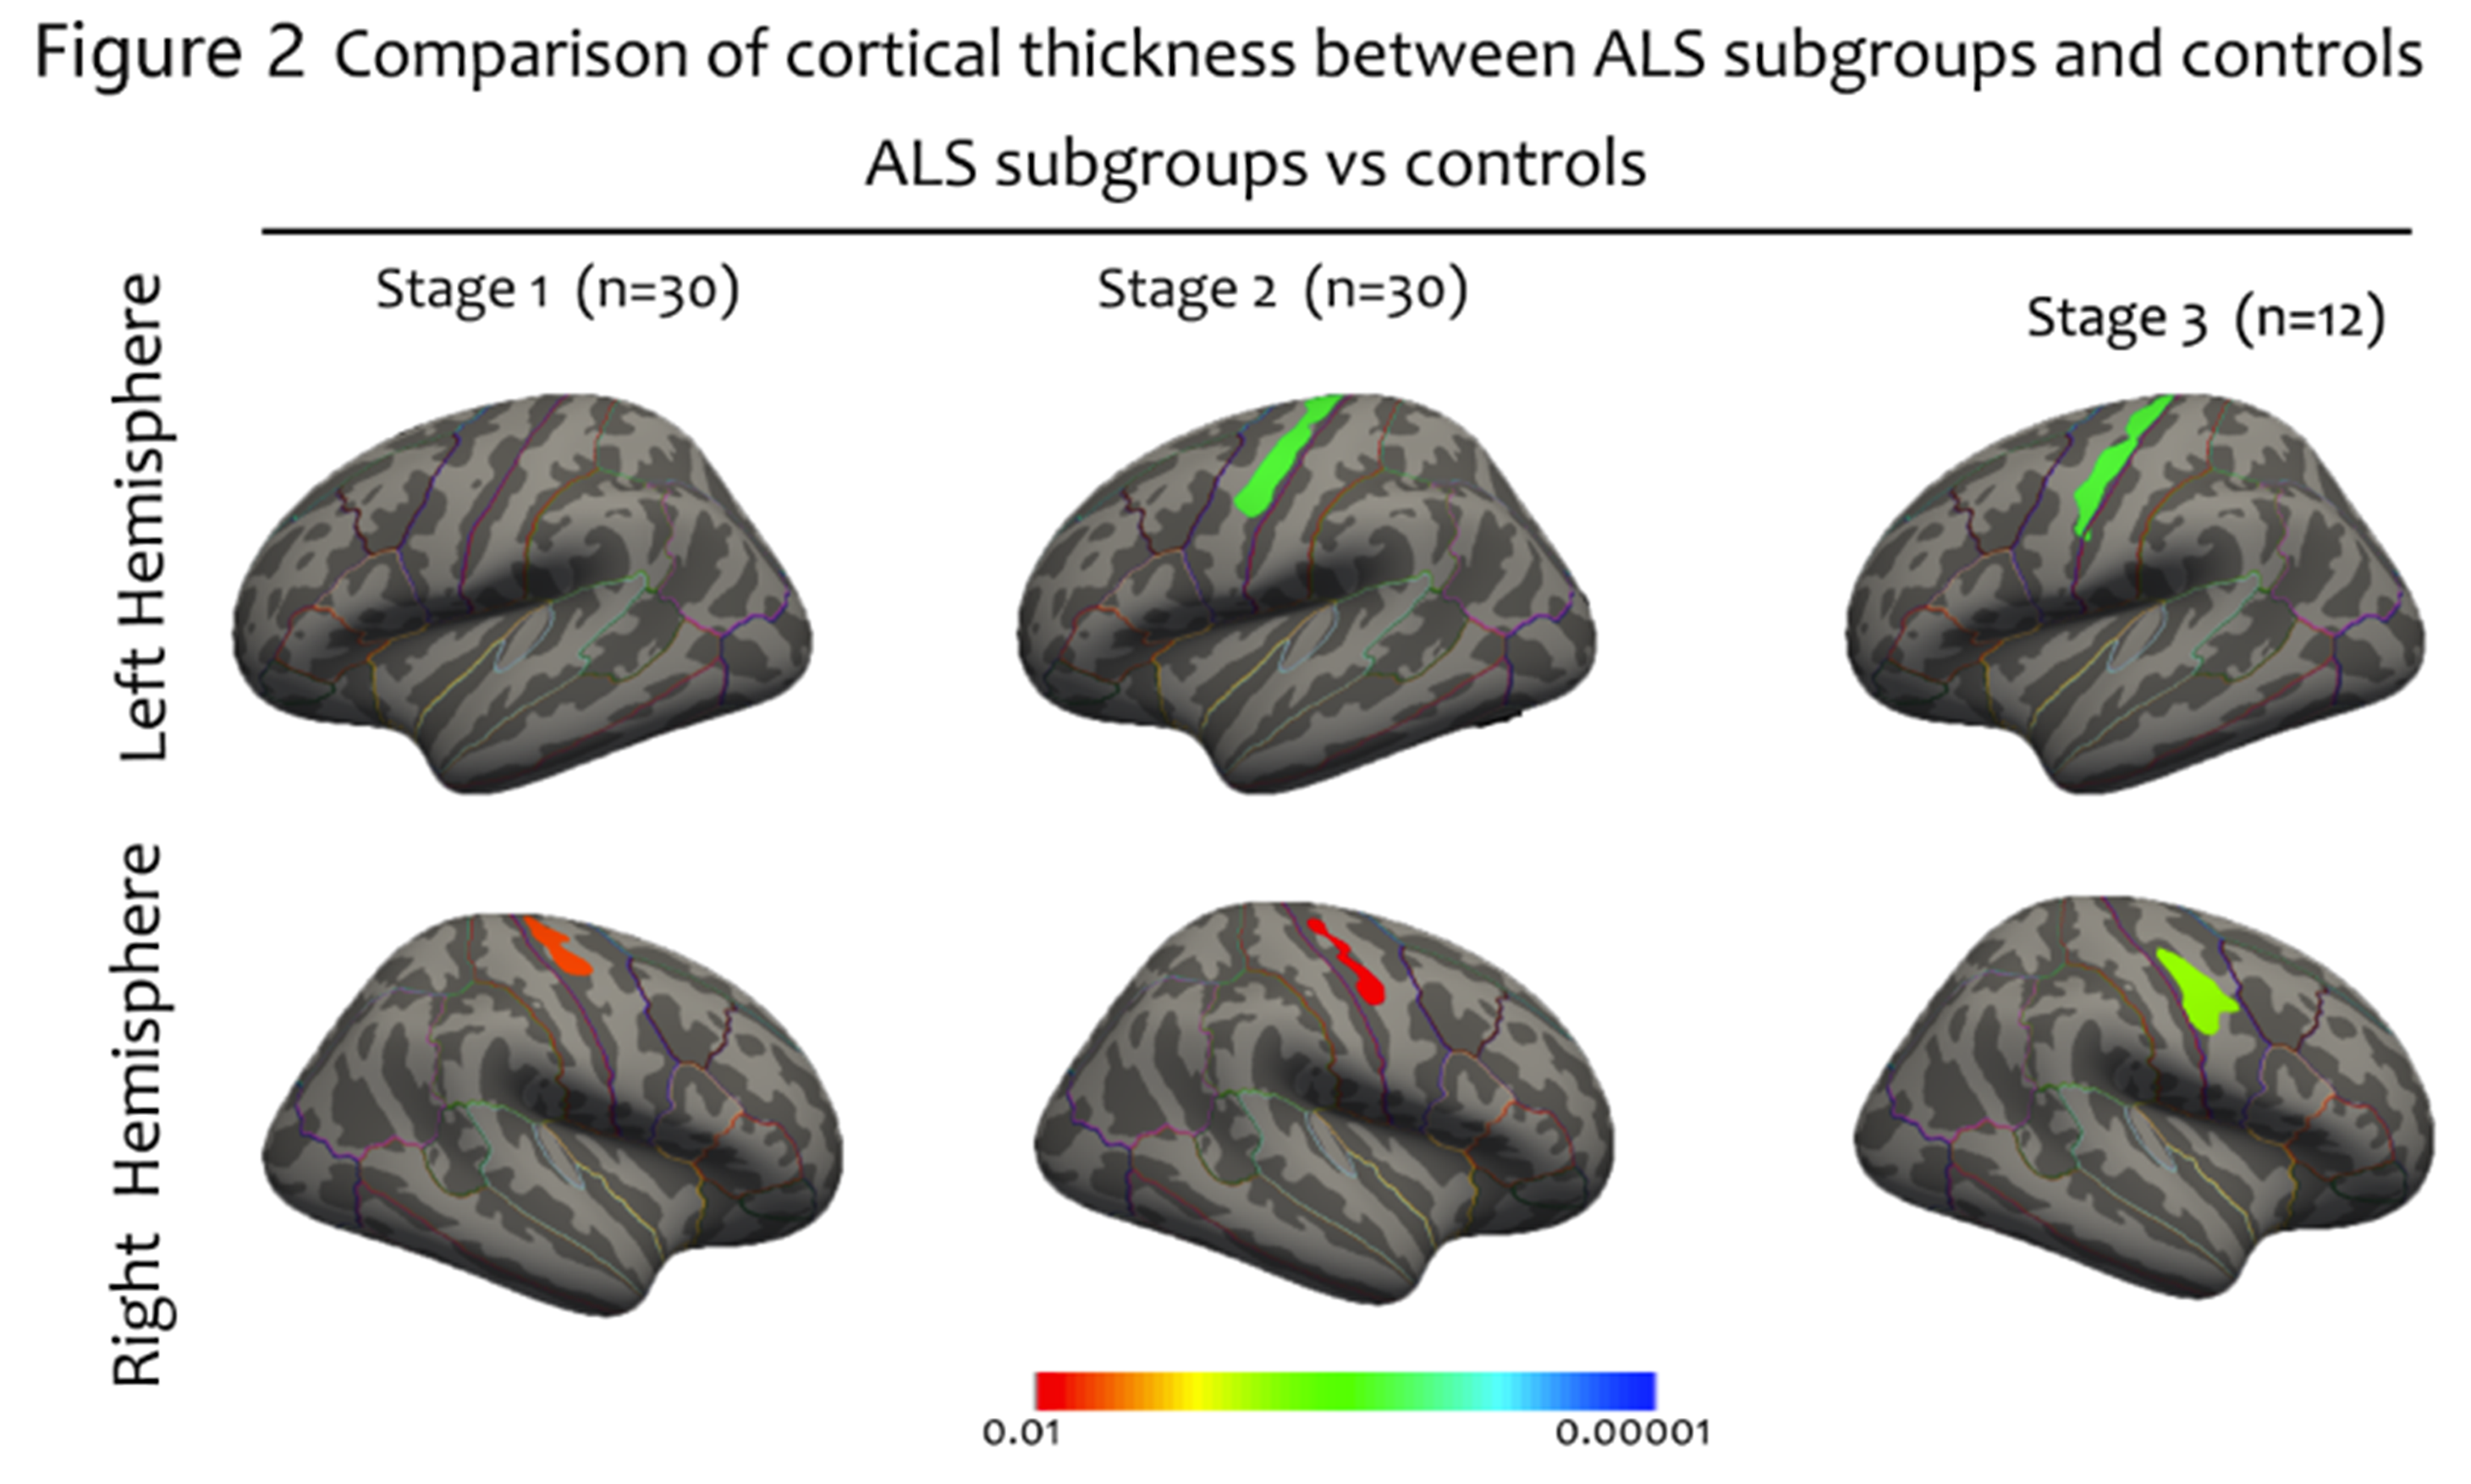
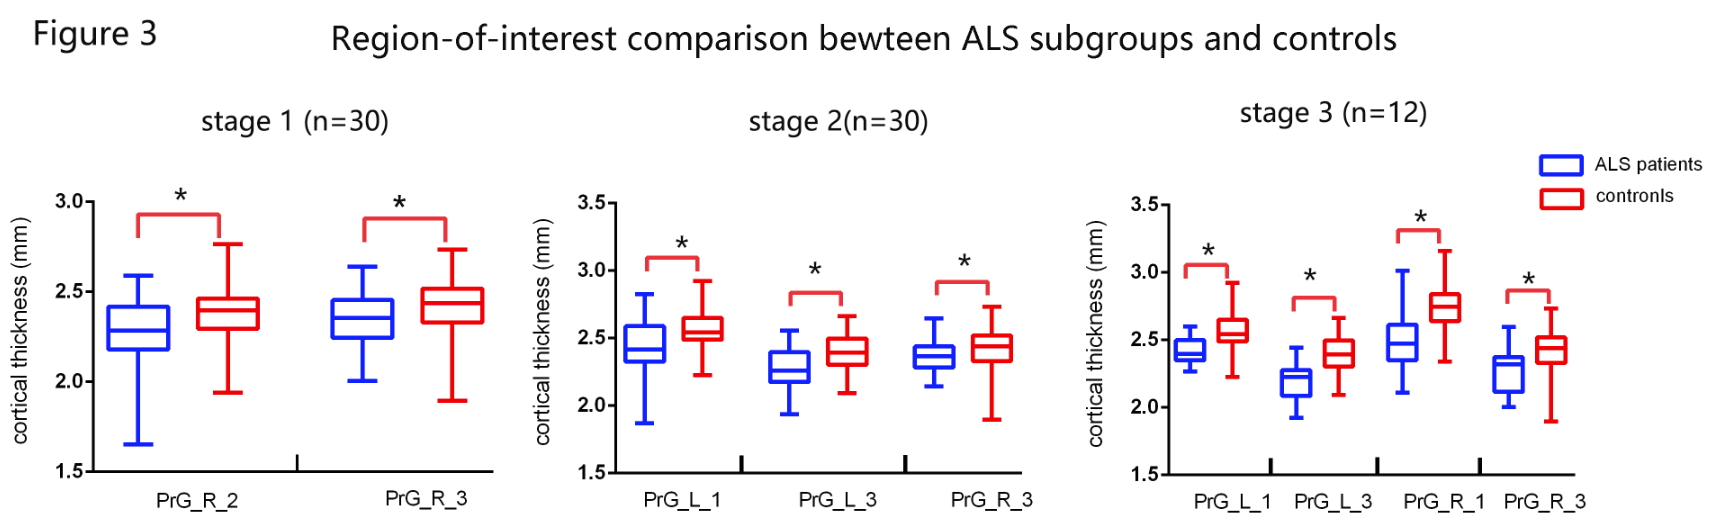
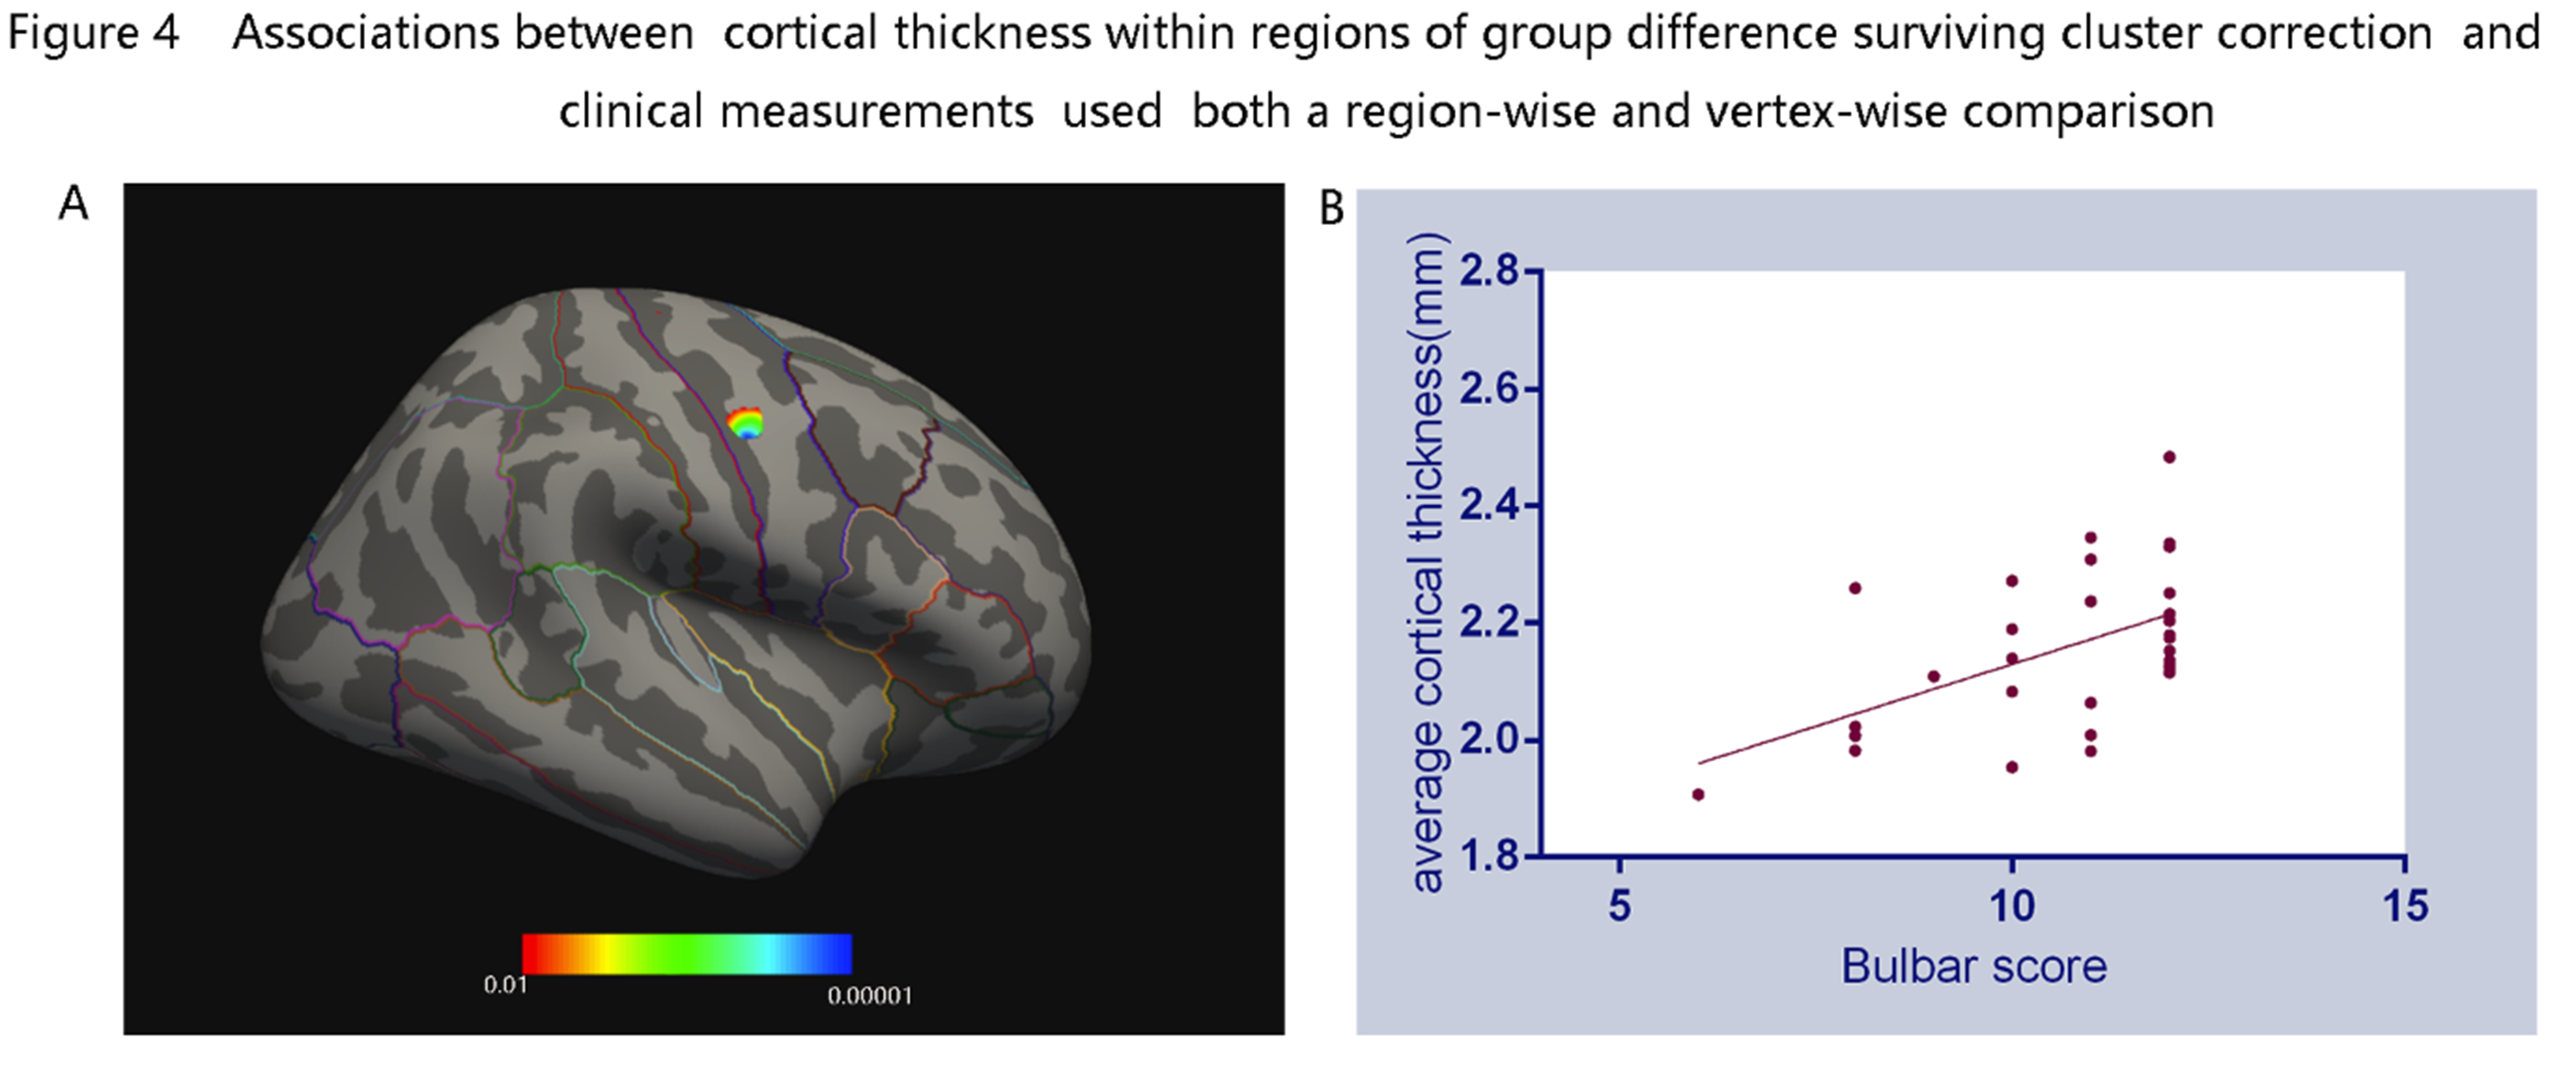
ALS patients in stage 1 demonstrated significantly atrophy in the right PrG. While decreased bilateral cortical thickness in PrG were found in patients at stage 2 and 3, respectively (figure 2). Although the group differences among patients at different stages did not survive the threshold, it was obvious that the pattern of cortical atrophy in PrG extended as the stages progressed consecutively. By using the precise Brainnetome Atlas, the ROI analyses detected multiple brain regions atrophy in ALS patients at different stages (figure 3). In consistent with previous vertex-wise analysis, patients at stage 1 showed reduced cortical thickness primarily in the right PrG-2 and 3 regions, indicated function impairment in upper limb region. Patients at stage 2 showed cortical thinning in bilateral PrG-3 and left PrG-1, with additional right PrG-1 involvement in patients at stage 3. The correlation analyses revealed significant positive relationship between bulbar functional subscores with PrG cortical thickness of ALS patients at stage 2(figure 4).DISCUSSION
The significant cortical thinning of the PrG in ALS patients at different stages is consistent with focal degeneration and consecutive progression of disease pathology in the motor cortex. The prominent right PrG thinning corresponding to upper limb segments of the motor homunculus in patients at stage 1, might indicate the vulnerability of right PrG in ALS patients. The similar pattern of cortical thinning in patients at stage 2 and 3 was unexpected. As suggested by Balendra, patients progressed to later stages consecutively without skipping.6 Therefore, we hypothesized that a more profound cortical thinning in patients at stage 3 should be reasonable.However, the averaged duration was 18.1 months from stage 1 to stage 2, and 5.5 months from stage 2 to stage 3, thus, we indicated that the prolonged duration from stage 1 to stage 2 was critical and should be served as important therapeutic window along the disease course of ALS. Because when patients at stage 1 underwent long time to involve the second body parts, extensive motor cortex involvement mimics with more advanced disease stage was not only an accelerated signature of disease progression, but indicative of more severe disease pathology that may be difficult to alleviate. Furthermore, the relationship between cortical thickness and bulbar subscore, as well as comparable cortical tinning at stage 2 and 3 provide direct evidence for identical score of ALSFRS-r between patients at stage 2 and 3.1CONCLUSION
The corresponding between cortical thinning in the PrG and King’s clinical staging system, confirmed the validity of this staging as promising classification criteria for patient care. However, the disparity between similar cortical involvement and different stages classification in stage 2 and 3, highlighted the importance of incorporating cortical evaluation to King’s clinical staging system for promising clinical management.Acknowledgements
No acknowledgement found.References
1. Roche JC, Rojas-Garcia R, Scott KM, et al. A proposed staging system for amyotrophic lateral sclerosis. BRAIN. 2012 2012-03-01;135(Pt 3):847-52.
2. Chio A, Pagani M, Agosta F, Calvo A, Cistaro A, Filippi M. Neuroimaging in amyotrophic lateral sclerosis: insights into structural and functional changes. LANCET NEUROL. 2014 2014-12-01;13(12):1228-40.
3. Bede P, Bokde A, Elamin M, et al. Grey matter correlates of clinical variables in amyotrophic lateral sclerosis (ALS): a neuroimaging study of ALS motor phenotype heterogeneity and cortical focality. J Neurol Neurosurg Psychiatry. 2013 2013-07-01;84(7):766-73.
4. Walhout R, Westeneng HJ, Verstraete E, et al. Cortical thickness in ALS: towards a marker for upper motor neuron involvement. Journal of Neurology, Neurosurgery & Psychiatry. 2015 2015-03-01;86(3):288-94.
5. Fan L, Li H, Zhuo J, et al. The Human Brainnetome Atlas: A New Brain Atlas Based on Connectional Architecture. CEREB CORTEX. 2016 2016-08-01;26(8):3508-26.
6. Balendra R, Jones A, Jivraj N, et al. Use of clinical staging in amyotrophic lateral sclerosis for phase 3 clinical trials. J Neurol Neurosurg Psychiatry. 2015 2015-01-01;86(1):45-9.
Figures