0973
Data-driven modelling of diffusion MRI changes in Amyotrophic Lateral Sclerosis (ALS) indicates evolution of distal prior to proximal corticospinal tract pathology1Clinical Imaging Sciences Centre, Brighton and Sussex Medical School, Brighton, United Kingdom, 2Department of Psychology, Social Work and Counselling, University of Greenwich, London, United Kingdom, 3Institute of Psychiatry, Psychology & Neuroscience, King's College London, London, United Kingdom, 4Centre for Medical Image Computing, University College London, London, United Kingdom, 5Trafford Centre for Biomedical Research, Brighton and Sussex Medical School, Brighton, United Kingdom
Synopsis
In order to investigate the likely progression of neurodegeneration in amyotrophic lateral sclerosis (ALS) patients, we applied a novel mathematical model to multi-site diffusion MRI data. Our results indicate directional evolution of disease in the corticospinal tracts (CSTs) of ALS patients, in a distal to proximal manner.
Background
A key aspect of understanding pathophysiology in neurodegenerative disorders is modelling patterns of disease progression. In amyotrophic lateral sclerosis (ALS), there is a need to integrate clinical observation-based staging systems such as 1,2, with ‘unbiased’ staging of biomarkers. To this end, we have adapted and extended an event-based model (EBM) for ALS from previous work in Alzheimer's disease3,4. Unlike traditional models of disease progression, event-based models do not rely on a priori staging of patients but extract the event ordering directly from the data, thus minimising subjective bias. In MR imaging, fractional anisotropy (FA) derived from diffusion tensor imaging is an obvious candidate to test the hypothesis that imaging events can be staged in the EBM.Methods
Using one contemporary and two historical ALS data sets comprising diffusion MRI, we defined biomarkers as the mean FA values of white matter (WM) tracts previously studied and implicated in ALS. The objective of this study was to use a novel event-based model to analyse the likely ordering of these biomarkers in the progression of ALS.
The data sets were derived from cross-sectional samples, comprising 87 ALS patients (M/F = 61/26, mean age = 56.3 ± 11.9 years) and 69 matched controls (M/F = 47/22, mean age = 52.8 ± 12.8 years). No ALS patients were classified as having ALS-FTD. FA images were computed and then normalised into MNI space using Advanced Normalization Tools (ANTs) 2.1.0. The resulting maps were then harmonised using the DTI-adapted ComBat software5, to reduce unwanted inter-site variability.
For each tract, region of interest (ROI) masks were created from the two JHU DTI-based white-matter tractography atlases6 included in FSL 5.0.7. The ROI masks for the corticospinal tracts were created from the JHU white-matter tractography atlas, thresholded at 50%; all other ROI masks were created from the ICBM-DTI-81 atlas. The left and right sides of each tract were considered as separate biomarkers.
To allow the investigation of a directional progression of ALS white matter neurodegeneration, the corticospinal tracts (CSTs) were split in the inferior to superior direction. Two separate divisions were analysed: i) CSTs divided into halves, and ii) CSTs divided into thirds.
Results
The most likely order of progression (Figure 1 (a)) showed that FA changes in the lower aspect of the CSTs occur at an early stage of disease evolution, with changes in the upper aspect occurring soon after. This result was found individually in all three data sets, as well as when combining them.
This pattern of distal to proximal progression was also found when the CSTs were divided into thirds (Figure 1 (b)).
Discussion
This proof-of-principle study shows that data-driven models of ALS progression are feasible, and the diffusion MRI event ordering results suggest robustly that damage to the CSTs occurs distally prior to proximally. Nevertheless, a general important limitation must be discussed: the small sample size may have biased our results. We have tried to address this issue through the use of bootstrapping, and by assessing how the results varied across three separate data sets.
While the CST results were consistent across the entire process, results for other regions such as the corpus callosum were less constant, suggesting that the biomarker ordering in the wider population may diverge from this sequence. In order to generalise these results to the wider spectrum of ALS, future studies on larger data sets are warranted.
Conclusion
The application of the EBM to diffusion MRI data indicates evolution of corticospinal tract pathology in a distal to proximal manner. These findings may provide support for the “dying-back” hypothesis of upper motor neurone degeneration in ALS.Acknowledgements
MC Gabel is funded by the MND Assocation (Gabel/Oct16/966-799).References
- Roche JC, Rojas-Garcia R, Scott KM, et al. A proposed staging system for amyotrophic lateral sclerosis. Brain, 2012, 135:847-852
- Chiò A, Hammond ER, Mora G, et al. Development and evaluation of a clinical staging system for amyotrophic lateral sclerosis. J Neurol Neurosurg Psychiatry, 2013, 86:38-44
- Fonteijn HM, Modat M, Clarkson MJ, et al. An event-based model for disease progression and its application in familial Alzheimer's disease and Huntington's disease. NeuroImage, 2012, 60:1880-1889
- Young AL, Oxtoby NP, Daga P, et al. A data-driven model of biomarker changes in sporadic Alzheimer's disease. Brain, 2014, 137:2564-77
- Fortin J-P, Parker D, Tunç B, et al. Harmonization of multi-site diffusion tensor imaging data. NeuroImage, 2017, 161:149-170
- Mori S, Wakana S, van Zijl PCM et al. MRI Atlas of Human White Matter. Elsevier Science, 2005
Figures
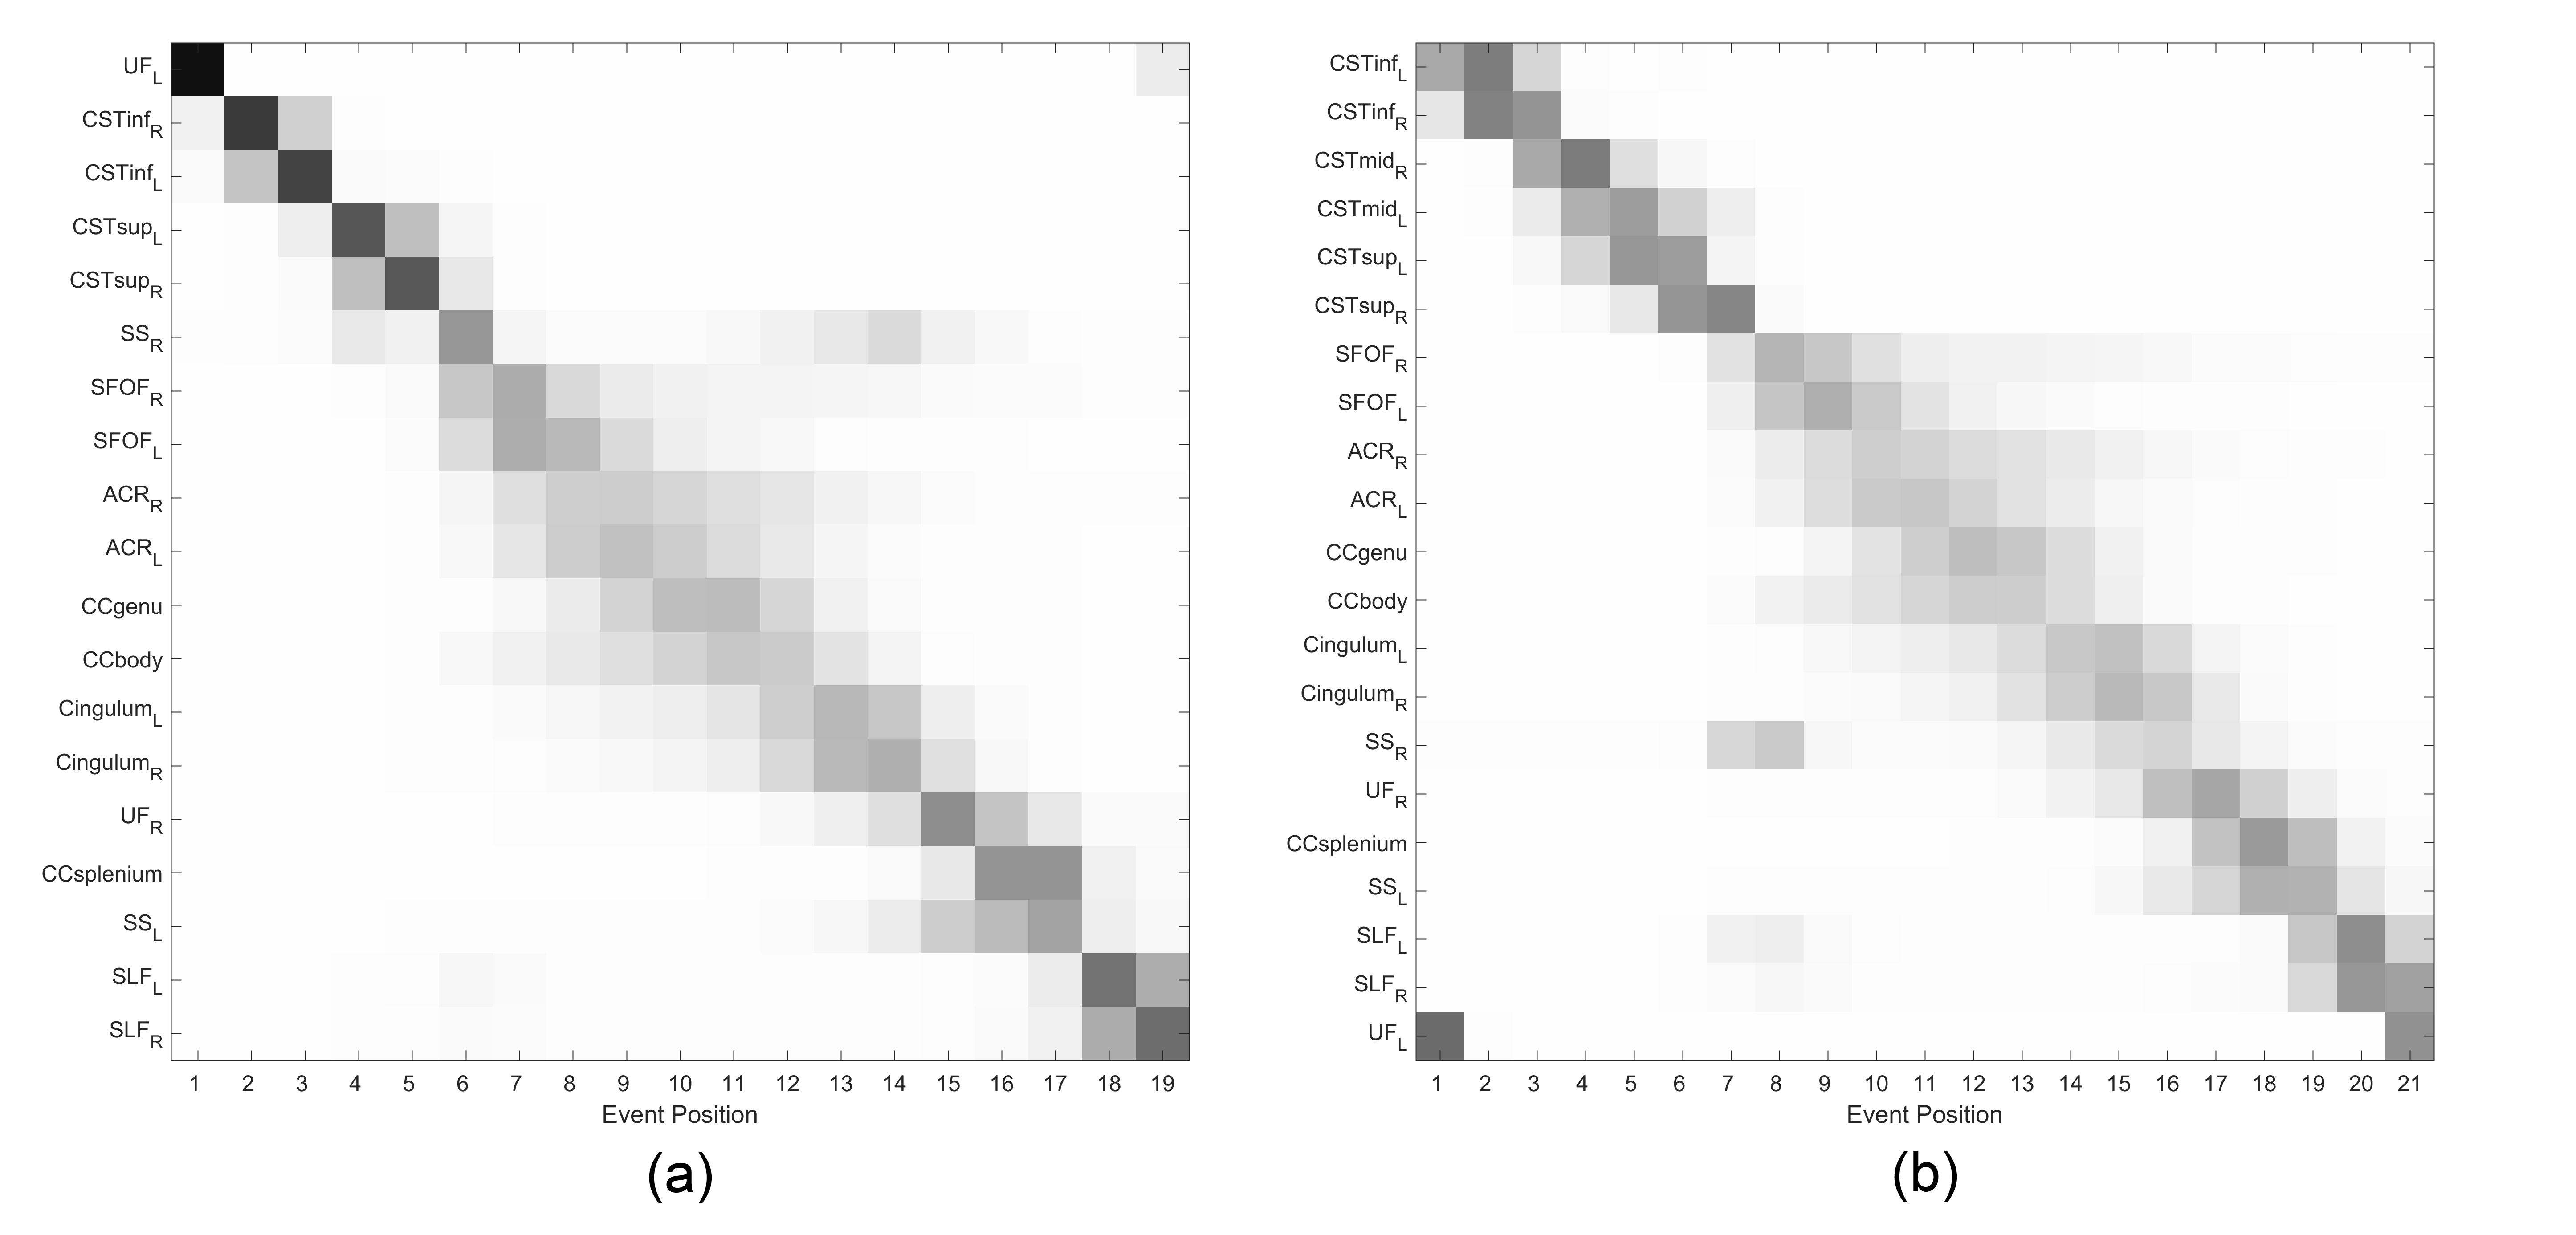
Positional variance diagrams showing the variation of event order during the modelling process. The most likely event order is given along the y-axis. (a) shows the model output when CSTs are divided in two, (b) shows the output when CSTs are divided into three; all other biomarker data are identical.
CST=corticospinal tract, CC=corpus callosum, ACR=anterior corona radiata, SLF=superior longitudinal fasciculus, SS=sagittal stratum, SFOF=superior fronto-occipital fasciculus, UF=uncinate fasciculus. L/R=left/right hemisphere, inf/mid/sup=inferior/middle/superior.