0971
In Vivo Hyperpolarized 129Xe Diffusion Morphometry of the Mouse Lung1Center for Pulmonary Imaging Research, Cincinnati Children’s Hospital Medical Center, Cincinnati, OH, United States, 2Department of Biomedical Engineering, University of Cincinnati, Cincinnati, OH, United States, 3Department of Physics, West Texas A&M University, Canyon, TX, United States, 4Department of Radiology, Washington University School of Medicine, St. Louis, MO, United States, 5Division of Critical Care Medicine, Cincinnati Children’s Hospital Medical Center, Cincinnati, OH, United States
Synopsis
Hyperpolarized 129Xe diffusion morphometry allows the microstructural dimensions of the lungs to be measured noninvasively, providing a means to quantify normal alveolar growth and disease progression in disorders such as emphysema. In the preclinical setting, 129Xe diffusion morphometry holds the potential to provide insights into fundamental pulmonary biology and to assess the efficacy of potential therapies. However, to have the greatest impact on pulmonary biomedicine, this approach must be applied reliably to mouse models, where tools to investigate disease mechanisms are most highly developed. Here, we demonstrate the feasibility of high-resolution, 129Xe diffusion morphometry in living mice.
Abstract
Introduction: Hyperpolarized (HP) 129Xe MRI has emerged a powerful tool to quantify regional lung function (e.g., ventilation and gas exchange) in a wide range of diseases including asthma, cystic fibrosis and chronic obstructive pulmonary disease 1-3. In disorders characterized by alveolar destruction (e.g., emphysema), disease severity can also be assessed by measuring the 129Xe apparent diffusion coefficient (ADC) 4, 5. That is, on the millisecond timescale gas atoms diffuse a smaller distance after inhalation because of collisions with alveolar walls, but restricted diffusion decreases as airspace size increases. Further, by imaging HP gases with multiple diffusion-weightings (i.e., b-values), it is possible to quantify the dimensions of the pulmonary microstructure and extract physiologically relevant, morphological parameters, including alveolar surface-to-volume ratio and number density (Na) 6, 7 . Because these parameters are altered by disease, “diffusion morphometry” can non-invasively characterize pathology progression in patients. In the preclinical setting, diffusion morphometry provides direct information about lung development and pulmonary disease pathogenesis and could be used to preclinically assess the efficacy of potential therapies. Here, we demonstrate for the first time the feasibility of high-resolution, in vivo 129Xe diffusion morphometry of the mouse lung.
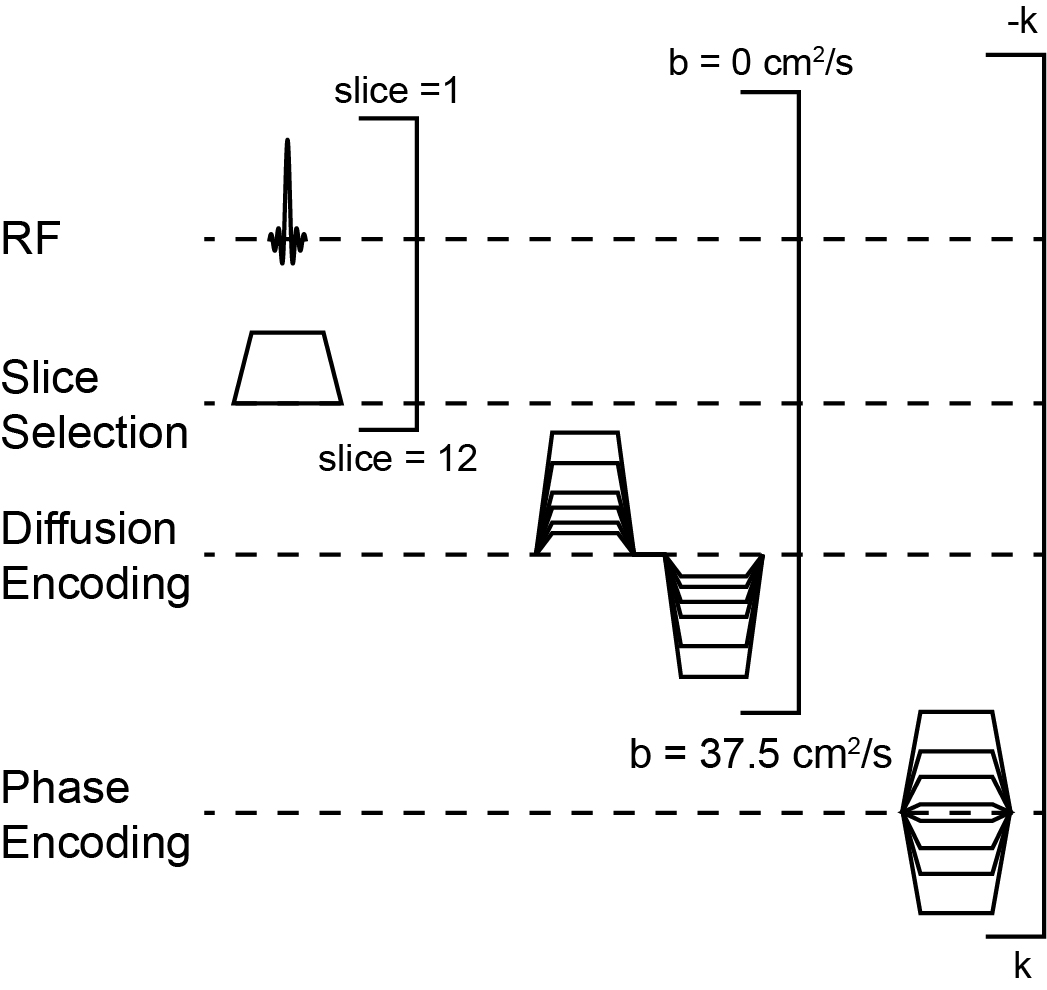
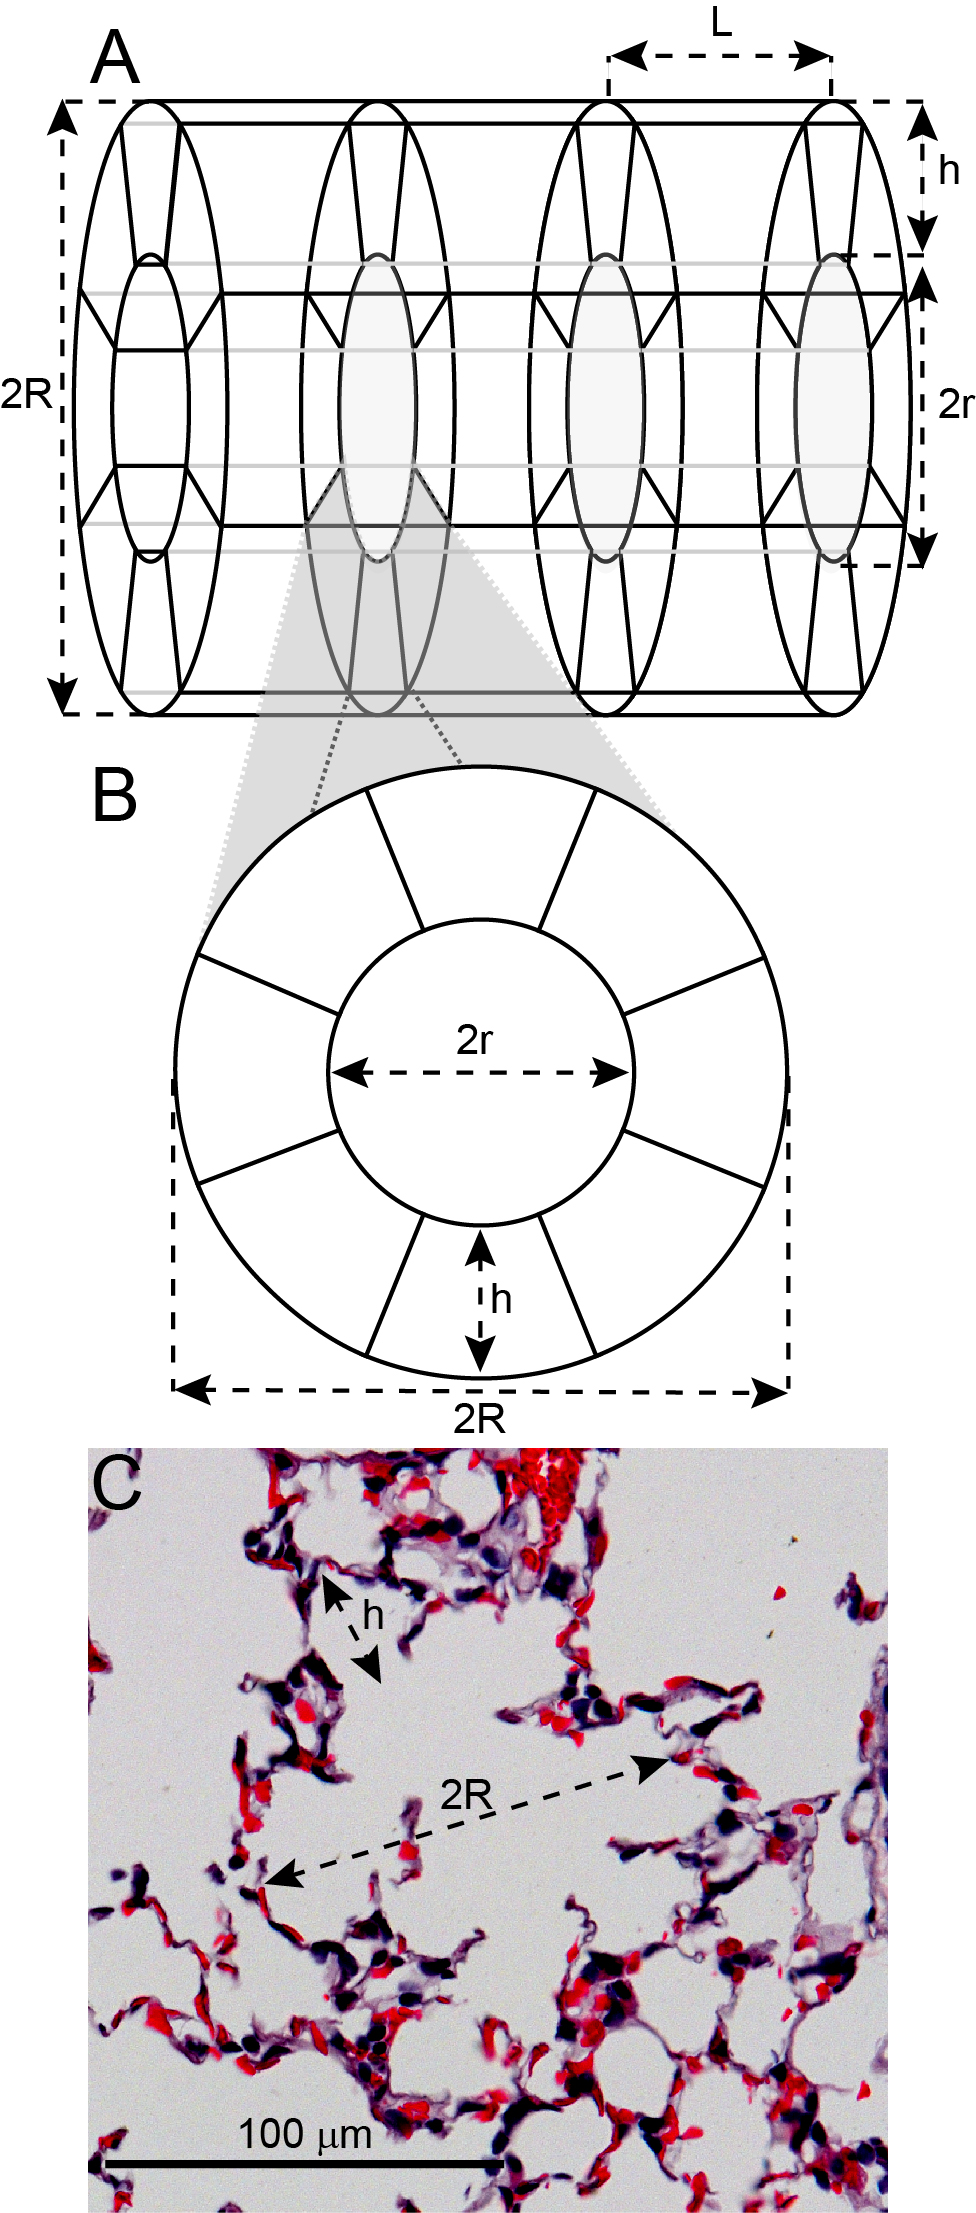
Methods: Diffusion-weighted MR images were acquired using a multi-slice, gradient-echo sequence (Figure 1) on a 7 T Bruker BioSpin scanner operated with ParaVision 6.0. Acquisition parameters included: matrix = 642, FOV = 32×32 mm2, axial slice thickness = 1.5 mm, slices = 12, bandwidth = 50 kHz, dummy pulses = 8, α = 45º, TE = 7.95 ms, TR = 1 s, δ = 2.575 ms, Δ = 2.585 ms, b = [0, 6.25, 12.5, 18.75, 25, 31.25, 37.5] s/cm2. 129Xe was polarized to ~30% using a commercial polarizer (Model 9810, Polarean Inc., Durham, NC). Seven C57BL/6 mice were ventilated at an inspiratory pressure of 10 cm H2O using a customized-built, HP-gas-compatible ventilator 8, and data were acquired at full-inspiration using a mixture of 70% HP 129Xe and 30% O2. Maps of were extracted from multi-b-value 129Xe images using Bayesian probability theory, the acinar model of Weibel (Figure 2), and the 129Xe-specfic theory of Sukstanskii and Yablonskiy 9-14. Following imaging, mice were euthanized by exsanguination. The lungs were inflation-fixed in situ at a pressure of 10 cm H2O to match in vivo conditions, and the lungs were then removed, paraffin embedded, and processed for histology.
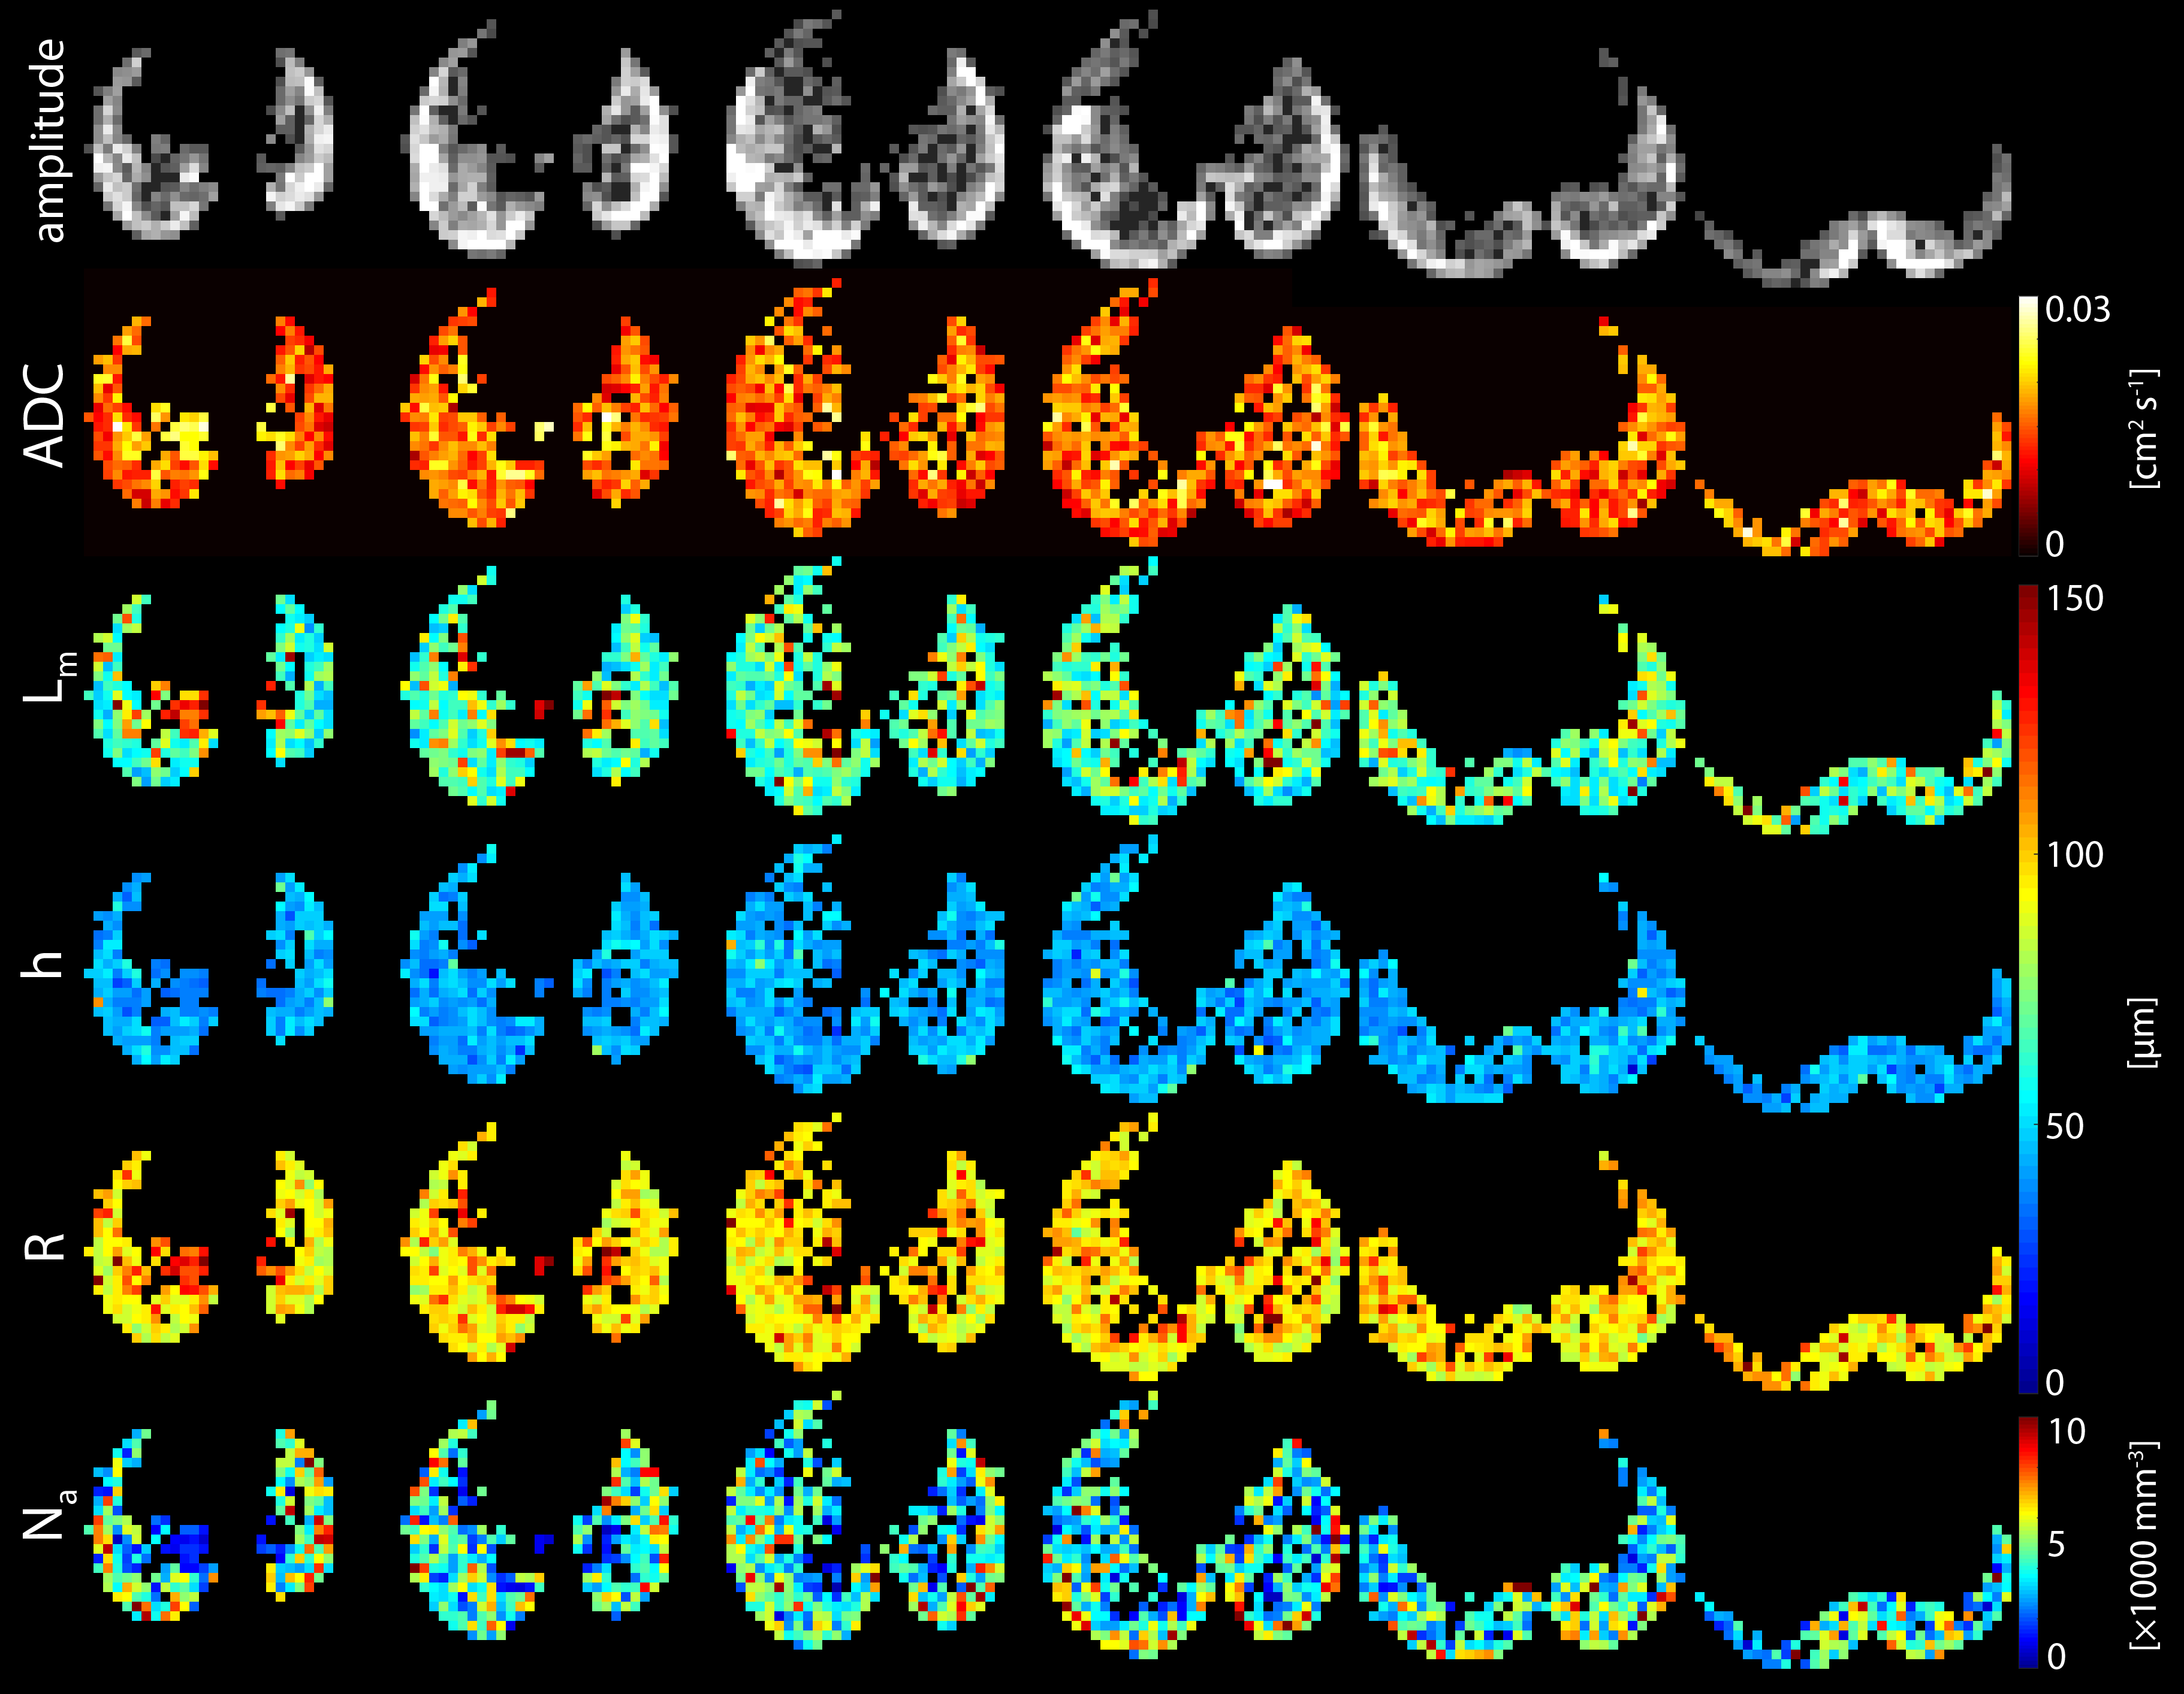
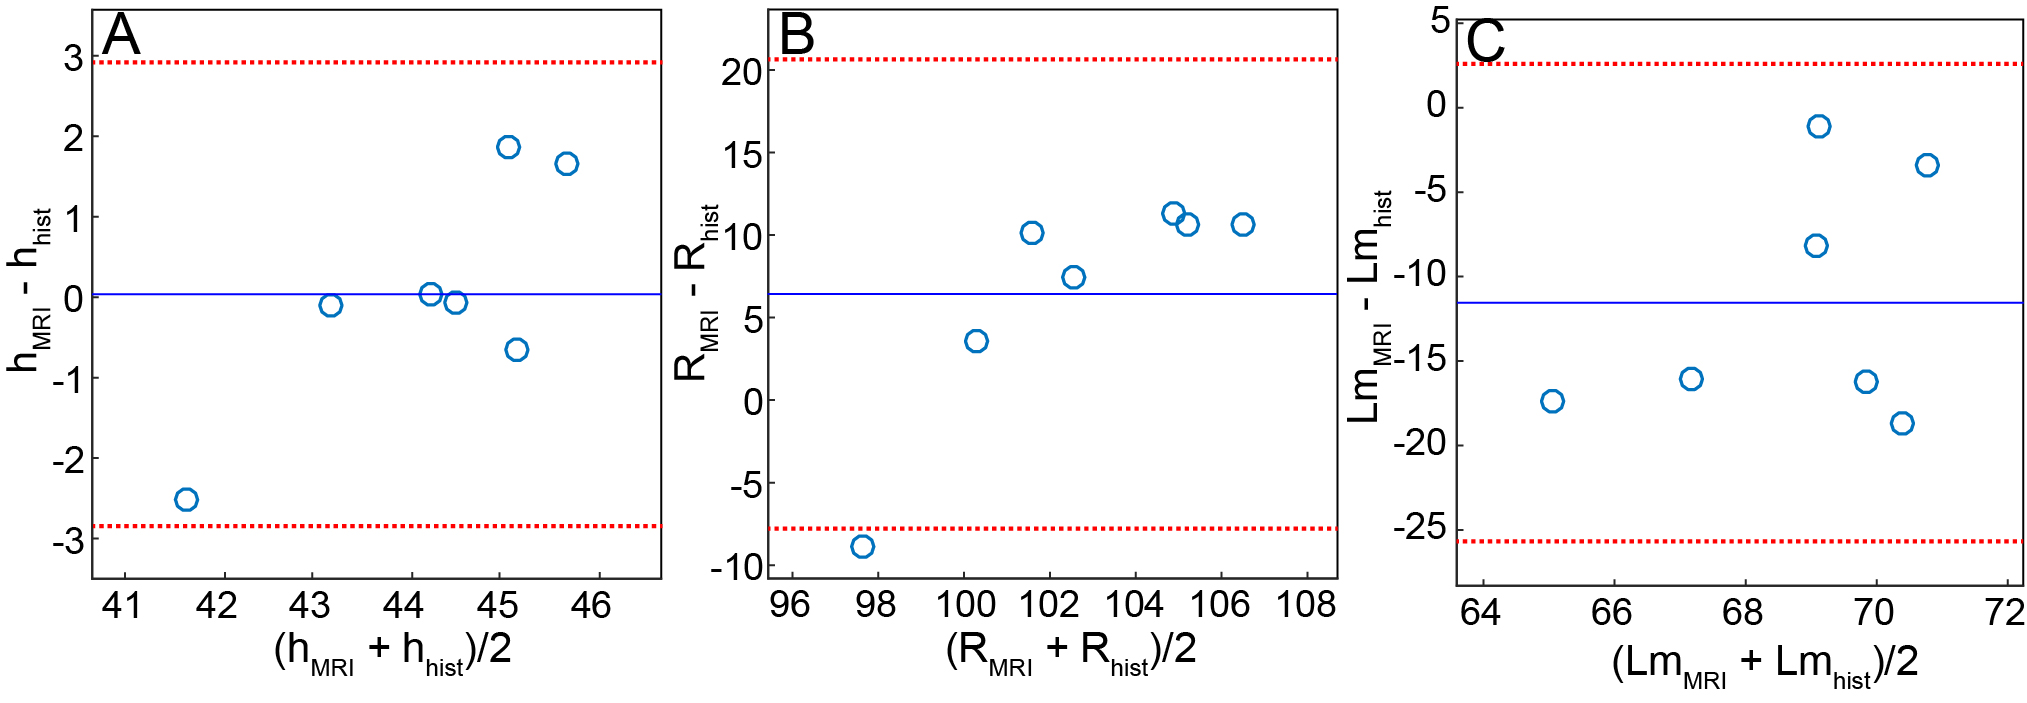
Results: Diffusion-weighted images with sufficient signal (signal-to-noise ratio ~20 on b=0 images) for diffusion morphometry were obtained from all mice (Figure 3). The mean, whole lung ADC of all mice was 0.0165 ± 0.0005 cm2/s. Population means for alveolar sleeve depth, h, and acinar duct radius, R, were 44 ± 1 µm and 99 ± 2 µm, respectively. From regional h and R measurements, additional morphometric parameters including mean linear intercept (Lm = 74 ± 3 µm,) surface-to-volume ratio (58 ± 2 mm-1), and alveolar number density (Na = 4600 ± 200 mm-3) were calculated. The parameters h, R, and Lm extracted from these data were found to be in good agreement with histological measurements (Figure 4).
Discussion and Conclusion: The mean ADC of ~0.016 cm2/s is substantially less than the ~0.04 cm2/s observed in adult humans4, consistent with highly restricted diffusion in the small airspaces of the mouse lung. Bland-Altman analysis showed that values of h and R obtained using diffusion morphometry were in good agreement with those obtained using conventional histology, and the mean difference between MRI-derived and histology-derived metrics were not significantly different than 0 µm (p>0.05) for both metrics. MRI-derived Lm values skewed to somewhat lower values (by ~10 µm) than those obtained from histology. This pattern is similar to that previously reported for HP 3He diffusion morphometry in mice10. Whether these small discrepancies reflect limitations of the geometric model (Figure 2) or non-physiological distortion of lung microstructure during inflation/fixation remains to be determined. The alveolar number density (Na) of ~4300 mm-3 was consistent with expectations, but was somewhat larger that the previously reported value of 3200 mm-3 obtained using HP 3He 10. While not investigated here, this discrepancy likely reflects differences in animal age or ventilation strategy. Together these results suggest that 129Xe diffusion morphometry provides physiologically relevant measures of lung microstructure in mice and will allow changes such as fibrotic alveolar wall thickening, emphysematous tissue destruction, and alveolar growth to be quantified noninvasively, paving the way to assess normal lung development and disease mechanisms in mouse models of human disease.
Acknowledgements
This work was funded by NIH awards UL1TR001425 and R00-HL-111217-03 and the Cincinnati Children’s Hospital Medical Center’s Trustee Award & Procter Scholar (TAPS) Program and Shared Facility Discovery Award Program.References
[1] Virgincar RS, Cleveland ZI, Kaushik SS, Freeman MS, Nouls J, Cofer G, Martinez-Jimenez S, He M, Kraft M, Wolber J, McAdams HP, Driehuys B: Quantitative analysis of hyperpolarized 129Xe ventilation imaging in healthy volunteers and subjects with chronic obstructive pulmonary disease. NMR in Biomedicine 2013, 26:424-35.
[2] Kirby M, Svenningsen S, Kanhere N, Owrangi A, Wheatley A, Coxson HO, Santyr GE, Paterson NAM, McCormack DG, Parraga G: Pulmonary ventilation visualized using hyperpolarized helium-3 and xenon-129 magnetic resonance imaging: differences in COPD and relationship to emphysema. Journal of Applied Physiology 2013, 114:707-15.
[3] Thomen RP, Walkup LL, Roach DJ, Cleveland ZI, Clancy JP, Woods JC: Hyperpolarized 129Xe for investigation of mild cystic fibrosis lung disease in pediatric patients. Journal of Cystic Fibrosis 2017, 16:275-82.
[4] Kaushik SS, Cleveland ZI, Cofer GP, Metz G, Beaver D, Nouls J, Kraft M, Wolber J, Kelly KT, Auffermann W, McAdams HP, Driehuys B: Diffusion Weighted Imaging of Hyperpolarized 129Xe in Patients with Chronic Obstructive Pulmonary Disease. Magnetic Resonance in Medicine 2011, 65:1154–65.
[5] Kirby M, Svenningsen S, Owrangi A, Wheatley A, Farag A, Ouriadov A, Santyr GE, Etemad-Rezai R, Coxson HO, McCormack DG, Parraga G: Hyperpolarized He-3 and Xe-129 MR Imaging in Healthy Volunteers and Patients with Chronic Obstructive Pulmonary Disease. Radiology 2012, 265:600-10.
[6] Yablonskiy DA, Sukstanskii AL, Woods JC, Gierada DS, Quirk JD, Hogg JC, Cooper JD, Conradi MS: Quantification of lung microstructure with hyperpolarized He-3 diffusion MRI. Journal of Applied Physiology 2009, 107:1258-65.
[7] Quirk JD, Lutey BA, Gierada DS, Woods JC, Senior RM, Lefrak SS, Sukstanskii AL, Conradi MS, Yablonskiy DA: In Vivo Detection of Acinar Microstructural Changes in Early Emphysema with He-3 Lung Morphometry. Radiology 2011, 260:866-74.
[8] Nouls J, Fanarjian M, Hedlund L, Driehuys B: A Constant-Volume Ventilator and Gas Recapture System for Hyperpolarized Gas MRI of Mouse and Rat Lungs. Concepts in Magnetic Resonance Part B-Magnetic Resonance Engineering 2011, 39B:78-88.
[9] Rodriguez M, Bur S, Favre A, Weibel ER: Pulmonary Acinus - Geometry and Morphometry of the Peripheral Airway System in Rat and Rabbit. Am J Anat 1987, 180:143-55.
[10] Wang W, Nguyen NM, Yablonskiy DA, Sukstanskii AL, Osmanagic E, Atkinson JJ, Conradi MS, Woods JC: Imaging Lung Microstructure in Mice With Hyperpolarized He-3 Diffusion MRI. Magnetic Resonance in Medicine 2011, 65:620-6.
[11] Ouriadov A, Fox M, Hegarty E, Parraga G, Wong E, Santyr GE: Early Stage Radiation-Induced Lung Injury Detected Using Hyperpolarized Xe-129 Morphometry: Proof-of-Concept Demonstration in a Rat Model. Magnetic Resonance in Medicine 2016, 75:2421-31.
[12] Sukstanskii AL, Yablonskiy DA: Lung morphometry with hyperpolarized 129Xe: Theoretical background. Magnetic Resonance in Medicine 2012, 67:856-66.
[13] Bretthorst GL: An introduction to parameter estimation using Bayesian probability theory. Dartmouth: . Dartmouth, NH: Kluwer Academic Publishers, 1989.
[14] Quirk JD, Sukstanskii AL, Bretthorst GL, Yablonskiy DA: Optimal decay rate constant estimates from phased array data utilizing joint Bayesian analysis. Journal of Magnetic Resonance 2009, 198:49-56.
[15] Moller HE, Cleveland ZI, Driehuys B: Relaxation of hyperpolarized 129Xe in a deflating polymer bag. Journal of Magnetic Resonance 2011, 212:109-15.
Figures