0969
Correlating 129Xe Gas Exchange MRI with 99mTc Perfusion ScintigraphyZiyi Wang1, Leith Rankine2, Joseph Mammarappallil3, Sudarshan Rajagopal4, and Bastiaan Driehuys1,2,3
1Biomedical Engineering, Duke University, Durham, NC, United States, 2Medical Physics Graduate Program, Duke University, Durham, NC, United States, 3Radiology, Duke University Medical Center, Durham, NC, United States, 4Division of Cardiology, Duke University Medical Center, Durham, NC, United States
Synopsis
Hyperpolarized 129Xe MRI is emerging as a unique means of imaging pulmonary gas exchange, enabling separate 3D encoding of 129Xe in the gas-phase, interstitial barrier, and red blood cells (RBC). In patients where diffusion limitation is not significant, defects in RBC transfer and perfusion deficits should more closely reflect diminished capillary blood volume or perfusion limitation. Here we establish an initial approach to correlate RBC transfer images against an accepted perfusion imaging reference— 99mTc scintigraphy. We demonstrate in patients with pulmonary arterial hypertension and COPD that RBC transfer projections compare both qualitatively and quantitatively with 99mTc scintigraphy.
INTRODUCTION
Hyperpolarized 129Xe MRI is emerging as a unique means to image pulmonary gas exchange. 1 Its solubility and distinct chemical shift make it possible to produce separate 3D images of ventilation, interstitial barrier uptake and red blood cell (RBC) transfer in a single breath. 1, 2 This capability has already provided unique insights in COPD, asthma, and interstitial lung disease. However, the unique nature of 129Xe gas exchange MRI also complicates its technical validation. While the global ratio of RBC:barrier correlates strongly with DLCO, 3 there is no gold standard for regionally resolved barrier uptake or RBC transfer. However, in the absence of diffusion limitation, 4 regionally impaired RBC transfer should more closely reflect diminished capillary blood volume or perfusion limitation. 5 This provides a potential means to perform validation of RBC transfer images against an accepted perfusion imaging standard — 99mTc scintigraphy. As an initial test of this idea we sought to evaluate regional correlation between RBC transfer MRI and 99mTc perfusion scintigraphy in a cohort of patients with pulmonary vascular disease and COPD.METHODS
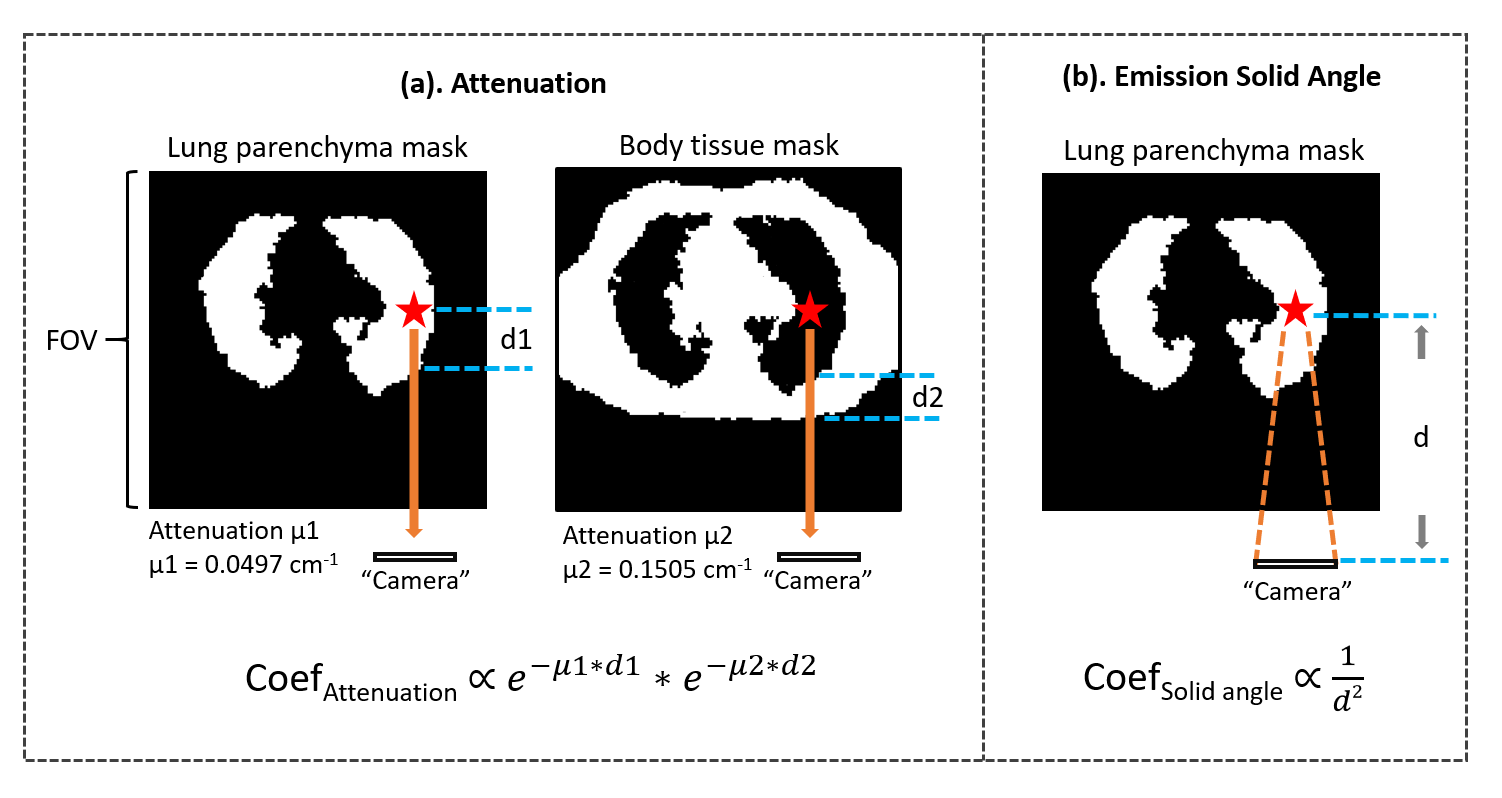
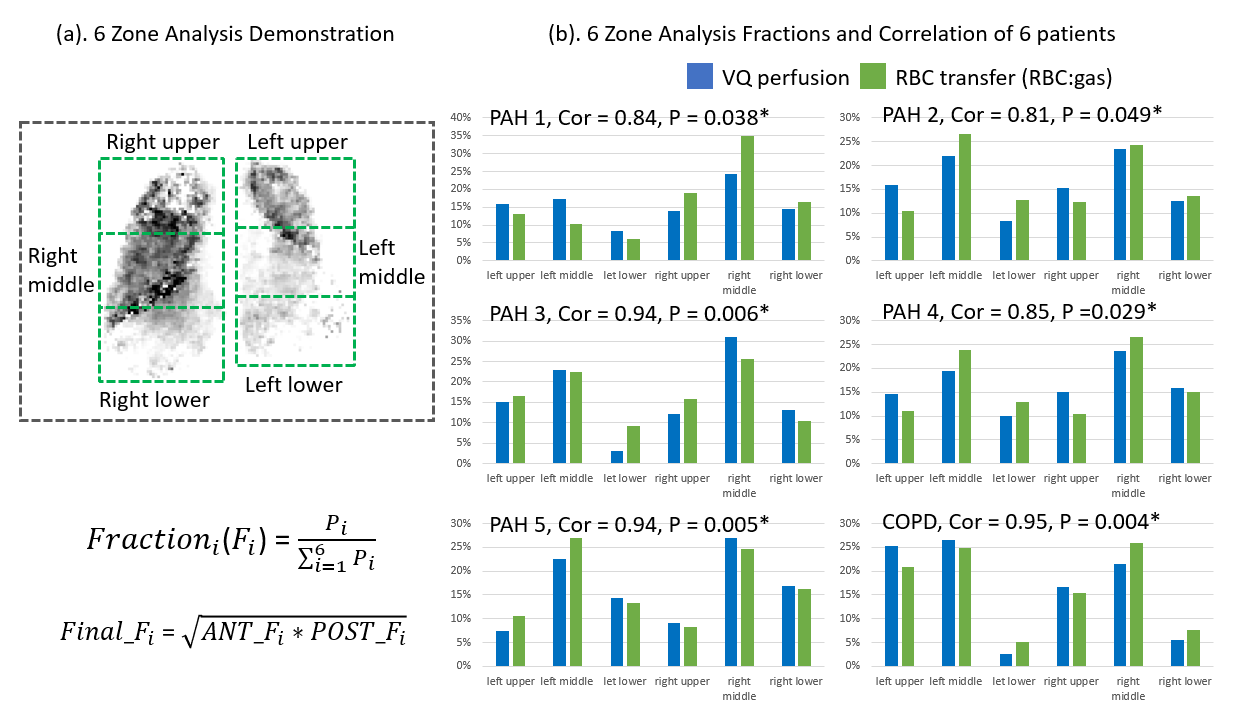
The study enrolled 4 patients with type-1 PAH, one type-4 patient with chronic thromboembolic disease (CTEPH) and one patient with COPD. All had a routine 99mTc perfusion scan (140keV). All underwent 129Xe gas exchange MRI after inhaling a dose of ~110ml 129Xe on a 3T SIEMENS MAGNETOM Trio. The acquisition used an interleaved 1-point Dixon method as described previously to decompose the images of the 3 compartments. 1 Briefly, the dissolved- and gas-phase 129Xe signals were alternately encoded using a 0.69ms, 1-lobe sinc pulse, flip-angles = 0.5/20°, TR/TE = 7.5ms/TE90, FOV = 36cm3, 1000 views with 64 points, and bandwidth = 399Hz/sample. The 3D RBC image was then divided by the gas-phase image to calculate RBC transfer. To depict RBC transfer in the same format as 99mTc perfusion scintigraphy, the standard 8 projections were produced as follows: we emulated attenuation from lung parenchyma and body tissue as well as distance-dependent emission solid angle that affects scintigraphy. Each pixel was then weight for the 2 effects according to its position relative to the chest walls, using a registered proton MRI (Figure 1). The resulting projections were qualitatively compared between the two modalities. They were also compared quantitatively with the clinical 6-zone analysis to derive the relative function contributed by each zone on a coronal projection (Figure 4(a)). 6 For perfusion scintigraphy, this projection was the geometric mean of the coronal and anterior views. For RBC transfer it was the mean of the original 3D volume. For each modality, the lungs were manually divided into 6 zones and its relative functional fraction was calculated by the sum of pixel intensities relative to the whole lung. For each patient the Pearson correlation coefficient was calculated for the 6 zones, and P-values were generated to test the null hypothesis of no correlation (P<0.05 significant).RESULTS
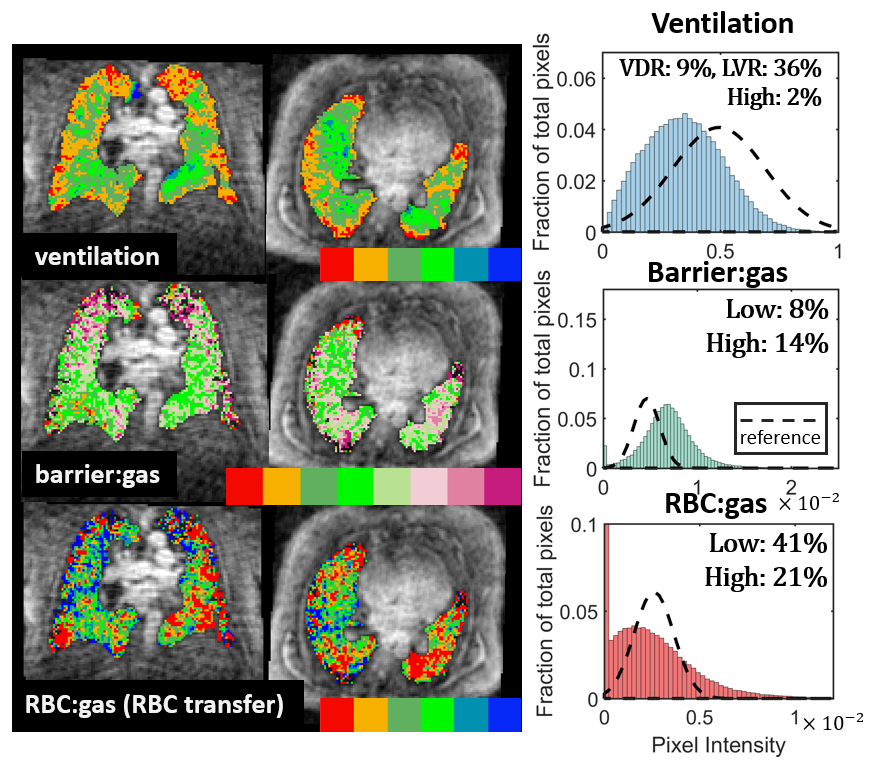
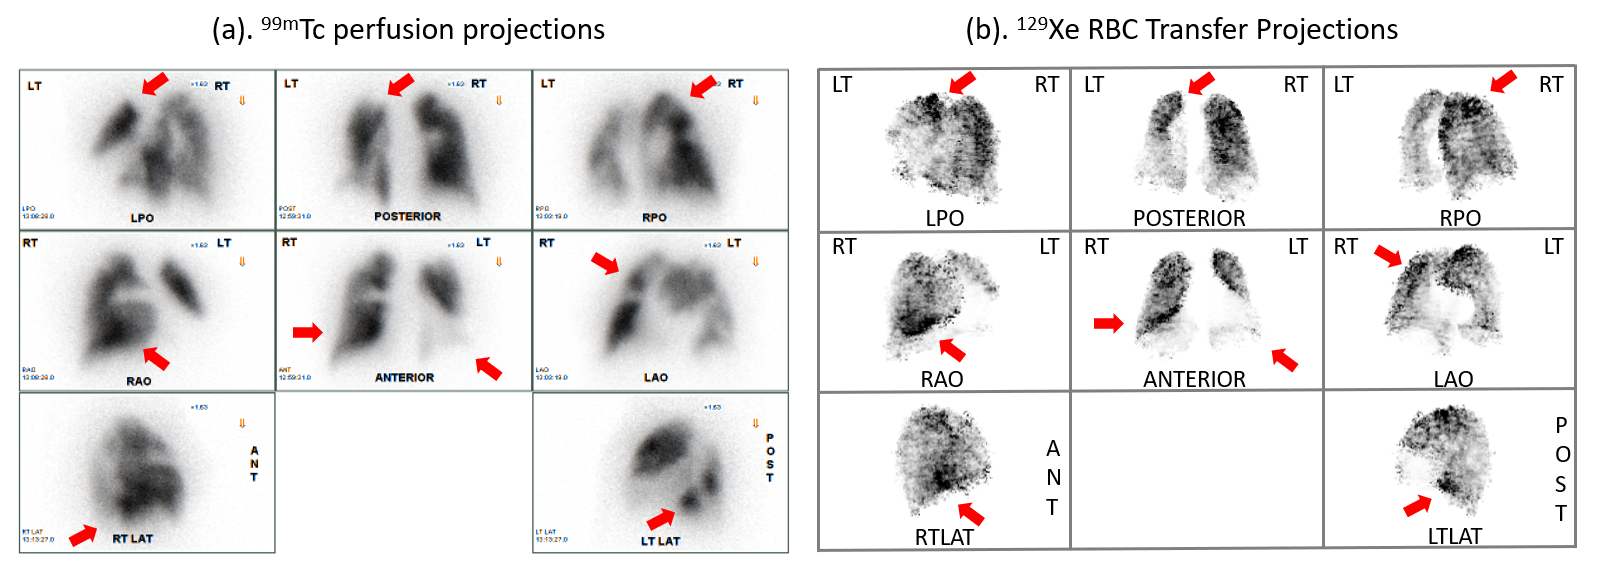
Figure 2 shows the 129Xe gas exchange images from the CTEPH patient, processed as previously described. 2 For this patient, Figure 3 compares the perfusion scintigraphy and RBC transfer projections. Note the RBC projections are intensity-reversed to match the scintigraphy display format. Qualitatively, both modalities delineate regions of high and low intensity in similar ways (red arrows). Figure 4(b) shows the 6-zone analysis. Each patient showed a significant correlation, ranging from 0.81 to 0.95.DISCUSSION
Perfusion scintigraphy is routinely used to evaluate patients with pulmonary vascular disease as well as COPD patients (for transplant). This provided a unique opportunity to conduct initial validation of RBC transfer imaging using an accepted imaging standard. This was done on a quantitative and spatially resolved basis by using the clinical 6-zone analysis that is routinely used to plan surgical procedures. The relatively strong qualitative and quantitative agreement between RBC transfer and scintigraphy in this cohort suggests that in certain patient populations RBC transfer simply reflects capillary-level perfusion. However, it should be noted that the delivery for RBC transfer is by inhalation, not injection, thus defects can also be caused by diffusion limitation, such as in interstitial lung disease. This provides a second unique aspect to 129Xe gas exchange MRI not correlated to conventional perfusion scintigraphy, and must be carefully considered in future studies. Moreover, the higher resolution of 129Xe MRI provides opportunities for clear 3D isotropic visualization that may ultimately allow for more sophisticated surgical planning. In summary, we demonstrated a workflow that enables 129Xe MRI derived RBC transfer images to be compared to 99mTc perfusion scintigraphy, qualitatively and quantitatively, as a step towards validating this unique method.Acknowledgements
R01HL126771, R01HL105643, HHSN268201700001C, P41 EB015897References
- Kaushik, S.S., et al., Single-breath clinical imaging of hyperpolarized (129)Xe in the airspaces, barrier, and red blood cells using an interleaved 3D radial 1-point Dixon acquisition. Magn Reson Med, 2016. 75(4): p. 1434-43.
- Wang, Z., et al., Quantitative analysis of hyperpolarized 129 Xe gas transfer MRI. Med Phys, 2017. 44(6): p. 2415-2428.
- Wang, J.M., et al., Using hyperpolarized 129Xe MRI to quantify regional gas transfer in idiopathic pulmonary fibrosis. Thorax, 2017.
- Kaushik, S.S., et al., Measuring diffusion limitation with a perfusion-limited gas--hyperpolarized 129Xe gas-transfer spectroscopy in patients with idiopathic pulmonary fibrosis. J Appl Physiol (1985), 2014. 117(6): p. 577-85.
- Barst, R.J., et al., Diagnosis and differential assessment of pulmonary arterial hypertension. J Am Coll Cardiol, 2004. 43(12 Suppl S): p. 40S-47S.
- Ball, W.C., Jr., et al., Regional pulmonary function studied with xenon 133. J Clin Invest, 1962. 41: p. 519-31.
- International Commission on Radiation Units and Measurements., Tissue substitutes in radiation dosimetry and measurement. ICRU report. 1989, Bethesda, Md., U.S.A.: International Commission on Radiation Units and Measurements. vii, 189 p.
Figures
Figure
1. Corrections applied to
enable 129Xe RBC transfer to be compared to 99mTc
scintigraphy, using a 1H thoracic cavity scan. (a). Correction of attenuation from
lung parenchyma and body tissue. The mass attenuation coefficients (µ) were from ICRU Report 44 (1989), 7 which recommended 0.33 g/cm3
to estimate lung parenchyma, and 1 g/cm3 for body tissue. (b). Correction
for emission solid angle. The coefficient was calculated using the square of
the inverse distance to the hypothetical camera, which was set to be 20cm from
patient skin surface. The 2 coefficients were then multiplied to weight each
pixel in projection.
Figure
2. Representative 129Xe MRI gas exchange images from a patient
with chronic thromboembolic pulmonary hypertension (CTEPH) prior to
endarterectomy. This patient had overall decreased ventilation, slightly
increased barrier uptake and diminished RBC transfer.
Figure
3. Comparison of standard anterior/posterior and lateral projections between 99mTc
Perfusion and 129Xe RBC transfer MRI. (a). Representative 99mTc
perfusion scan from the CTEPH patient. (b). The RBC transfer projections for
this patient were intensity-reversed, and the window/level was adjusted to match
the standard display. This qualitative comparison shows excellent
correspondence with regions depicting matching high/low intensities between the
modalities, indicated by red arrows.
Figure
4. (a). 6 zones of equal size were placed individually for both lobes to cover
the thoracic cavity. The functional fraction for each zone was calculated as
illustrated from the coronal projection. For perfusion scintigraphy, this
projection is calculated by the geometric mean of the anterior and posterior
projections. For RBC transfer, this projection was simply generated from the
mean of the 3D volume without corrections. (b). 6-zone analysis results of the
6 patients. Pearson correlation coefficient and the P-value between the 2
modalities were calculated for all patients.