0968
Measurements of human brown adipose tissue temperature during cold exposure by hyperpolarized xenon MR thermometry1Physics and Astronomy, University of North Carolina at Chapel Hill, Chapel Hill, NC, United States, 2Biomedical Research Imaging Center, University of North Carolina at Chapel Hill, Chapel Hill, NC, United States, 3Applied Physical Sciences, University of North Carolina at Chapel Hill, Chapel Hill, NC, United States, 4Dept of Emergency Medicine, Exercise and Sports Science, University of North Carolina school of medicine, Chapel Hill, NC, United States
Synopsis
While temperature measurement represents the most direct way to measure BAT thermogenic function, temperature measurements by proton-based MR methods are confounded by magnetic susceptibility effects, which cannot be corrected for at the microscopic level. Here we report our first measurements of absolute BAT temperature in adult humans during cold exposure by hyperpolarized xenon gas MRI. These measurements represent the most direct way to measure thermogenic function in BAT.
Introduction
Temperature measurements represent the most direct way to assess thermogenic function of brown adipose tissue (BAT)[1], yet, accurate and non-invasive temperature measurements of human BAT are extremely challenging. Infrared thermometry of BAT is performed indirectly through measurements of changes in skin temperature, which are negatively correlated with subcutaneous fat thickness[3]. On the other hand, current MR thermometry methods can only measure relative temperature changes and either require a prior knowledge of the temperature sensitivity of the MR parameters studied or, as in the case of proton-resonance frequency shift based methods, measurements are strongly confounded by susceptibility-induced frequency shifts[4,5].
Recently it was shown that the resonance frequency of lipid-dissolved xenon (LDX) shifts linearly with temperature (-0.2 ppm/°C) and that this temperature dependence could be used to obtain relative and absolute temperature information in fat tissues[6], including BAT[7]. Specifically, absolute temperature information was achieved by referencing the LDX resonance frequency to that of nearby methylene protons in which LDX dissolves, enabling the removal of both macro- and microscopic field in-homogeneities[6]. Here, we demonstrate application of this method in humans, where methylene-referenced LDX thermometry (rLDX) is used to measure absolute temperature of human BAT during cold exposure.
Methods
An rLDX frequency-temperature calibration was first performed in vitro at 11.7T by using several samples of excised rat adipose tissue and human adipose tissue, and then tested in vivo in mice. This temperature calibration was then used in vivo to directly measure absolute BAT temperature during cold exposure.
For human BAT temperature studies, a total of 4 subjects were enrolled. Temperature measurements were performed on a 3T-Prisma Siemens System by using a 129Xe surface coil located above the supraclavicular area. Anatomical images as well as 129Xe spectra and images were acquired both at thermoneutrality and during mild cold exposure, achieved by using MR-compatible, water-perfused cooling pads strapped around the upper torso and the upper legs of each participant. Hyperpolarized xenon and 1H spectra were acquired sequentially, after a localized shimming procedure of a < 30 cm3 voxel located in the supraclavicular fat pad, during a breath-hold of a 600 ml bag of isotopically enriched xenon (∼86% 129Xe), polarized up to 14% by using a commercial polarizer. From the measured LDX and methylene 1H resonance frequencies, a rLDX frequency was obtained, from which absolute temperature was calculated using the frequency-temperature calibration found in vitro and tested in mice. Less than 24 hours from the 129Xe/1H MRI imaging scan, subjects underwent a 18F-FDG-PET/1H MRI scan performed on a Biograph mMR hybrid MRI/PET Siemens system. For this study, subjects were exposed to mild cold for 1 hour before the injection of 18500 MBq of 18F-FDG, and for 60 minutes before the acquisition of PET images.
Results
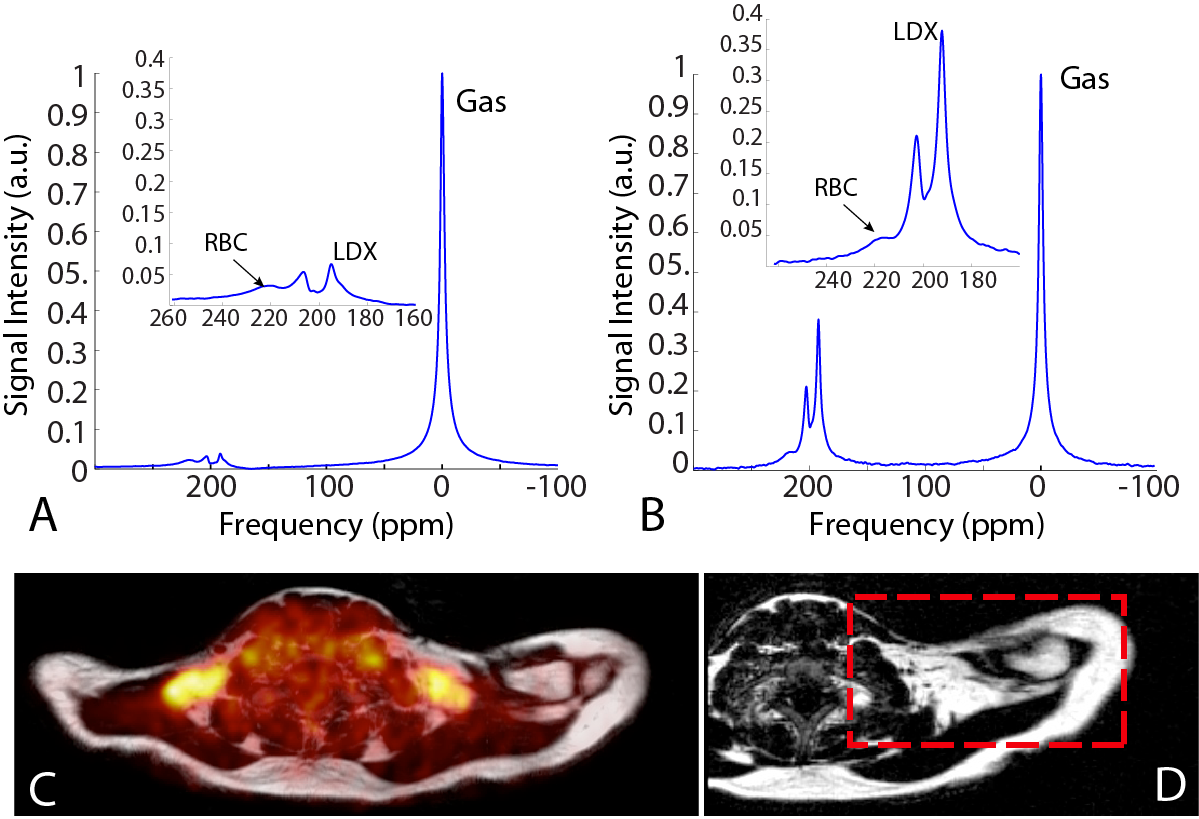
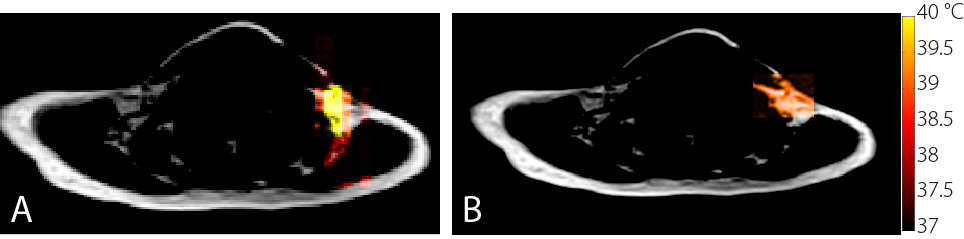
Figure 1 shows representative hyperpolarized xenon (HPXe) spectra acquired before (A) and during (B) cold exposure in one of the participants, along with 18F-FDG-PET maps overlay on a fat MR image acquired from the same regions, showing glucose avid BAT. These spectra clearly show a strong increase in tissue blood flow (increase in RBC peak intensity) and increased xenon uptake in BAT (increase in LDX peak intensity). When the LDX resonance frequency was measured in conjunction with the 1H methylene resonance frequency from the same region, an average BAT temperature of 37.9 +/- 1.6°C was measured across all participants analyzed. Figure 2 shows an rLDX temperature map acquired on a different subject during cold exposure using the same method, along with a HPXe BAT map of the same tissue. On these subjects, an average BAT temperature of 39.2 +/- 0.5°C was measured across the supraclavicular area during cold exposure.Discussion and Conclusions
It has been shown that, by using the temperature-insensitive resonance frequency of methylene protons as internal reference for the temperature-sensitive chemical shift of LDX, one can correct for field drift, macro- and microscopic susceptibility gradients to obtain absolute temperature information. In rodents, this method was used to provide very accurate relative[7] and absolute temperature information[6]. Here we show that, in humans, by using a methylene-LDX chemical shift temperature calibration found in vitro in excised human fat samples, we were able to measure absolute BAT temperature. The average BAT temperature during cold exposure was 37.9 +/- 1.6°C, significantly higher than surface skin temperature during cold exposure or core body temperature at thermoneutrality.
This study demonstrates the feasibility of HPXe absolute MR thermometry in human BAT and provides the first direct evidence of BAT thermogenesis in adult humans. In addition to temperature, HPXe spectra provide direct evidence of the increase in BAT blood flow expected during stimulation of thermogenesis and measured so far only by O-15 PET scans.
Acknowledgements
This work was supported by the National Institute of Diabetes and Digestive and Kidney Diseases through grant number R01DK108231.References
1. Nedergaard, J. & Cannon, B. The Changed Metabolic World with Human Brown Adipose Tissue: Therapeutic Visions. Cell Metab. 11, 268–272 (2010).
2. Cypess, A. M., Haft, C. R., Laughlin, M. R. & Hu, H. H. Brown fat in humans: consensus points and experimental guidelines. Cell Metab. 20, 408–15 (2014).
3. Gatidis, S. et al. Is It Possible to Detect Activated Brown Adipose Tissue in Humans Using Single-Time-Point Infrared Thermography under Thermoneutral Conditions? Impact of BMI and Subcutaneous Adipose Tissue Thickness. PLoS One 11, e0151152 (2016).
4. Baron, P. et al. Influence of water and fat heterogeneity on fat-referenced MR thermometry. Magn. Reson. Med. 75, 1187–1197 (2016).
5. Sprinkhuizen, S. M. et al. Temperature-induced tissue susceptibility changes lead to significant temperature errors in PRFS-based MR thermometry during thermal interventions. Magn. Reson. Med. 64, 1360–1372 (2010).
6. Zhang, L. et al. Accurate MR thermometry by hyperpolarized 129Xe. Magnetic Resonance in Medicine (2016). doi:10.1002/mrm.26506
7. Branca, R. T. et al. Detection of brown adipose tissue and thermogenic activity in mice by hyperpolarized xenon MRI. Proc Natl Acad Sci U S A (2014). doi:10.1073/pnas.1403697111
Figures