0965
Emphysema Index based on Hyperpolarized He-3 and Xe-129 ADCSina Tafti1, William J Garrison2, John P Mugler2,3, Y Michael Shim4, Talissa A Altes3,5, Jaime F Mata3, Nicholas J Tustison3, Kun Qing3, Eduard E de Lange3, Gordon D Cates1,3, and G Wilson Miller2,3
1Physics, University of Virginia, Charlottesville, VA, United States, 2Biomedical Engineering, University of Virginia, Charlottesville, VA, United States, 3Radiology and Medical Imaging, University of Virginia, Charlottesville, VA, United States, 4Medicine, University of Virginia, Charlottesville, VA, United States, 5Radiology, University of Missouri, Columbia, MO, United States
Synopsis
Emphysema index (EI) based on CT provides a quantitative measure of emphysema burden in patients with chronic obstructive pulmonary disease (COPD). Diffusion-weighted MRI of inhaled hyperpolarized gases also provides a method for detecting emphysema, as elevated ADC values indicate airspace enlargement due to emphysematous destruction of alveolar walls. We propose an alternative formulation of EI based on He-3 or Xe-129 ADC measurements and compare their performance in characterizing emphysema severity with that of CT-EI. Our results suggest that ADC-EI may provide a useful quantitative measure of emphysema burden in patients with COPD that is more sensitive to early stages of emphysema than CT-EI.
Introduction
Apparent diffusion coefficient (ADC) values obtained from diffusion-weighted MRI of inhaled hyperpolarized gases provide a relative measure of alveolar size in the lung. In patients with chronic obstructive pulmonary disease (COPD), elevated ADC values indicate airspace enlargement due to emphysematous destruction of alveolar walls. Although this connection has been demonstrated in numerous research studies, computed tomography (CT) remains the gold standard for image-based characterization of emphysema. Emphysema index (EI) based on CT Hounsfield units provides a quantitative measure of emphysema burden over the entire lung1. Inspired by the usefulness of CT-EI, we propose herein an alternative formulation of EI based on He-3 or Xe-129 ADC measurements and compare their performance in characterizing emphysema severity with that of CT-EI.Methods
9 healthy volunteers and 20 COPD patients (8 GOLD stage I, 7 stage II, and 5 stage III) aged 45-70 were given CT along with He-3 and Xe-129 diffusion-weighted MRI exams, all performed at one-third of forced vital capacity (FVC) as determined by spirometry. Each subject inhaled a bag containing nitrogen for the CT scan and a mixture of nitrogen and either 400 ml of hyperpolarized He-3 or 1 L of hyperpolarized Xe-129 for the diffusion-weighted MRI scans. He-3 was polarized to ~60% using a homebuilt system and Xe-129 was polarized to ~30% using a commercial prototype system (XeBox-10, Xemed LLC). The CT scans were acquired using a Siemens SOMATOM Definition Flash scanner at 0.9 × 0.9 × 0.7 mm voxel resolution. MRI was performed on a separate day using a 1.5 T whole-body scanner (Siemens Avanto) and vest-shaped RF coil (Clinical MR Solutions). For the hyperpolarized-gas images, five 4 cm-thick transverse slices separated by 8-mm gaps were acquired using a spoiled gradient-echo pulse sequence equipped with bipolar diffusion-sensitizing gradients. To produce the ADC maps, b values of 1.6 and 12.5 cm2/s were applied for He-3 and Xe-129, respectively. In both cases the upper edge of the topmost slice was positioned at the apex of the lung. Pulse sequence parameters included: TR = 11 ms, TE = 6.8 ms, pixel bandwidth = 200 Hz/pixel, and matrix size = 36 × 64. CT-EI was defined as the fraction of lung voxels with attenuation coefficient of less than −950 Hounsfield units. For He-3 and Xe-129 ADC, we defined EI to be the fraction of lung voxels with ADC values greater than 0.30 and 0.048 cm2/s, respectively. These thresholds correspond to the 95th percentiles of all voxel values from healthy subjects for the corresponding scans as shown in Figure 1. Mean CT-EI and mean ADC-EI were calculated over healthy subjects and those with varying COPD stages, and differences were assessed using independent-samples t-tests.Results
Figure 2 depicts a scatter plot of emphysema indices (EI) based on He-3 vs. Xe-129 ADC, with slope of 0.934 and R2 = 0.969 demonstrating excellent correlation. Scatter plots of CT-EI vs. He-3 and Xe-129 are displayed in Figure 3. The separation between healthy subjects and those with COPD based on ADC-EI is more pronounced than separation based on CT-EI: 36% of COPD subjects fall within the “healthy” range based on CT-EI whereas only 15% fall within the “healthy” range based on He-3 or Xe-129 ADC-EI. This disparity seems to imply that hyperpolarized-gas ADC is sensitive to something that CT is not. The close resemblance between He-3 and Xe-129 ADC maps and comparison with CT is demonstrated in Figure 4 for three different subject types. A plot of mean CT-EI and He-3 and Xe-129 ADC-EI along with their standard errors and p-values is given in Figure 5, broken down by COPD severity. The p-values for ADC-EI (representing the statistical significance of the difference between COPD and healthy groups) are 1-2 orders of magnitude lower than corresponding values for CT-EI. In particular, ADC-EI provides much greater separation between the healthy group and COPD stages I/II.Conclusion
In this study, we propose an alternate method of defining emphysema index (EI) based on hyperpolarized-gas MRI. The self-consistency of our results suggest that EI based on either He-3 or Xe-129 ADC maps might provide a robust quantitative measure of emphysema burden. The greater separation between healthy and COPD groups provided by ADC-EI, particularly in GOLD stages I and II, suggests that hyperpolarized-gas measures of EI may be more sensitive to early emphysematous changes in the alveolar microstructure.Acknowledgements
This work was supported by NIH grant R01 HL105586.References
1. Bae K., Medicine (Baltimore), 2016, 95(48).Figures
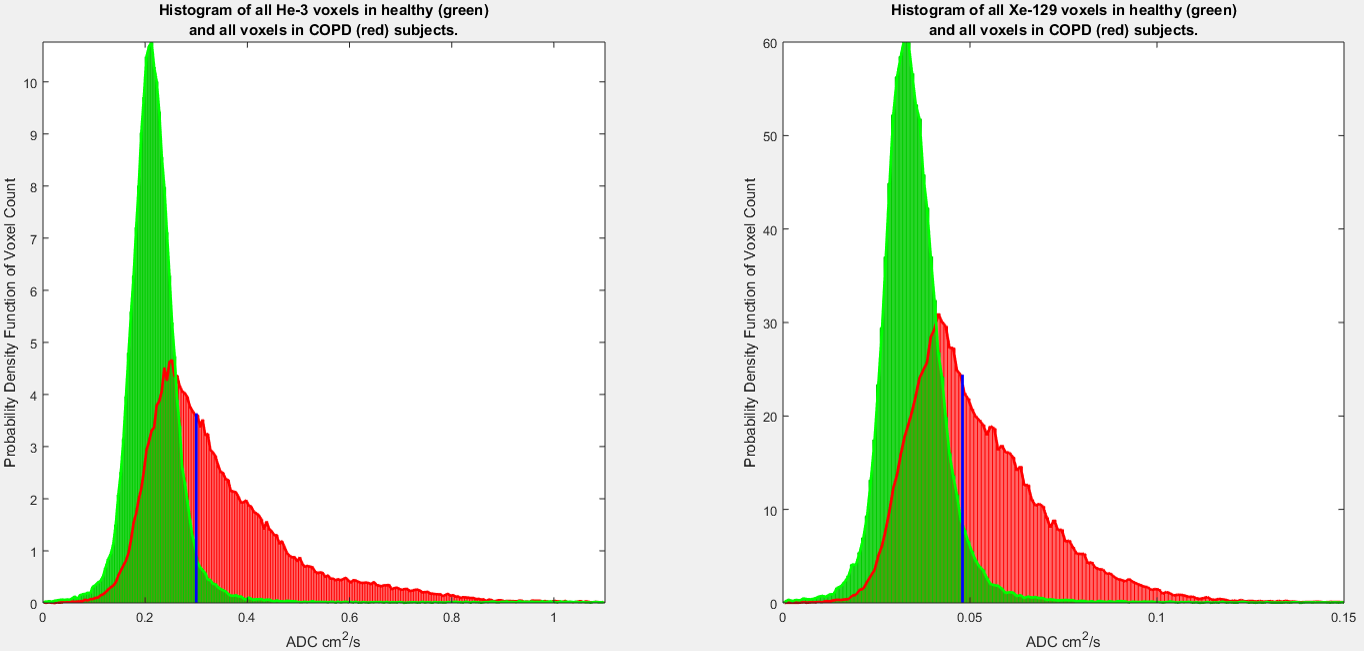
Figure 1. Histograms of
all ADC voxel values from all healthy (green) and all COPD (red, all stages
combined) subjects. The vertical blue lines depict thresholds of 0.30 and 0.048
cm2/s which correspond to the 95th percentile of all voxel values from
healthy subjects. Both sets of distributions are self-normalized and have equal
areas.
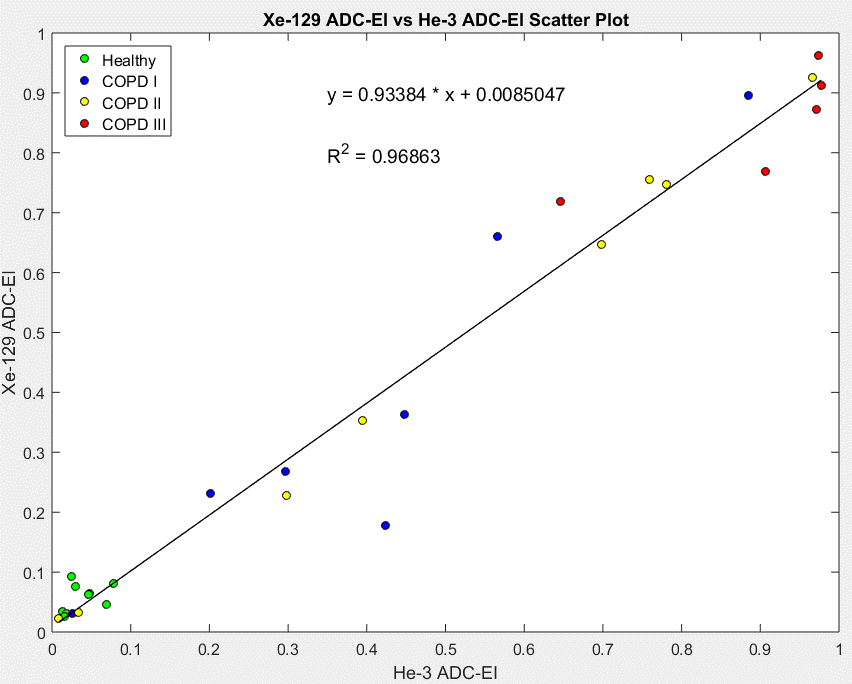
Figure 2. Scatter plot of
He-3 versus Xe-129 ADC-EI showing excellent correlation. The variance among subjects
within each COPD stage is noticeably higher than that of the healthy group,
which leads to larger error bars in Figure 5.

Figure 3. Scatter plots
of CT-EI versus both He-3 and Xe-129 ADC-EI. Numbers 1-4 label the quadrants
defined by vertical and horizontal lines at the data point with highest ADC-EI for
healthy subjects. Thus quadrant 1 spans the apparently “healthy” ranges.

Figure 4. The first row
depicts axial views of healthy lungs, having uniform and homogenous CT tissue
distribution and ADC maps. The second row depicts a subject with severe
emphysema. Elevated ADC values can be seen to correspond to dark regions in CT;
this is an example of both CT and ADC characterizing emphysema in a similar
manner. The bottom row shows relatively homogenous and uniform tissue
distribution in CT, but elevated ADC values for both He-3 and Xe-129. This is a
COPD stage III subject with high ADC-EI (0.65 for He-3 and 0.72 for Xe-129) but low
CT-EI (0.013).

Figure 5. From left to
right: mean CT-EI and He-3 and Xe-129 ADC-EI values with their associated
standard errors of the mean, broken down by COPD severity. The p-value
next to each data point corresponds to the t-test performed between that
category of COPD (shown by color) and the healthy group. Notice the enhanced
separation between healthy and COPD stage I, and healthy and COPD stage II distributions in
the case of mean ADC-EI as compared to CT-EI.