0963
Spectroscopic Imaging of Dissolved-phase 129Xe in the Lungs Using a 3-Resonance Model1Department of Medical Physics, University of Wisconsin, Madison, Madison, WI, United States, 2Department of Radiology, Duke University Medical Center, Durham, NC, United States, 3Department of Biomedical Engineering, Duke University, Durham, NC, United States
Synopsis
Spectroscopic imaging of the hyperpolarized xenon-129 dissolved in the pulmonary tissues and blood can probe regional gas exchange within the lung. Recent work in whole lung spectroscopy has identified a new, third resonance in the dissolved-phase spectrum. In this work, we develop an iterative, model based reconstruction to separately image the three dissolved-phase components. Regional maps of the three dissolved-phase components are compared in healthy subjects and patients with idiopathic pulmonary fibrosis.
Introduction
Hyperpolarized (HP) xenon-129 has been used to probe gas exchange in the lung through imaging and spectroscopy of 129Xe dissolved into the lung tissues and bloodstream [1]. Due to its large electron cloud, the chemical shift of 129Xe is sensitive to its molecular environment. This has been exploited previously to separate spectral components of the dissolved 129Xe into red blood cell (RBC) and barrier tissue compartments [2,3].
Recent work has identified a possible additional resonance of the 129Xe dissolved-phase observed in global lung spectroscopy [4]. The proposed three dissolved-phase resonances are identified as RBC (217 ppm), Barrier 1 (201 ppm), and Barrier 2 (196 ppm). It is hypothesized that Barrier 1 comprises the parenchymal tissues near the air-tissue interface, while Barrier 2 includes the blood plasma and any aqueous inflammation in the lung. In the present study, we confirm the observation of three dissolved-phase components in global lung spectroscopy and resolve the three compartments regionally utilizing a regularized, model-based reconstruction.
Methods
8 healthy subjects (ages 45-69 years, mean 60, standard deviation 8) and 10 patients with idiopathic pulmonary fibrosis (IPF) (ages 56-77 years, mean 67, standard deviation 6) underwent HP 129Xe MRI.
Image acquisition: Spectroscopy was performed prior to imaging with TR=20ms for 200 repetitions using 200mL of HP 129Xe diluted with 800mL N2. Gas and dissolved-phase MRI was acquired at 1.5T in a single 15s breathhold of 1L of HP 129Xe and a 3D radial sequence with 4 echoes (0.9ms, 2.0ms, 3.1ms, 4.2ms). Transmit and receive frequencies were alternated between the gas and RBC resonances, acquiring the same projection angles in k-space for both [2].
Image reconstruction: Gas and dissolved-phase images were reconstructed directly from the acquired data ($$$y_t$$$) by solving the following optimization problem.
$$\rho_1,...,\rho_n,\psi,w = argmin \sum_t{||s_t(\rho_1,...,\rho_n,\psi,w)-y_t||_2^2 + R(\rho_1,...,\rho_n,\psi,w})$$
Regularization (R) is included with the L2-norm of the spatial finite differences of the spin densities of each species ($$$\rho_i$$$) and B0 field map ($$$\psi$$$) to reduce noise and enforce smoothness, respectively. $$$s_t$$$ is the forward operator, modelling the k-space data as follows:
$$s_t(\rho_1,...\rho_n,\psi,w)=w_{TR} \sum_{i=1}^n{e^{(2\pi if_i-r_{2_i}^*) t} FT[ e^{2\pi i\psi TE}\rho_i ]}$$
where $$$w_{TR}$$$ is a correction factor accounting for the decay of the hyperpolarized longitudinal magnetization with each TR; $$$FT$$$ is the non-uniform Fourier transform; $$$f_i$$$ and $$$r_{2_i}^*$$$ are the off-resonance frequencies and transverse decay rates of each species (estimated from spectroscopy); and $$$TE$$$ are the echo times.
Optimization is done using the CG_Descent algorithm [5]. Reconstruction is first performed for the gas-phase data (a single species; n=1), generating an initial estimate of the B0 map. The dissolved-phase reconstruction problem is initialized using this estimate.
Analysis: The FIDs acquired prior to imaging are processed as in [4]. Images of the dissolved-phase components are normalized to the acquired gas-phase images. The Wilcoxon-Rank-Sum test is used to determine the statistical significance of differences between the healthy and IPF cohorts.
Results
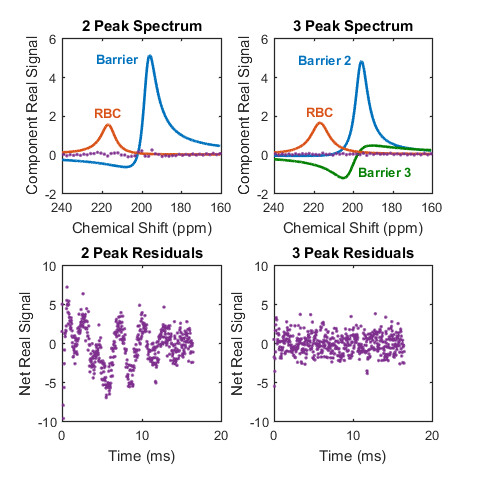
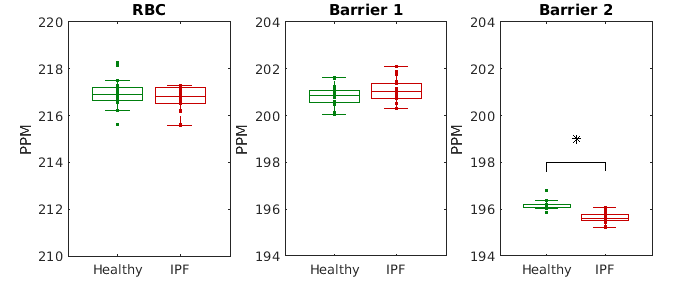
Spectroscopy corroborates the finding of a repeatable third peak shifted by 201 ppm. Figure 1 shows results of the spectral fitting for a healthy subject. In all subjects, there was substantial reduction in the residual error of the spectral fits by including a third resonance – on average, RMS residuals were reduced by 49%. The Barrier 2 peak was significantly shifted upfield (decreased ppm) in IPF patients compared to normal subjects, as seen in Figure 2.
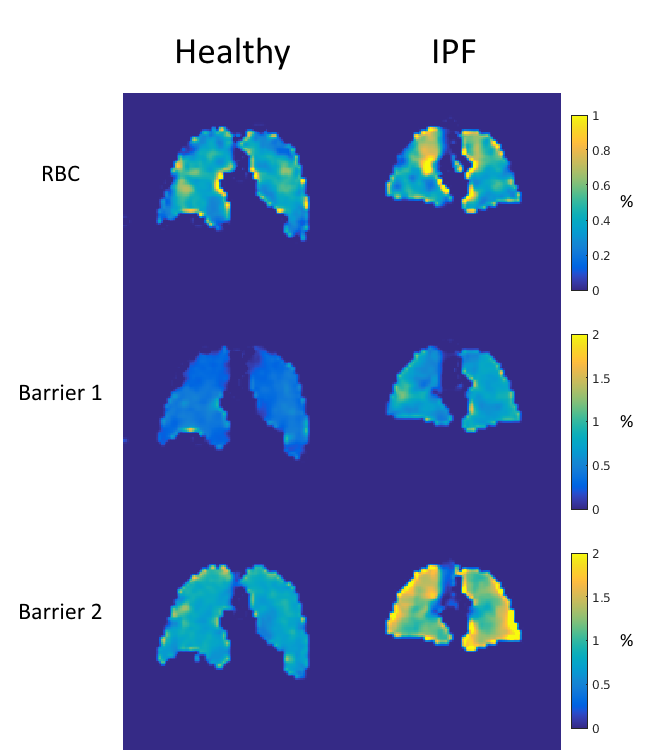
Regional relationships are captured in Figure 3 showing representative maps of the dissolved-phase to gas-phase ratios for a healthy subject and an IPF patient. Barrier 2 signal is increased in the IPF patient, particularly around the periphery of the lung where fibrosis is typically located. Additionally, increased heterogeneity in both the RBC-to-Gas and “Barrier 2”-to-Gas ratio maps is seen in the IPF subject.
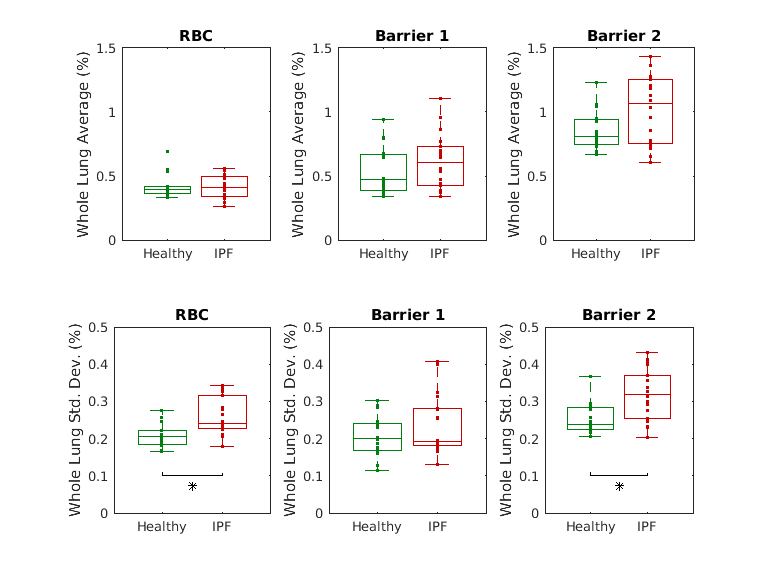
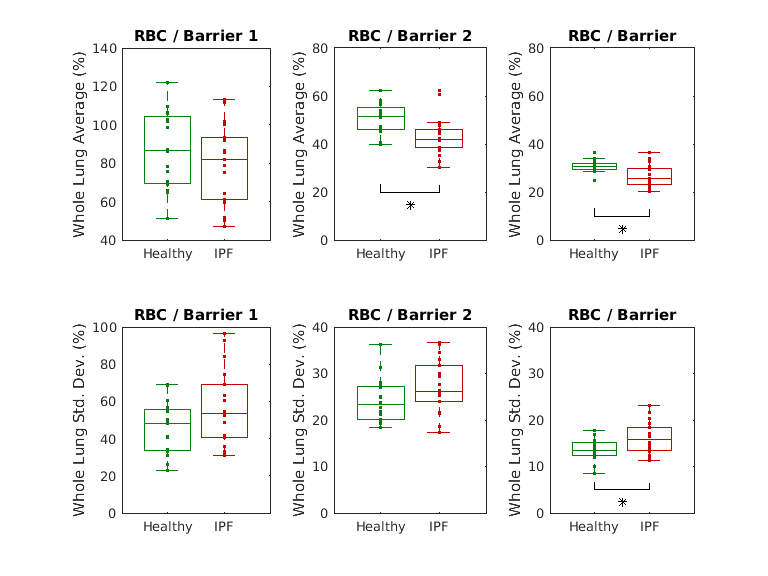
Figures 4 and 5 compare the statistics of these ratio maps across the healthy and IPF cohorts. An increase in the whole lung average “Barrier 2”-to-Gas ratio is seen in IPF patients, though it does not reach statistical significance. A statistically significant increase in the mean RBC-to-“Barrier 2” and RBC-to-“Total Barrier” ratios is observed in IPF patients.
IPF patients exhibited significantly increased heterogeneity (measured by the standard deviation over the lung volume) in the RBC-to-Gas, “Barrier 2”- to-Gas, and RBC-to-“Total Barrier” ratios.
Discussion and Conclusion
The reproducibility of the three component dissolved-phase spectrum across multiple subjects and sites along with the reduction in residuals in global spectroscopic data support the third resonance identified in [4]. Further work is needed to better understand the physiological origin and meaning of the proposed Barrier 1 and Barrier 2 resonances.
In summary, we have demonstrated the ability to spectroscopically image the three components of dissolved-phase HP 129Xe in the lung.
Acknowledgements
The authors would like to acknowledge financial support from NIH/NHLBI R01 Hl126771, NIH/NCRR 1 S10 OD016394 (the Pulmonary Imaging Center), and NIH/NCATS UL1 TR000427 to UW ICTR for funding support.References
- Driehuys B, Cofer GP, Pollaro J, et al (2006) Imaging alveolar-capillary gas transfer using hyperpolarized 129Xe MRI. Proc Natl Acad Sci U S A 103:18278–18283. doi: 10.1073/pnas.0608458103
- Kaushik SS, Robertson SH, Freeman MS, et al (2016) Single-breath clinical imaging of hyperpolarized (129)Xe in the airspaces, barrier, and red blood cells using an interleaved 3D radial 1-point Dixon acquisition. Magn Reson Med 75:1434–1443. doi: 10.1002/mrm.25675
- Qing K, Ruppert K, Jiang Y, et al. Regional Mapping of Gas Uptake by Blood and Tissue in the Human Lung using Hyperpolarized Xenon-129 MRI. Journal of magnetic resonance imaging : JMRI. 2014;39(2):346-359
- Robertson, S. H., Virgincar, R. S., Bier, E. A., He, M., Schrank, G. M., Smigla, R. M., Rackley, C., McAdams, H. P. and Driehuys, B. (2017), Uncovering a third dissolved-phase 129Xe resonance in the human lung: Quantifying spectroscopic features in healthy subjects and patients with idiopathic pulmonary fibrosis. Magn. Reson. Med., 78: 1306–1315.
- William W. Hager and Hongchao Zhang. 2006. Algorithm 851: CG_DESCENT, a conjugate gradient method with guaranteed descent. ACM Trans. Math. Softw. 32, 1 (March 2006), 113-137.
Figures