0962
Grading Brain Tumor Using ADC as a Marker of Cellularity: Fact or FictionZezhong Ye1, Joshua Lin1, Richard Price2, Jeff Viox1, Michael Wallendorf3, Sonika Dahiya4, Albert H. Kim2, and Sheng-Kwei Song1
1Radiology, Washington University School of Medicine, St. Louis, MO, United States, 2Neurological Surgery, Washington University School of Medicine, St. Louis, MO, United States, 3Biostatistics, Washington University School of Medicine, St. Louis, MO, United States, 4Pathology and Immunology, Washington University School of Medicine, St. Louis, MO, United States
Synopsis
Here we demonstrate that ADC is not a reliable imaging biomarker of tumor cellularity in high grade glioma since ADC does not consistently correlate with histology determined tumor cellularity. In contrast, diffusion MRI Histology (D-Histo) derived restricted isotropic diffusion fraction demonstrated a significantly positive correlation with histology determined cellularity in high grade glioma.
Introduction
Tumor cellularity increases in high grade glioma and has been widely used by pathologists as the key criteria for differentiating higher from lower grade glioma. High cellularity is the most prominent pathology feature in glioblastoma and clinically to be removed during surgical intervention. Diffusion MRI derived ADC is the most widely employed clinical imaging technique to access brain tumor cellularity.1 Specifically, decreased ADC is considered as biomarker of increased cellularity. However, ADC sometimes fails to reflect tumor cellularity as high-grade glioma is always associated with coexisting tumor pathologies such as tumor necrosis, microvascular proliferation, and tumor infiltration. Through the modification of previously developed diffusion basis spectrum imaging,2 we recently developed a novel diffusion MRI histology (D-Histo) to characterize tissue structural changes resulting from various pathologies. For brain tumors, D-Histo derived restricted-isotropic diffusion-tensor fraction (restricted fraction) assesses tumor cellularity. To determine whether ADC or restricted diffusion is the biomarker of tumor cellularity, we examined twenty brain tumor specimens from fourteen patients of high grade glioma undergoing surgical resection.Materials and Methods
Brain tumor specimen: Twenty brain tumor specimens from fourteen patients with high-grade glioma were surgically resected and immediately fixed in 10%. Tissues were embedded in agar gel for MR imaging followed by sectioning for H&E and GFAP staining. Histology slides were digitized using NanoZoomer 2.0-HT System (Hamamatsu, Japan) with a 20× objectives for analyses. MRI scan: specimens were examined using a 4.7T Varian MR scanner and a home-made surface coil. A spin-echo diffusion-weighted sequence with 99 diffusion encoding directions with maximum b-values=3000 s/mm2 was employed to acquire DW images with the following imaging parameters: TR 1500 ms, TE 40 ms, slice thickness 0.5 mm, field-of-view 2.4 × 2.4 cm2, matrix size 96 x 96. Cellularity quantification: High-resolution histology image (H&E and GFAP) was down-sampled to match MRI voxel size (250x250 μm2). Positive staining was identified and the fractions of positive stain area were computed as the ratio between the number of positive staining pixels and the total number of pixels (272×272) within one down-sampled histology voxel. Cellularity map was then generated based on the fractions from each imaging voxel (Fig. 1F, H). Co-registration: Thin plate spline (TPS) registration was employed with MIPAV (NIH, Bethesda) to warp cellularity maps to the then same orientations to MR images. Statistical analysis: Pearson correlation and random coefficient model were adopted to fit the data from each sample to evaluate the associations between cellularity and its corresponding MRI biomarkers.Results
MR images from one representative case indicated high diffusion-weighted signals (Fig. 1B, arrow) or low ADC values (Fig. 1C) could both lead to false identification of increasing tumor cellularity. D-Histo restricted fraction map (Fig. 1D) characterized the isotropic restricted water diffusion signals from cancer cells, which precisely delineated the increasing tumor cellularity areas according to H&E (Fig. 1E, outline) and GFAP (Fig. 1G, outline). To achieve voxel-wise correlative analyses, fifty imaging voxels were randomly selected from the down-sampled histology image (Fig. 2A, red squares) and applied to the co-registered cellularity map (Fig. 2B) and MRI-derived maps (Fig. 2C, D). Random coefficient model was adopted to fit the data (Figure 3). Restricted fractions had consistent positive associations with the cellularity derived from both H&E and GFAP (Fig. 3A, C). However, inconsistent associations including positive associations, no associations and negative associations between ADC and cellularity were found (Fig. 3B, D). Pearson correlation on each sample was performed and correlation coefficients were summarized in table 1. Restricted fraction had significant positive correlations with H&E and GFAP cellularity for all the samples. On the contrary, ADC only had significant negative correlations with H&E cellularity for 7 out of 15 samples and had significant negative correlations with GFAP cellularity for 5 out of total 9 samples. To assess the general performance of imaging biomarkers for tumor cellularity across different samples, we performed Pearson correlation for the selected voxels from all the samples. Again restricted fraction showed strong correlation with H&E cellularity (Fig. 4A, r=0.53, p<0.01) and GFAP cellularity (Fig. 4C, r=0.67, r<0.01). Yet, no correlations were observed between ADC and cellularity (Fig. 4B, D).Discussions and Conclusions
Here we demonstrate ADC was unable to consistently reflect tumor cellularity in high-grade glioma. Highly spatial tumor heterogeneity and complicated tumor micro-environment may attribute to the failure of ADC. The unusual aquaporins (AQP) expression in high-grade glioma leads to faster water exchange in glioma cells, which may counterpart diffusion restriction by high cellularity.3 On the contrary, D-Histo restricted fractions significantly correlate with tumor cellularity, which could be a promising biomarker for high grade glioma.Acknowledgements
This work was supported in part by NIH R01-NS047592, P01-NS059560, U01-EY025500, National Multiple Sclerosis Society (NMSS) RG 4549A4/1, RG-1507-05315 and Department of Defense Idea Award W81XWH-12-1-0457.References
1. Yamasaki F, Kurisu K, Satoh K, et al. Apparent diffusion coefficient of human brain tumors at MR imaging. Radiology. Jun 2005;235(3):985-991. 2. Wang Y, Wang Q, Haldar JP, et al. Quantification of increased cellularity during inflammatory demyelination. Brain : a journal of neurology. Dec 2011;134(Pt 12):3590-3601. 3. Mukherjee A, Wu D, Davis HC, Shapiro MG. Non-invasive imaging using reporter genes altering cellular water permeability. Nature communications. Dec 23 2016;7.Figures
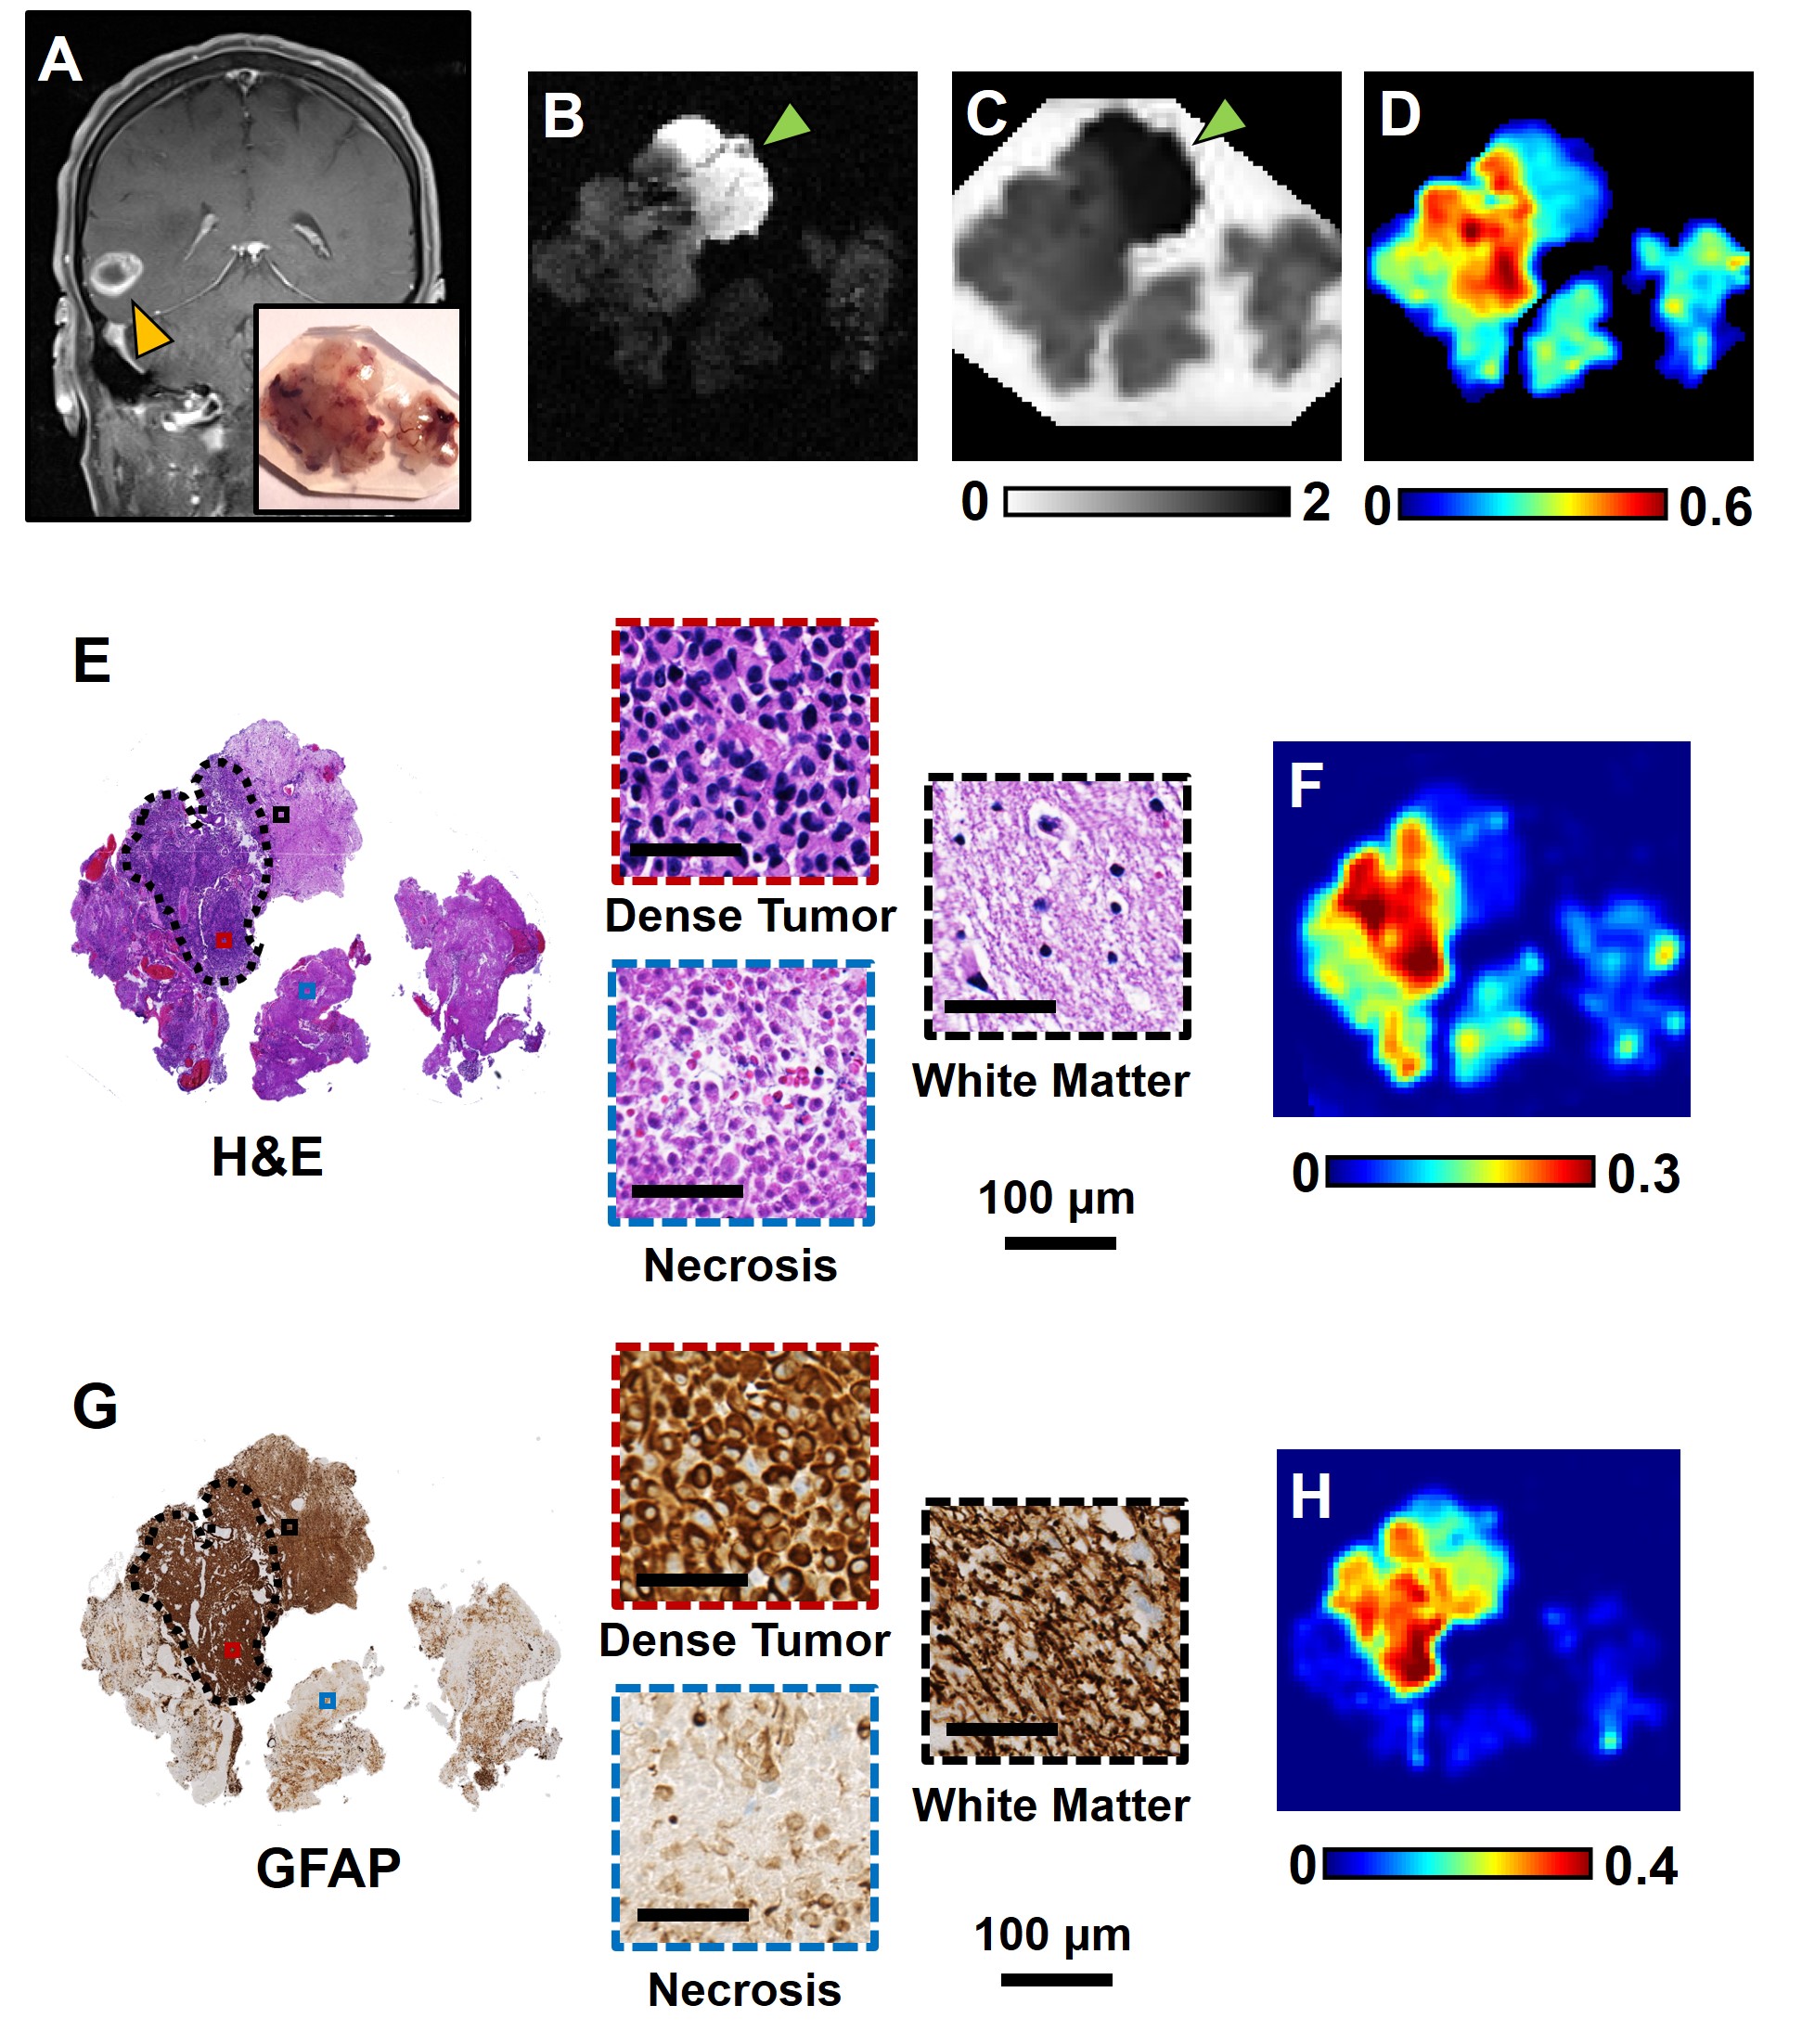
Fig. 1 Brain specimen (A, subset) was surgically resected from a
patient with ependymoma (A). Hyper-intensity in DWI (B) and hypo-intensity in
ADC map (C) appeared to be false-positive identification of increasing tumor
cellularity according to the corresponding H&E (E) and GFAP (G). D-Histo
restricted fraction map correctly reflect the dense tumor region in comparison
to H&E (E, dotted outline) and GFAP (G, dotted outline). Positive
hematoxylin and GFAP stains were quantified to generate cellularity map by
H&E (F) and GFAP (H).
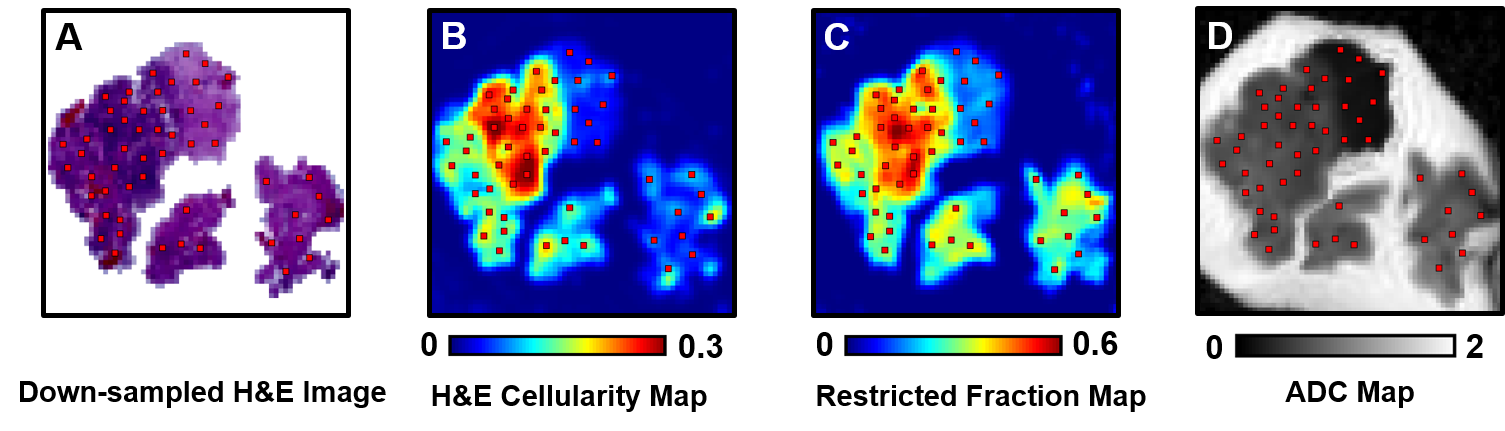
Figure 2. Fifty image voxels were randomly selected
from down-sampled H&E (A) or GFAP (not shown) image. After co-registration,
ROIs were applied to H&E cellularity map (B), GFAP cellularity map (not shown),
restricted fraction map (C) and ADC map (D). Pearson correlation was then performed
to show the correlation between MRI parameters and histology cellularity.
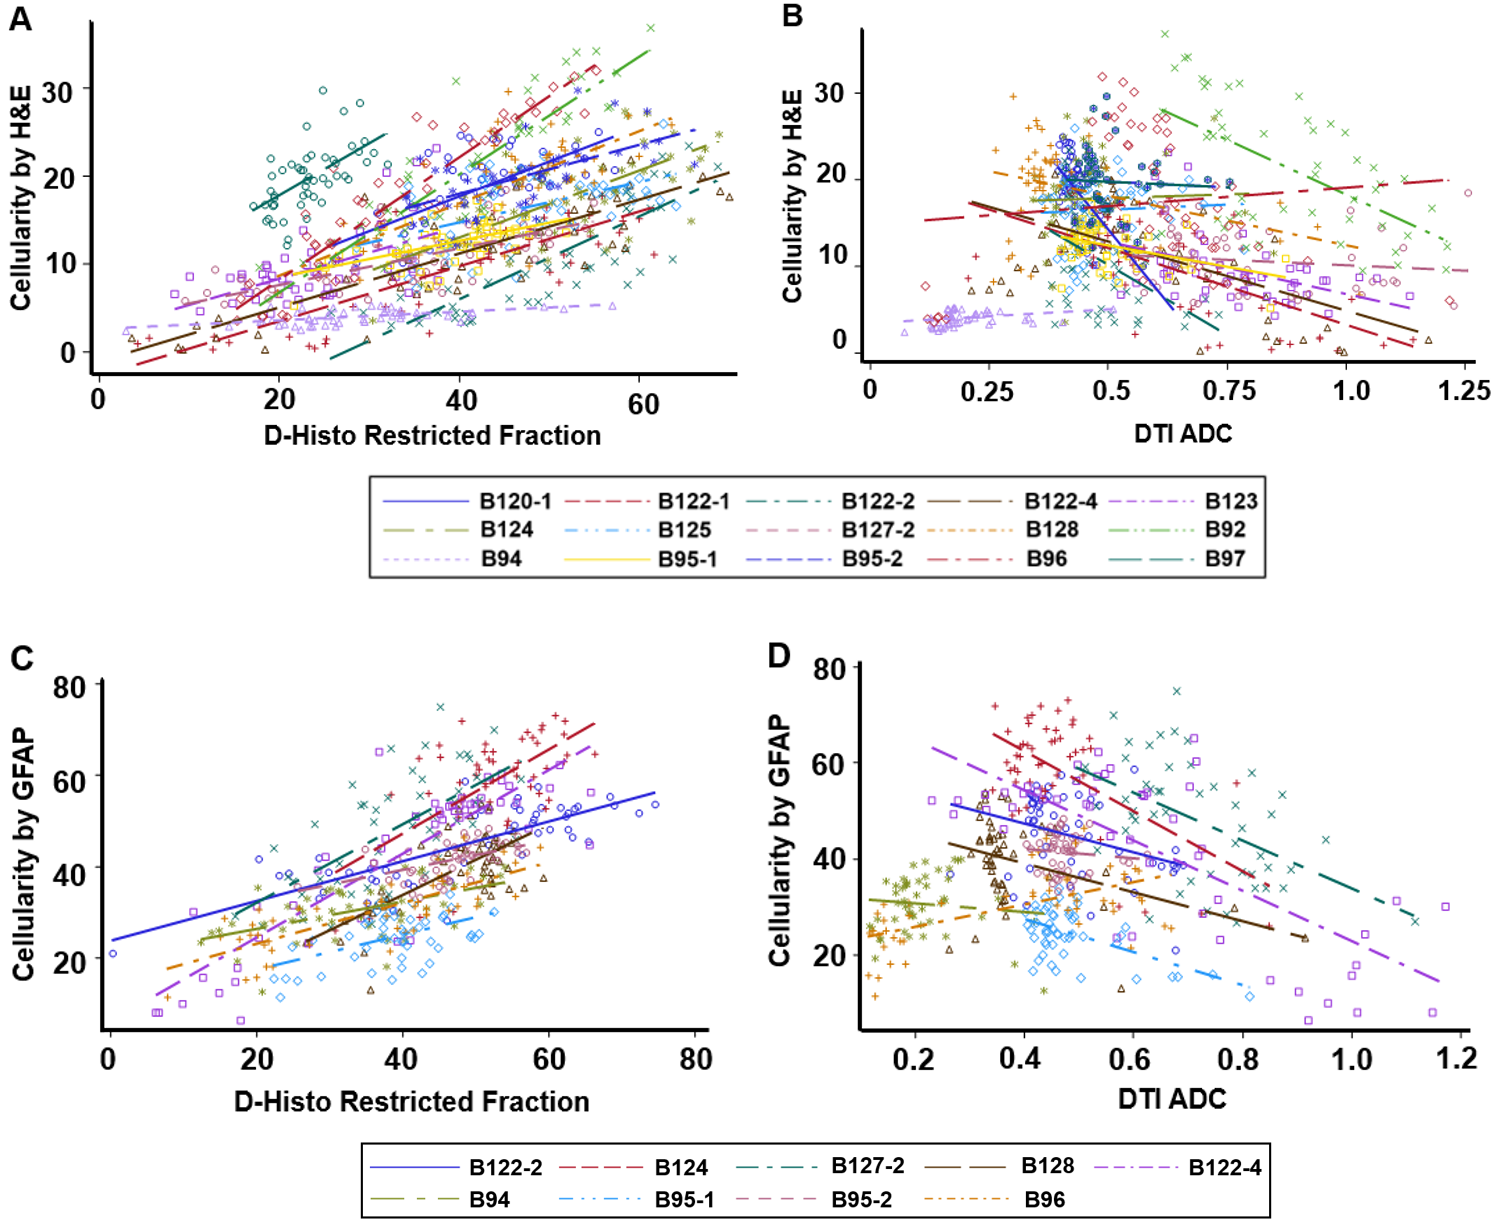
Figure 3. Random coefficient model showed D-Histo restricted fractions from
each sample all positively associated with cellularity derived from H&E and
GFAP (A, C). However, ADC did not consistently have negative associations with
cellularity derived from H&E (B, D).
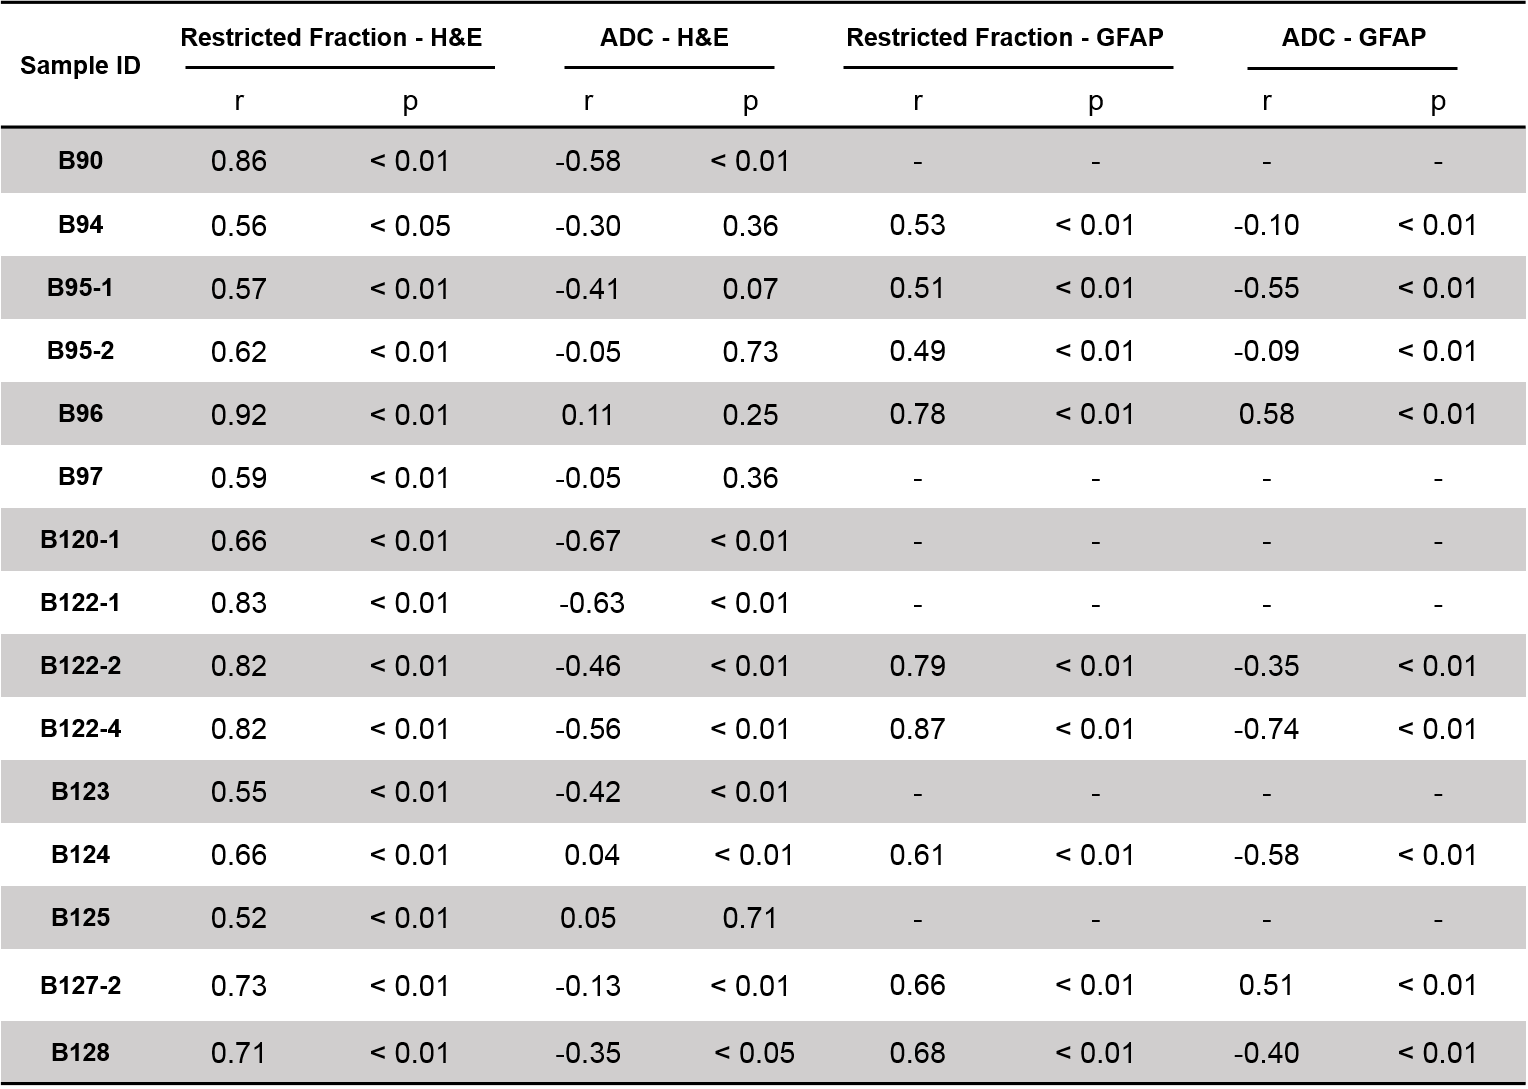
Table 1. Summary of correlation coefficients of
linear regression between MRI (D-Histo restricted fraction, ADC) and
cellularity (H&E, GFAP).
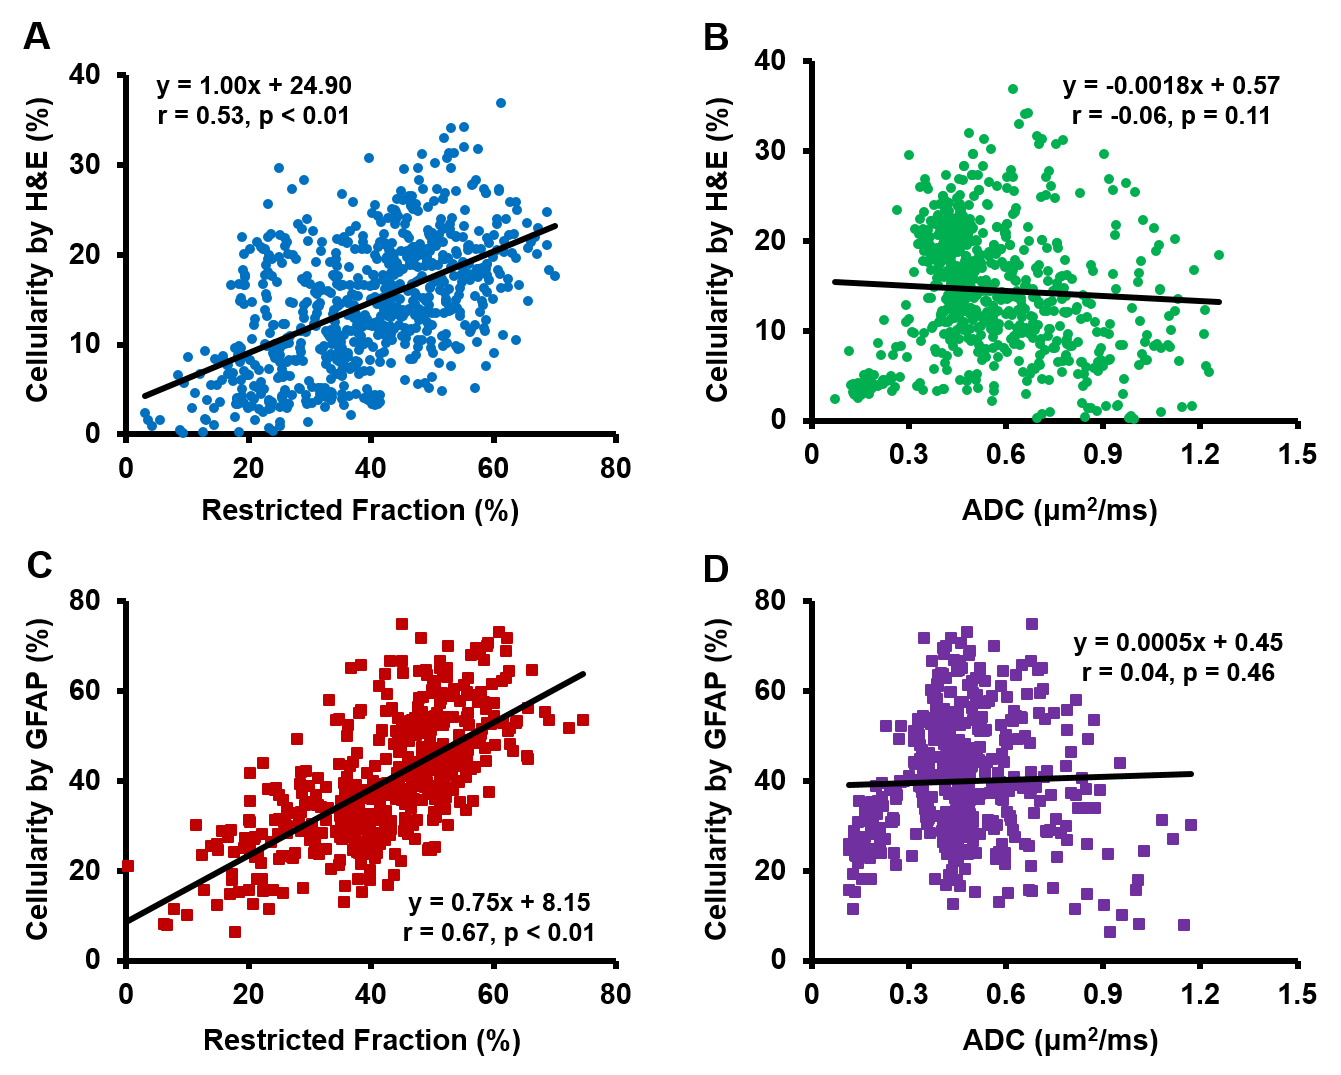
Figure 4. Linear regression between restricted
fraction and cellularity derived from H&E (A) and GFAP (C) showed strong
positive correlation for imaging voxels from all samples. However, no
correlations were found between ADC and cellularity derived from either H&E
(B) or GFAP (D).