0961
Simultaneous pH- and oxygen-weighted metabolic MRI of human gliomas at 3T using multi-echo amine proton chemical exchange saturation transfer spin-and-gradient-echo echoplanar imaging (CEST-SAGE-EPI)1Radiological Sciences, University of California Los Angeles, Los Angeles, CA, United States, 2Neurology, University of California Los Angeles, Los Angeles, CA, United States, 3Neurosurgery, University of California Los Angeles, Los Angeles, CA, United States
Synopsis
Glycolysis is enhanced in cancers, even in the presence of abundant oxygen, leading to accumulation of lactic acid. We present a technique for fast pH- and oxygen-weighted MR imaging using multi-echo amine proton chemical exchange saturation transfer echo spin-and-gradient echoplanar imaging (CEST-SAGE-EPI) on a clinical 3T MRI system. In phantom and human experiments, we investigate the ability to simultaneously measure MTRasym at 3ppm, a measure dependent on pH, and R2’, which is sensitive to oxygen extraction. Results suggest T2 hyperintense tumor is acidic, but not hypoxic; whereas contrast enhancing tumor is acidic and hypoxic, consistent with known cancer biology.
Introduction
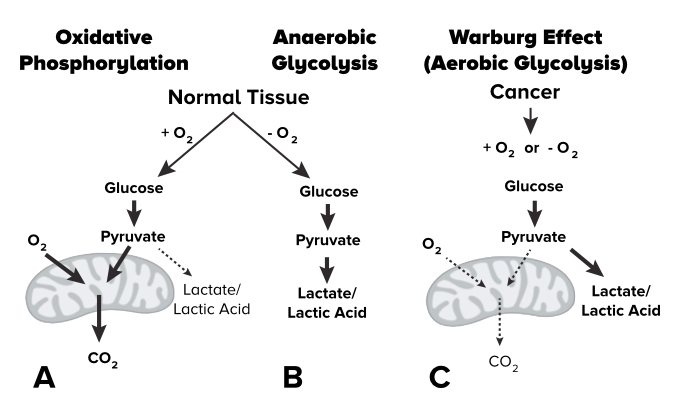
Abnormal metabolism is a hallmark of cancer and triggers a variety of catastrophic biologic events including increased tumor aggressiveness, resistance to treatments, altered gene expression, formation of new blood vessels, and immunosuppression. Glycolysis is often enhanced in cancers, even in the presence of abundant oxygen (i.e. the Warburg effect1, Fig.1). The chemical exchange between amine and amide protons in bulk water has been shown to be pH dependent using CEST imaging2. The elevated concentration of glutamine inherently within tumors further increases the availability of proton exchange and therefore a higher CEST signal at 3.0 ppm3,4. The level of glycolysis depends on both the accumulation of lactic acid as well as the inefficient use of oxygen. Quantitative blood oxygen level dependent (qBOLD) imaging allow for non-invasive estimation of oxygen consumption. R2’, the reversible transverse relaxation rate, has been shown to correlate with oxygen extraction5-8 and has been used to explore oxygen metabolism in brain tumors7,9. In the current study we present a technique for obtaining fast pH- and oxygen-weighted MR imaging contrast using multi-echo amine proton chemical exchange saturation transfer echo spin-and-gradient echoplanar imaging (CEST-SAGE-EPI) on a clinical 3T MRI system.Methods
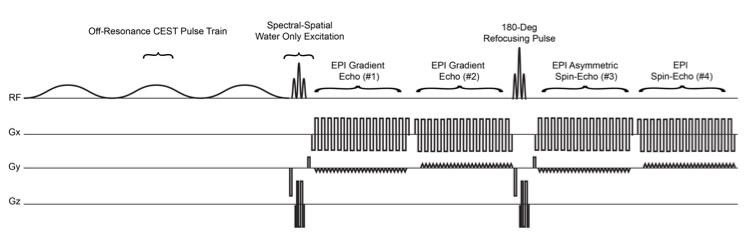
Simultaneous acquisition of pH-sensitive information and relaxometry measures were performed using a CEST-SAGE-EPI sequence (Fig.2). The SAGE EPI readout consisted of two gradient echoes (TE1=14.0ms; TE2=34.1ms), an asymmetric spin echo (TE3=58.0ms), and a spin echo (TE4=92.4ms). All phantom and human CEST-SAGE-EPI data were acquired with a CEST saturation pulse train consisting of three 100-ms Gaussian pulses with amplitude B1=6uT, TR>10,000ms, FOV=240x217, matrix size=128x104, partial Fourier encoding=6/8, GRAPPA=3, bandwidth=1630 Hz/pixel, and 25 contiguous slices with a 4mm slice thickness. 29 z-spectral points was acquired with data around +/- 3.0ppm and 0.0ppm. S0 scans were acquired with NEX=4. Total acquisition time was 7 minutes and 30 seconds on a 3T Siemens Prisma. Acquired CEST-SAGE-EPI data were motion and B0 corrected. An integral of width 0.4 ppm was calculated around -3.0 and +3.0 ppm in corrected data and combined with the S0 image to calculate MTRasym at 3.0 ppm. R2’ was calculated from the SAGE-EPI readout10. Relaxometry measures of R2, R2*, and R2’ were performed using CEST-SAGE-EPI, ME-GRE, and CPMG MR acquisition in a series of 36 glutamine phantoms (100mM) with combinations of varying pH (5.0-7.5) and gadopentetic acid (Gd-DTPA; Magnevist®) concentration (0- 2.0mM) in 50mL falcon tubes. All samples were vortexed and pH was re-evaluated prior to MRI acquisition. All experiments were reapeated twice and compared to Bloch-McConnell simultations. 47 histologically proven glioma patients (WHO IV, N=20; WHO III, N=14; WHO II, N=13) were enrolled in the current study prior to initial surgical resection or at first recurrence. All patients provided informed written consent to have advanced imaging and this information included in our IRB-approved research database.Results
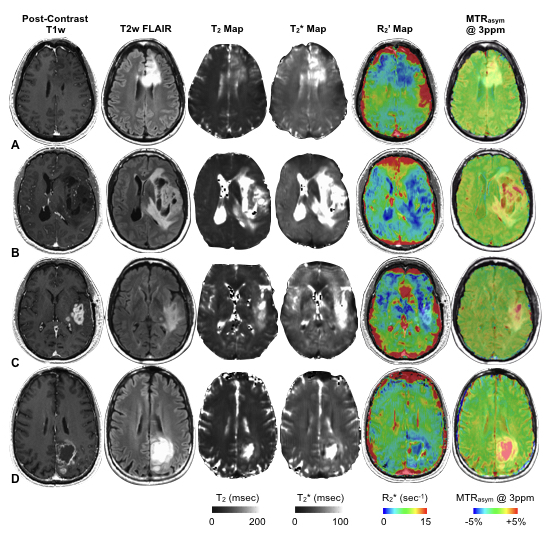
MTRasym at 3ppm within each phantom, varying by pH, was similar across all four echoes and matched simulation results (Fig.3A; P=0.999). In phantom samples containing varying concentration of Gd-DTPA, CEST-SAGE-EPI estimates of R2,R2*, and R2’ varied linearly with concentration (Fig.3B) and matched ME-GRE and CPMG measurements, with r2=6.24±0.04 mM-1×sec-1 (P<0.0001) and r2*=6.86±0.10 mM-1×sec-1 (P<0.0001). T2 hyperintense lesions in all patients exhibited heterogeneous areas of elevated MTRasym at 3ppm (acidity) and R2’ (hypoxia)(Fig.4). Interestingly, T2 hyperintense lesions exhibited a significantly lower median R2’ (4.8±0.2 sec-1) compared with NAWM (6.2±0.2 sec-1) (Fig.5A; P<0.0001) and did not vary significantly across tumor grade (Fig.5B; P=0.0537), suggesting non-enhancing tumor regions may be adequately oxygenated and undergoing aerobic glycolysis. In glioblastoma, significant differences in median R2’ across tissue types were observed (Fig.5C; P=0.0001), where R2’ was significantly lower in T2 hyperintense lesions (5.3±0.3 sec-1) compared to both NAWM (6.3±0.2 sec-1; P=0.0078) and CE regions (10.0±1.0 sec-1; P=0.0002). MTRasym within T2 hyperintense lesions (1.7±0.1%) were significantly higher than NAWM (0.8±0.03%) (Fig.5D; P<0.0001) and varied across grade (Fig.5E;P=0.0297). Combined information about both median tissue acidity (MTRasym at 3ppm) and oxygen extraction (R2’) helps to further delineate various tissue types and provide additional insights into metabolic behavior.Conclusion
The current study presents a new CEST-SAGE-EPI sequence for obtaining pH- and oxygen-sensitive image contrasts for brain tumor evaluation. Advantages include speed, in-line B0 correction, whole brain coverage, and simultaneous accurate estimation of CEST effects and relaxation rate Results in tumors showed a high degree of spatial heterogeneity and measurements were consistent with known cancer biology.Acknowledgements
We would like to acknowledge Catalina Raymond, M.S., and Saima Charni-Caabane, Ph.D., for their assistance with data collection.References
1. Warburg, O. The metabolism of tumours: investigations from the Kaiser Wilhelm Institute for Biology. (Berlin-Dahlem. (London, UK: Arnold Constable), 1930).
2. Sun, P.Z., Benner, T., Copen, W.A. & Sorensen, A.G. Early experience of translating pH-weighted MRI to image human subjects at 3 Tesla. Stroke 41, S147-151 (2010).
3. Harris, R.J., et al. pH-weighted molecular imaging of gliomas using amine chemical exchange saturation transfer MRI. Neuro Oncol 17, 1514-1524 (2015).
4. Harris, R.J., et al. Simulation, phantom validation, and clinical evaluation of fast pH-weighted molecular imaging using amine chemical exchange saturation transfer echo planar imaging (CEST-EPI) in glioma at 3 T. NMR Biomed 29, 1563-1576 (2016).
5.He, X., Zhu, M. & Yablonskiy, D.A. Validation of oxygen extraction fraction measurement by qBOLD technique. Magn Reson Med 60, 882-888 (2008).
6. Domsch, S., Mie, M.B., Wenz, F. & Schad, L.R. Non-invasive multiparametric qBOLD approach for robust mapping of the oxygen extraction fraction. Z Med Phys 24, 231-242 (2014).
7. Toth, V., et al. MR-based hypoxia measures in human glioma. J Neurooncol 115, 197-207 (2013).
8. Jensen-Kondering, U. & Baron, J.C. Oxygen imaging by MRI: can blood oxygen level-dependent imaging depict the ischemic penumbra? Stroke 43, 2264-2269 (2012).
9. Hirsch, N.M., et al. Technical considerations on the validity of blood oxygenation level-dependent-based MR assessment of vascular deoxygenation. NMR Biomed 27, 853-862 (2014).
10. Schmiedeskamp, H., et al. Combined spin- and gradient-echo perfusion-weighted imaging. Magn Reson Med 68, 30-40 (2012).
Figures