0959
Integrated vascular (iVas) MRI in brain tumors1Department of Radiology, Johns Hopkins University School of Medicine, Baltimore, MD, United States, 2Graduate School of Biomedical Sciences, UT Southwestern Medical Center, Dallas, TX, United States, 3Department of Neurosurgery, Johns Hopkins University School of Medicine, Baltimore, MD, United States
Synopsis
Perfusion and functional MRI, yielding markers such as cerebral blood volume, cerebrovascular reactivity, and functional connectivity, play an important role in the diagnosis and treatment of brain tumors. However, a major limitation is that collection of all this information requires separate scans and, in some cases, separate visits. Here we applied a novel iVas-MRI technique that provides quantitative assessment of multiple hemodynamic parameters and functional connectivity in a single scan of 9 minutes. It was found that the multi-parametric maps can reliably differentiate tumor from normal tissue and can further predict tumor grade.
Introduction
Perfusion and functional MRI play an important role in the diagnosis and treatment of brain tumors. Cerebral blood volume (CBV) is a diagnostic marker for tumor grading1,2. FMRI has been extensively used in pre-surgical planning to localize eloquent cortex3. Cerebrovascular reactivity (CVR) mapping using breath-hold has been proposed to be important in identifying tissues with neurovascular uncoupling (NVU) due to tumor infiltration or edema4. However, a major limitation of the current clinical workflow is that collection of all this information requires separate scans and, in some cases, separate visits, which increases patient burden and escalates the cost of care. Recently, an integrated vascular (iVas) MRI was developed to provide quantitative mapping of cerebrovascular reactivity (CVR), cerebral blood volume (CBV), bolus arrival time (BAT), and functional connectivity (FC) without using contrast agent5. Here we applied this technique in patients with brain tumor, and evaluated the ability of iVas parametric maps to predict tumor grade and detect potential NVU.Methods
Patients: Six brain tumor patients (4 males, age 24-81yo) were scanned on 3T MRI (Philips), after IRB-approved informed consent was obtained.
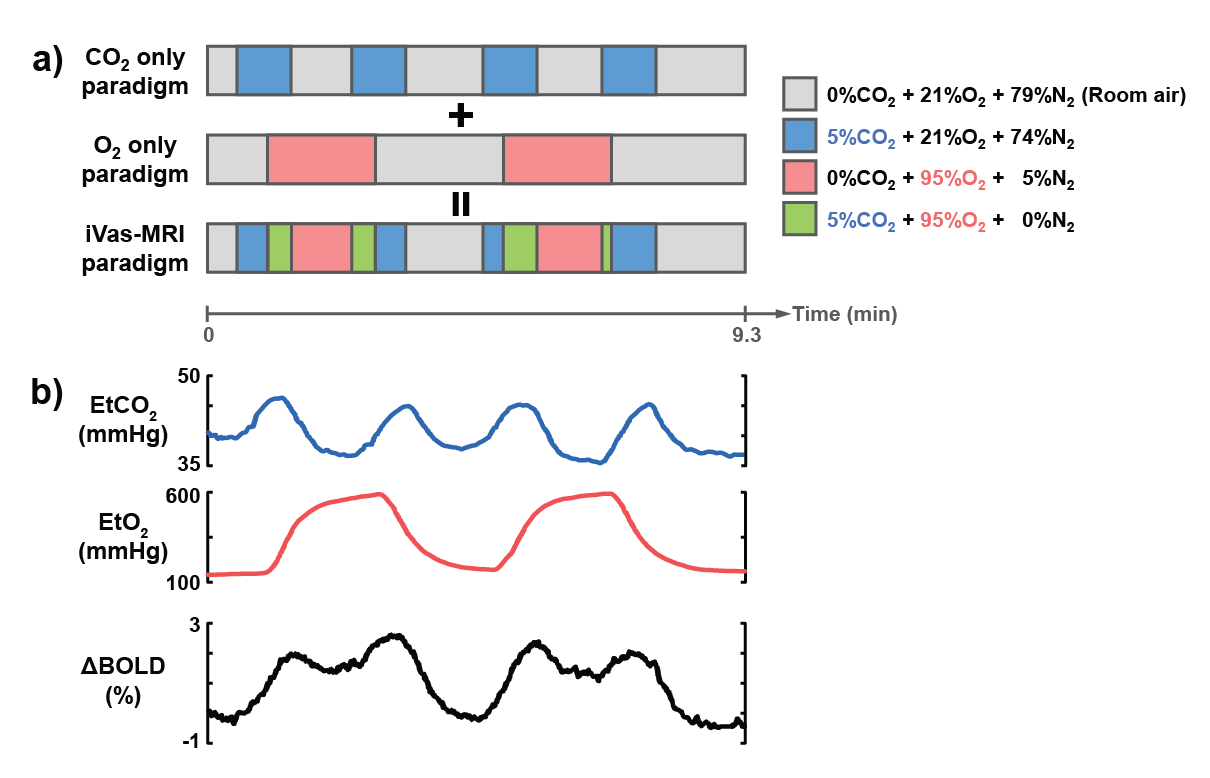
iVas-MRI: A concomitant CO2/O2 challenge was performed while BOLD images were continuously collected5. The timing of the CO2 and O2 paradigms was optimized previously and is illustrated in Fig. 1, allowing CO2 and O2 levels to be modulated independently without interference from each other. The BOLD sequence used the following parameters: TR/TE=1550/21ms, 3.2×3.2x3.5mm3, scan duration=9.3min. As a comparison, breath-hold BOLD was performed to obtain an independent CVR measure4.
Data processing: Following the analysis method described previously5, BOLD images and physiological recordings of end-tidal (Et) CO2 and O2 traces were used to calculate maps of CVR (based on BOLD signal change to EtCO2 change), CBV (based on BOLD signal change to EtO2 change), and BAT (based on the time lag between physiological recordings and BOLD signal). The residual BOLD time course after factoring out the CO2 and O2 influences was used to estimate FC maps6. Ten FC networks were obtained in each patient.
Statistical analysis: Regions-of-interest (ROI) were manually drawn on tumor and contralateral healthy tissue. The ROI masks were applied to the CVR, CBV, and BAT maps to obtain regional values. For FC, the number of voxels that were significant (Z>0.4) in any of the ten FC networks was calculated for tumor and contralateral ROIs separately, and this number is referred to as voxel-count. Parametric values were compared between tumor and contralateral ROIs using paired t-tests. Correlation between tumor grade and CBV was examined. The relationship between CVR and FC voxel-count was also investigated.
Results and Discussion
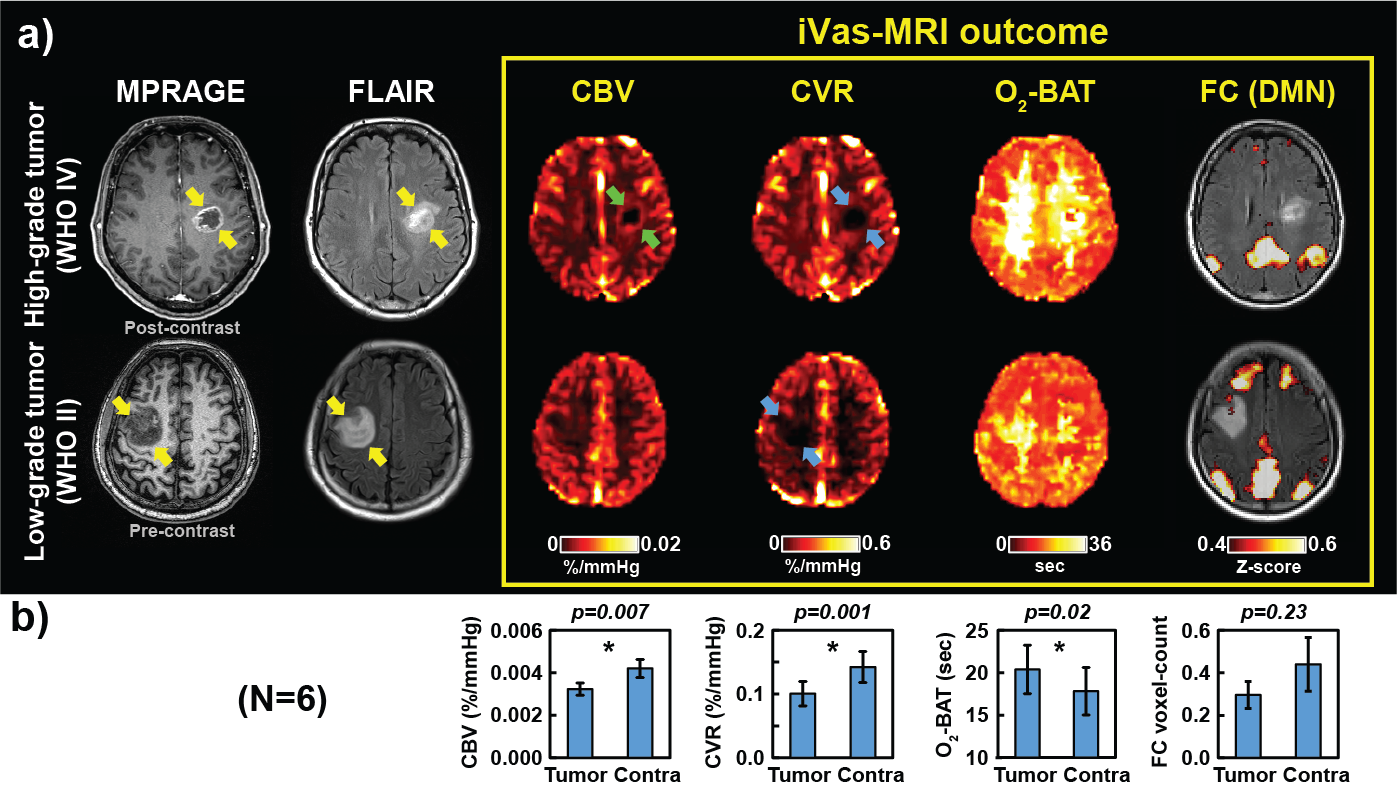
Fig. 2a shows iVas parametric maps along with anatomical images from one patient with high-grade tumor (glioblastoma, WHO IV) and another patient with low-grade tumor (astrocytoma, WHO II). It can be seen that tumor regions exhibit a diminished CVR regardless of tumor grade (blue arrows). CBV in the tumor region is also lower than control region in general. However, high-grade tumor reveals ring-shaped elevation in CBV (green arrows). Note that our CBV technique is not susceptible to vascular leakage (because hemoglobin does not leak out unlike Gd). Therefore, the CBV elevation is attributed to neovascularization in the high-grade tumor.
Fig. 2b summarizes ROI results in all patients (N=6). Both CBV and CVR decreased significantly, while BAT increased significantly (p=0.02) in tumor compared to the normal-appearing contralateral region.
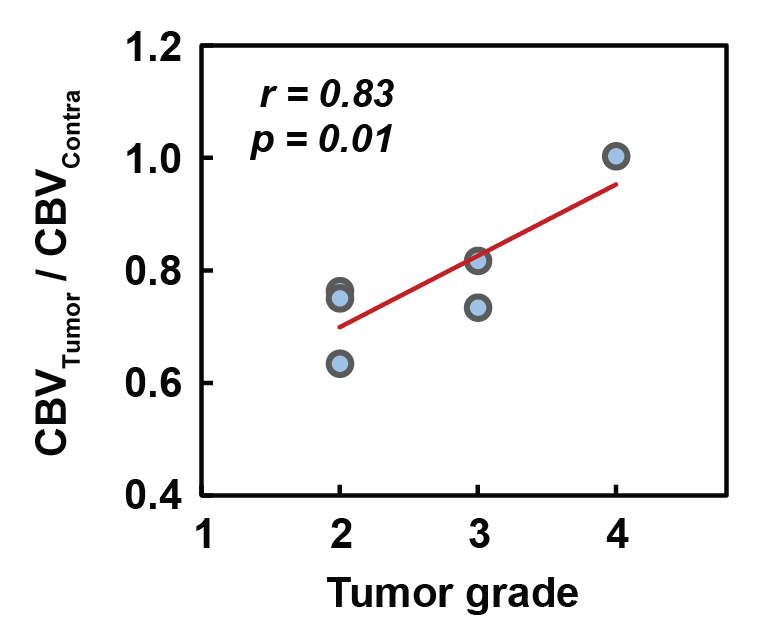
Next, we examined the correlation between CBV and tumor grade. A strong correlation between CBV and tumor grades was observed (r=0.83; p=0.01), as shown in Fig. 3, but this relationship was only observed when normalizing the tumor CBV with the contralateral value.
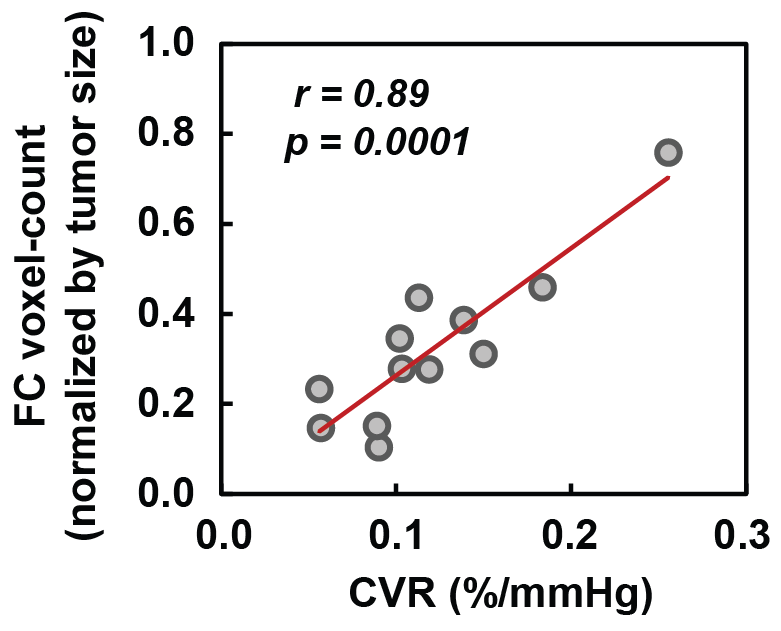
Finally, we compared FC voxel-count between tumor and contralateral region (Fig. 2b). There was no significant difference in FC voxel-count. However, we observed a significant (p<0.0001) association between FC voxel-count and CVR values (Fig. 4). That is, regions with low CVR tend to have a smaller number of voxels detected in FC networks, consistent with the notion that vascular response is the basis of the fMRI signal.
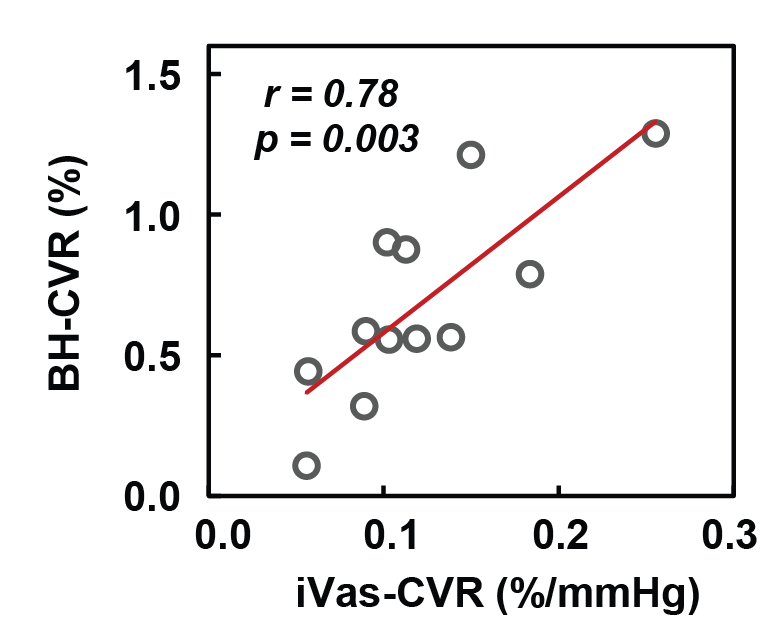
As an exploratory analysis, we compared CVR measured by iVas-MRI with that measured by breath-hold in Fig. 5. A significant correlation was observed between these two measures (p=0.003).
Conclusion
We applied a novel iVas-MRI technique to measure CVR, CBV, BAT, and FC networks concomitantly in brain tumor patients. It was found that the multi-parametric maps can reliably differentiate tumor from normal tissue and can further predict tumor grade. iVas-MRI may be a cost-effective approach to assist in tumor grading and presurgical planning in glioma patients.Acknowledgements
No acknowledgement found.References
1. Law M, Yang S, Babb JS, Knopp EA, Golfinos JG, Zagzag D, Johnson G. Comparison of cerebral blood volume and vascular permeability from dynamic susceptibility contrast-enhanced perfusion MR imaging with glioma grade. AJNR Am J Neuroradiol 2004;25(5):746-755.
2. Lu H, Pollack E, Young R, Babb JS, Johnson G, Johnson G, Zagzag D, Carson R, Jensen JH, Helpern JA, Law M. Predicting grade of cerebral glioma using vascular-space occupancy MR imaging. Am J Neuroradiol 2008;29(2):373-378.
3. Shimony JS, Zhang D, Johnston JM, Fox MD, Roy A, Leuthardt EC. Resting-state spontaneous fluctuations in brain activity: a new paradigm for presurgical planning using fMRI. Acad Radiol 2009;16(5):578-583.
4. Zaca D, Jovicich J, Nadar SR, Voyvodic JT, Pillai JJ. Cerebrovascular reactivity mapping in patients with low grade gliomas undergoing presurgical sensorimotor mapping with BOLD fMRI. J Magn Reson Imaging 2014;40(2):383-390.
5. Liu PY, Welch BG, Li Y, Gu H, King D, Yang YH, Pinho M, Lu HZ. Multiparametric imaging of brain hemodynamics and function using gas-inhalation MRI. Neuroimage 2017;146:715-723.
6. Beckmann CF, Smith SM. Probabilistic independent component analysis for functional magnetic resonance imaging. IEEE Trans Med Imaging 2004;23(2):137-152.
Figures