0957
RADIOMIC ANALYSIS OF 3D MR FINGERPRINTING IN ADULT BRAIN TUMORS1Case Western Reserve University, Cleveland, OH, United States, 2University Hospitals Cleveland Medical Center, Cleveland, OH, United States
Synopsis
Though conventional and advanced MR imaging studies such as perfusion and MR spectroscopy are useful for evaluating brain tumors, there remains a need for a rapid, quantitative, and non-invasive method. Magnetic Resonance Fingerprinting (MRF) utilizes pseudo-randomized acquisition parameters to simultaneously quantify multiple tissue properties including T1 and T2 relaxation times. A previous 2D MRF study quantitatively differentiated between solid tumor and peri-tumoral white matter regions of various brain tumors. In this ongoing study we demonstrate the capability of volumetric 3D MRF to improve lesion characterization between adult intra-axial brain neoplasms using first- and second- order radiomic analysis.
INTRODUCTION
Magnetic Resonance Fingerprinting (MRF) utilizes pseudo-randomized acquisition parameters to simultaneously quantify multiple tissue properties including T1 and T2 relaxation times.1 In our previous work, we demonstrated the ability of 2D single slice MRF to quantitatively differentiate between solid tumor and peri-tumoral white matter regions of various intra-axial brain tumors.2 Here, we assess the capability of 3D MRF to differentiate between common brain tumors and assess whether radiomic analysis aids in further tumor differentiation.METHODS
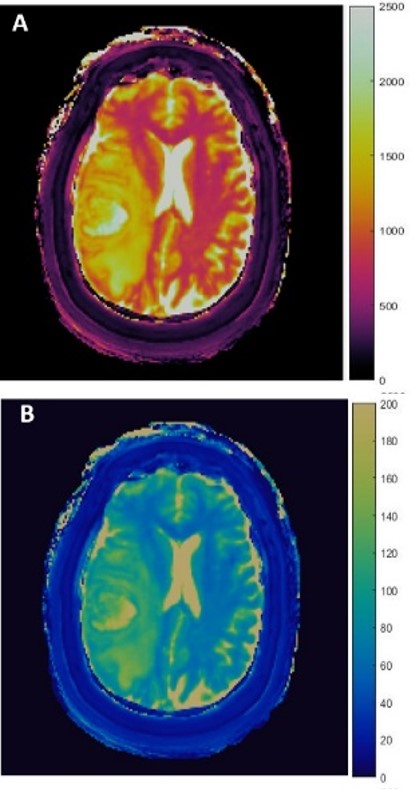
In this IRB approved study, 3D-MRF was performed in 23 patients with 10 glioblastomas (GBM), 2 anaplastic astrocytomas (AA), 17 metastases, and 4 lower grade gliomas (LGGs) on 3T (Magnetom Skyra; Siemens, Erlangen, Germany) using a 20-channel head coil. FISP-based MRF acquisitions were appended to clinical scans before contrast administration with parameters as follows: 1440 TRs per partition; matrix, 256 x 256 x 48; FOV, 300 x 300 x 144 mm3; whole-brain acquisition time, 4.6 minutes; image resolution 1.2 x 1.2 x 3 mm3.3-5 Baseline B1 measurement was performed and used to correct for B1 inhomogeneity. A low rank model based reconstruction generated T1, T2 maps which were then used for region of interest (ROI) analysis (Fig.1).2,4 The solid tumor (ST) regions and peri-tumoral white matter (PW) regions were defined as previously described.2 Volumetric ROIs were manually drawn on ST and PW regions (size range: 0.08—38.88 and 0.29—55.06 cm2, respectively) and mean T1, T2 values were compared between (a) GBMs, (b) High Grade Gliomas (HGG=GBM+AA), and (c) all gliomas (GBM+AA+LGG), versus metastases using Wilcoxon rank sum test. Using 3D gray level co-occurrence matrices,19 second-order texture features were computed, to quantify the relationships between pairs of voxels and their neighbors in 13 directions.6 Spearman’s rank correlation coefficient analysis was used to remove redundant texture features; finally 10 features were compared across tumor groups using Wilcoxon rank sum test with multiple comparisons correction. Area under curve (AUC) was calculated with receiver operating curve (ROC) analysis.RESULTS
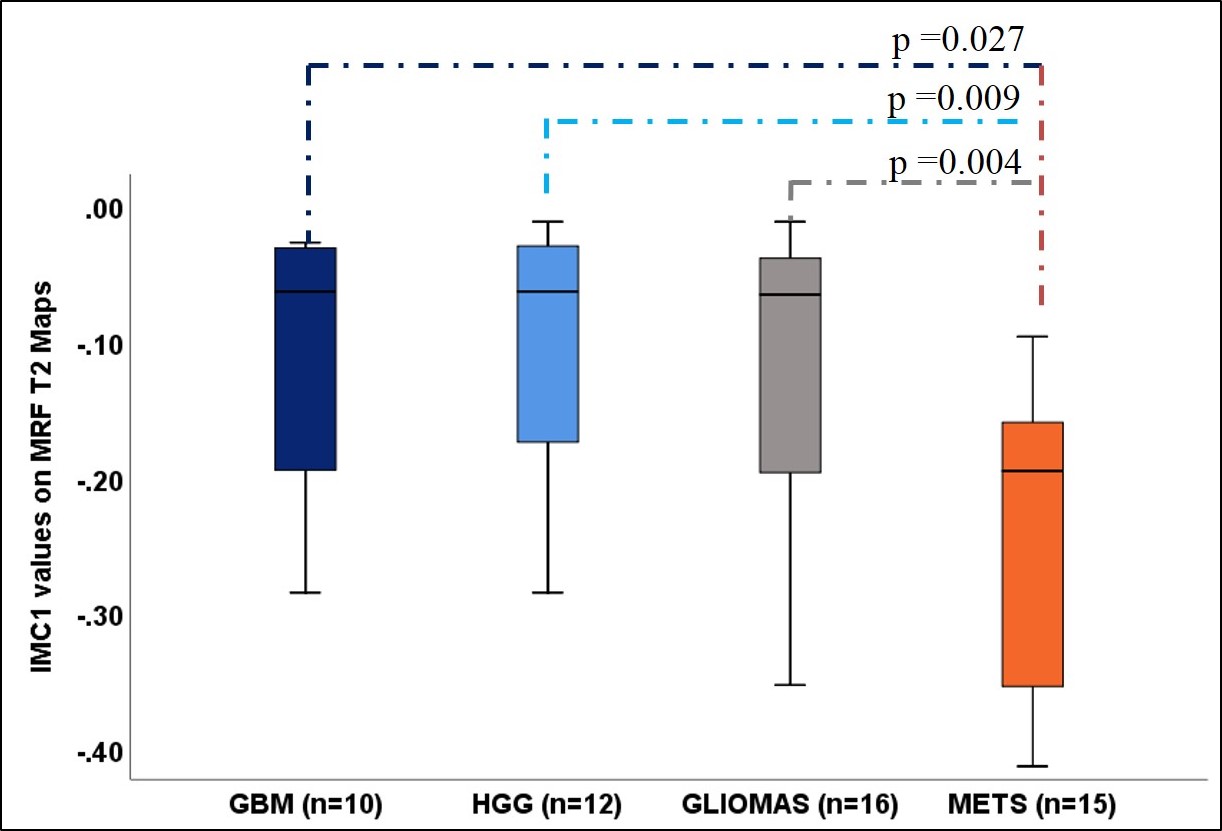
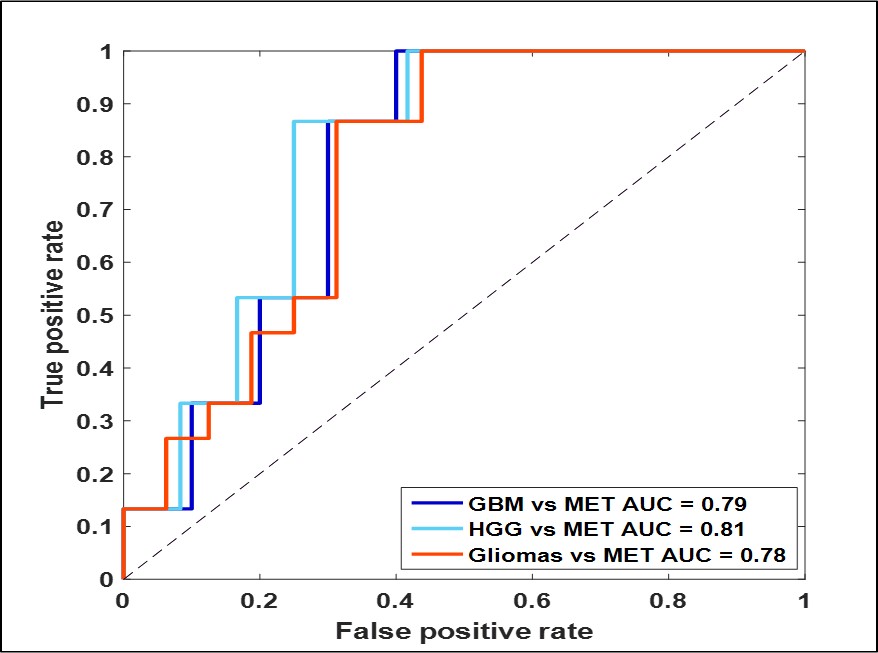
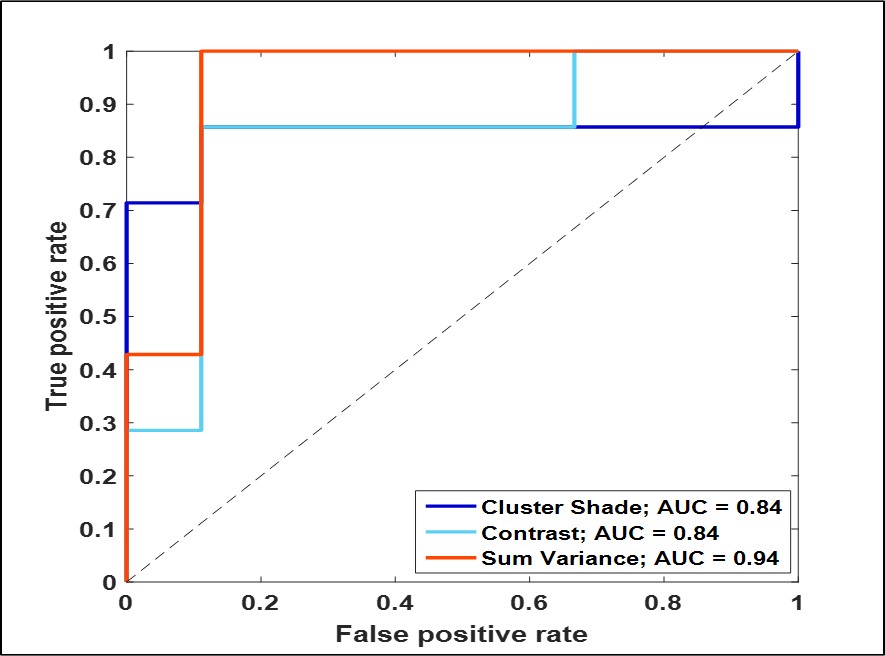
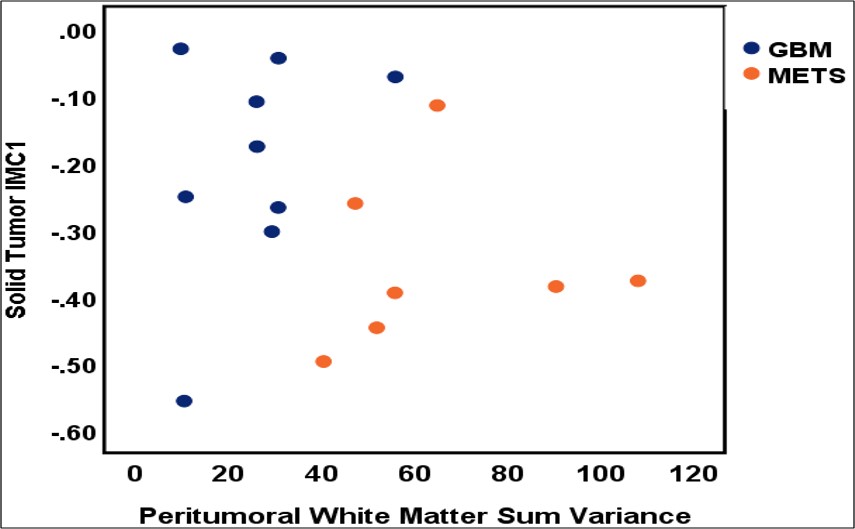
Mean T1 values of gliomas (1681.1 ± 149.2 ms) were higher than metastases (1538 ± 219.97 ms, p= 0.21, AUC=0.77). Multiple texture features demonstrated a significant difference between various glial tumors and metastases on T1 and T2 maps in ST and PW regions. The most significant texture features were sum variance and the information measures of correlation (IMC 1 and 2). Specifically, ST IMC1 values were higher in GBM than metastases, (T1: p= 0.027, AUC=0.79 and T2: p=0.015, AUC=0.81; see Fig. 2, 3). PW comparison between GBM and metastases revealed most significant differences for cluster shade, contrast, and sum variance (p=0.011, AUC=0.84; p=0.011, AUC=0.84; and p=0.001, AUC=0.94, respectively) on MRF T2 maps (See Fig. 4). Combining variables of ST IMC1 (p=0.015, AUC=0.81) and PW Sum variance (p=0.001, AUC=0.94) reveals distinction between GBM and metastases on MRF T2 maps (See Fig. 5).DISCUSSION
3D-MRF allows quantitative analysis of the entire tumor volume, thereby offering an opportunity to capture the heterogeneity of tumor microenvironment. Here we demonstrate differences in T1 of all gliomas versus metastases which are consistent with previously seen 2D trends.2 Second-order radiomic analysis of 3D-MRF improves characterization of tumoral and peritumoral regions above and beyond first-order features, by statistically quantifying sub-tumoral features that are not apparent to the human eye. IMC1 which is a function of entropy7—a measure of randomness of intensity values for each ROI—was found to be higher in glial tumors as compared to metastases, suggesting that voxel intensity combinations in each tumor group have distinguishing levels of randomness which may point to inherent tissue-based differences between various tumor types. Similarly IMC2, an equation distinct from IMC1, is another statistical function of the entropy values of voxel pairs in the GLCM. T2 Sum variance, a feature that measures the variation around the sum entropy, is found to be higher in peri-tumoral white matter regions surrounding metastases. Since sum entropy is a measure of randomness of the sums of the gray-scale level voxels, differences in sum variance allude to differences in underlying tissue properties.CONCLUSION
Radiomic analysis of 3D-MRF data allows differentiation between common adult intra-axial brain tumors by offering the opportunity to evaluate quantitative features of the whole lesion volumes and improving lesion characterization. Ongoing patient recruitment will allow evaluation of the robustness and accuracy of our results in a larger sample size.Acknowledgements
1. CTSC Annual Pilot award
2. Cristal Brain Tumor Fund Pilot award
References
1. Ma D, Gulani V, Seiberlich N, et al. Magnetic resonance fingerprinting. Nature 2013;495:187-192
2. Badve C, Yu A, et al. MR Fingerprinting of Adult Brain Tumors: Initial Experience AJNR Am J Neuroradiol 2017;38:492-499
3. Ma D, et al. Fast 3D Magnetic Resonance Fingerprinting for a Whole-Brain Coverage. MRM August 2017. doi:10.1002/mrm.26886.
4. Ma D, et al. Applications of Low Rank Modeling to Fast 3D Magnetic Resonance Fingerprinting (MRF). ISMRM 25th Annual meeting 2017
5. Jiang Y, et al. MR fingerprinting using fast imaging with steady state precession (FISP) with spiral readout. Magn. Reson. Med 2015;74:1621-1631
6. Haralick RM, et al. Textural features for image classification. IEEE Trans Syst Man Cybern 1973; 3: 610–21.
7. Alobaidli S, et al. The role of texture analysis in imaging as an outcome predictor and potential tool in radiotherapy treatment planning. Br. J. Radiol. 2014;87(1042)
Figures