0955
Magnetic Resonance Spectroscopic Differences of Diffuse Glioma Groups Classified by IDH and TERT Promoter Mutations at 3T1Institute of Biomedical Engineering, Bogazici University, Istanbul, Turkey, 2Department of Medical Engineering, Acibadem Mehmet Ali Aydinlar University, Istanbul, Turkey, 3Neuroradiology Research Center, Acibadem Mehmet Ali Aydinlar University, Istanbul, Turkey, 4Department of Molecular Biology and Genetics, Acibadem Mehmet Ali Aydinlar University, Istanbul, Turkey, 5Department of Neurosurgery, Acibadem Mehmet Ali Aydinlar University, Istanbul, Turkey, 6Department of Radiology, Acibadem Mehmet Ali Aydinlar University, Istanbul, Turkey
Synopsis
Overall survival of gliomas has been reported to be highly associated with the presence of isocitrate dehydrogenase (IDH) and telomerase reverse transcriptase (TERT) promoter mutations. The aim of this study is to define MR spectroscopic (MRS) differences of diffuse glioma subgroups classified by IDH and TERT promoter mutations at 3T. TERT-only mutated and TERT wild type IDH wild type (TW-IDHW) gliomas had similar metabolic profiles. Besides well-reported 2HG, our study indicated the importance of glycine, glutathione, glutamate, and glutamine in identification of IDH-mutant gliomas. TERT-only gliomas had the highest glutamate and glutathione, which might be indicators of poor overall survival.
PURPOSE
Recent update in WHO classification of central nervous system tumors incorporated genetic markers such as IDH mutation into the diagnosis of gliomas1, 2, and clinicians have increasingly been employing genetic information in treatment decision making. Overall survival of gliomas has been reported to be highly associated with the presence of isocitrate dehydrogenase (IDH), telomerase reverse transcriptase (TERT) promoter, and TP53 mutations, and 1p/19q codeletion3-6. IDH mutant (IDHM) gliomas have a better natural history, better treatment response and longer survival than IDH-wild type (IDHW) tumors7, 8. On the other hand, TERT-only mutant gliomas have been reported to have the worst overall survival both among low-grade gliomas (LGG) and glioblastoma multiforme (GBM)3. Magnetic resonance spectroscopy provides biomarkers of cellular metabolism, and previous studies have reported higher 2-hydroxyglutarate (2HG)9, 10, and lower glutamate (Glu)11 and glutathione (GSH)12 in IDHM gliomas than IDHW patients. There has not been a report on MRS markers of TERT mutational subtypes of IDH mutation in gliomas. The aim of this study is to define MR spectroscopic differences of diffuse glioma groups classified by IDH and TERT promoter mutations at 3T.METHODS
A total of 112 patients diagnosed with a diffuse-glioma (70M/42F, mean age: 42.08±13.88 years, range: 20-74 years, 33 glioblastoma multiforme (GBM), 27 anaplastic astrocytoma (AA), 8 grade III oligodendroglioma, 5 grade III oligoastrocytoma, 18 grade II astrocytoma, 18 grade II oligodendroglioma, and 3 grade II oligoastrocytoma) were scanned a day before surgery at a Siemens Tim Trio clinical 3T scanner (Erlangen, Germany) using a 32-channel head coil. Magnetic resonance spectroscopy data were acquired from the solid tumor region excluding gross hemorrhage, edema and necrosis by using a short echo time (TE) Point Resolved Spectroscopy (PRESS) sequence (repetition time (TR)=2000 ms, TE=30ms, 1024 points, 1200 Hz, voxel size= 10x10x10 mm3, number of signal averages= 192, acquisition time=6.5 min). The data were processed by using LCModel13. Twenty MR spectroscopic peak concentrations, including glutamate (Glu), glutamine (Gln), glycine (Gly), 2-hydroxyglutarate (2HG), glutathione (GSH), myo-inositol (Ins), and lactate (Lac), and six composite peak concentrations, including total choline (GPC+PCh, tCho), total creatine (Cr+PCr), glutamate-glutamine complex (Glx), and total NAA (NAA+NAAG), were quantified for each spectrum. Any metabolite that was not quantifiable in more than 30% of the patients was not included in the analysis. Additionally, for the remaining metabolites, any metabolite of a given spectrum with a Cramer-Rao lower bound (CRLB) of more than 30 was excluded from the analysis. Immunohistochemistry was performed for determining IDH1 (Diovana, H09) mutations. Afterwards, minisequencing was performed for IDH1-R132G/S/C, IDH1-R132L/H/P, IDH2-R140Q/L, IDH2-R140W, IDH2-R172K/M, IDH2-R172W, hTERT-C228T and hTERT-C250T. A Kruskal-Wallis test followed by pairwise multiple comparison Tukey-Kramer test was used to identify statistically significant MR spectroscopic differences between IDH (IDHM and IDHW) and TERT (TERT mutant (TM) and wild type (TW)) mutational subgroups of gliomas.RESULTS
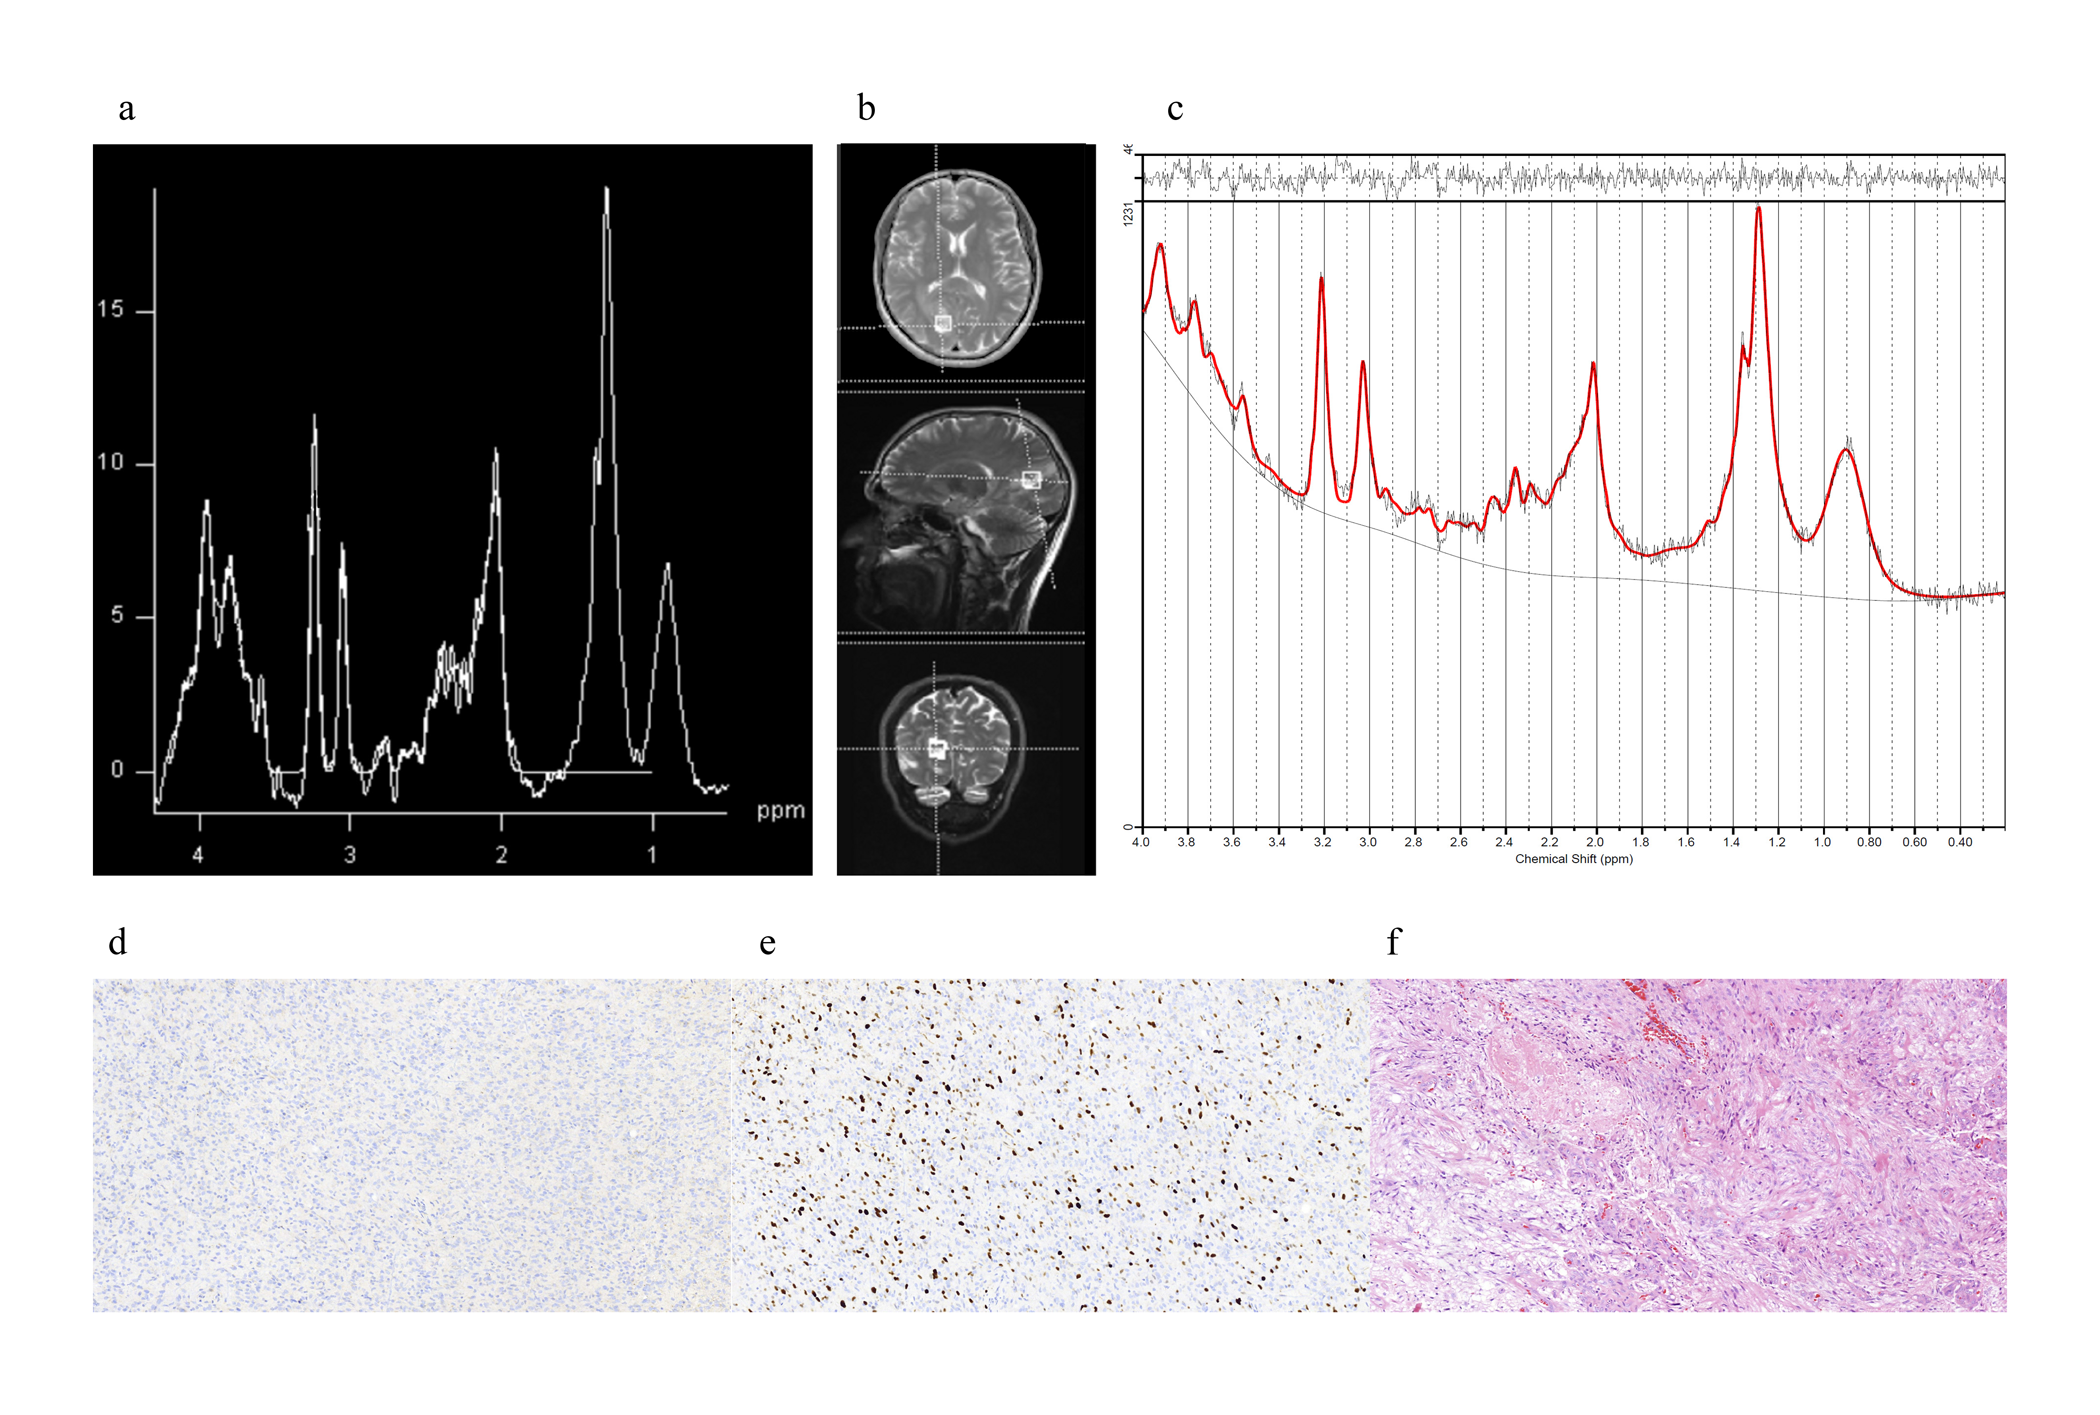
Figures 1 shows short-TE PRESS spectrum along with the LCModel results and IDH (d), Ki-67 (e), and hematoxylin and eosin (f) staining of a TW-IDHW GBM. There were no statistically significant metabolic differences between TERT-only mutated (TM-IDHW) and TW-IDHW gliomas (Table 1). TERT-only gliomas had the highest Glu and GSH, while TW-IDHW gliomas had the highest Gln, Glyc, tCho, and Glx. Additionally, TERT-only mutated gliomas had the lowest Ins, but it was not statistically significant (n.s.). TM-IDHM gliomas had the lowest Gln, GSH, Glyc, GPC, tCho, Lac (n.s.) and highest Cr, NAA (n.s.), and tNAA (n.s.). TW-IDHW had higher Gln than both IDHM groups (P<0.007). TM-IDHW had higher Glu (P=0.001) and Glyc than TW-IDHM (P=0.012). TM-IDHM had lower Glyc than both IDHW groups (P<0.006). IDHW groups had higher GSH than both IDHM groups (P<0.0002). TW-IDHW groups had highest tCho, which was statistically significantly higher than both IDHM groups (P<0.004). IDHW groups had higher Glx than IDHM groups (P<0.002).DISCUSSION
No metabolic differences were found between TERT-only mutated and TW-IDHW gliomas, supporting the findings of similar clinical behavior of these two groups. IDH mutation was found to be the main factor in metabolic differences between different TERT and IDH mutational subgroups of diffuse gliomas. Besides well-reported 2HG, our study indicated the importance of Glyc, GSH, Glu, and Gln in identification of IDHM gliomas. TERT-only gliomas had the highest Glu and GSH, which might be indicators of poor overall survival.CONCLUSION
Short-TE MRS is a clinically useful tool in identifying metabolic profile differences between diffuse glioma subgroups defined by IDH and TERT promoter mutations. Future studies will explore the utility of machine-learning algorithms for classifying these subgroups based on MRS profiles at 3T.Acknowledgements
This research was supported by TUBİTAK 1003 grant 216S432.References
1. Hoshide R and Jandial R. 2016 World Health Organization Classification of Central Nervous System Tumors: An Era of Molecular Biology. World neurosurgery 2016; 94: 561-562.
2. Louis DN, Perry A, Reifenberger G, et al. The 2016 World Health Organization Classification of Tumors of the Central Nervous System: a summary. Acta Neuropathol 2016; 131: 803-820.
3. Eckel-Passow JE, Lachance DH, Molinaro AM, et al. Glioma Groups Based on 1p/19q, IDH, and TERT Promoter Mutations in Tumors. The New England journal of medicine 2015; 372: 2499-2508.
4. Killela PJ, Pirozzi CJ, Healy P, et al. Mutations in IDH1, IDH2, and in the TERT promoter define clinically distinct subgroups of adult malignant gliomas. Oncotarget 2014; 5: 1515-1525.
5. Ogura R, Tsukamoto Y, Natsumeda M, et al. Immunohistochemical profiles of IDH1, MGMT and P53: practical significance for prognostication of patients with diffuse gliomas. Neuropathology : official journal of the Japanese Society of Neuropathology 2015; 35: 324-335.
6. Takano S, Ishikawa E, Sakamoto N, et al. Immunohistochemistry on IDH 1/2, ATRX, p53 and Ki-67 substitute molecular genetic testing and predict patient prognosis in grade III adult diffuse gliomas. Brain tumor pathology 2016; 33: 107-116.
7. Yan H, Bigner DD, Velculescu V, et al. Mutant metabolic enzymes are at the origin of gliomas. Cancer research 2009; 69: 9157-9159. Review 2009/12/10.
8. Yan H, Parsons DW, Jin G, et al. IDH1 and IDH2 mutations in gliomas. The New England journal of medicine 2009; 360: 765-773.
9. Choi C, Ganji SK, DeBerardinis RJ, et al. 2-hydroxyglutarate detection by magnetic resonance spectroscopy in IDH-mutated patients with gliomas. Nature medicine 2012; 18: 624-629.
10. Andronesi OC, Kim GS, Gerstner E, et al. Detection of 2-hydroxyglutarate in IDH-mutated glioma patients by in vivo spectral-editing and 2D correlation magnetic resonance spectroscopy. Science translational medicine 2012; 4: 116ra114.
11. Nagashima H, Tanaka K, Sasayama T, et al. Diagnostic value of glutamate with 2-hydroxyglutarate in magnetic resonance spectroscopy for IDH1 mutant glioma. Neuro-oncology 2016; 18: 1559-1568.
12. Shi J, Zuo H, Ni L, et al. An IDH1 mutation inhibits growth of glioma cells via GSH depletion and ROS generation. Neurological Sciences 2014; 35: 839-845. 2013 Dec 22.
13. Provencher SW. Automatic quantitation of localized in vivo 1H spectra with LCModel. NMR in biomedicine 2001; 14: 260-264.
Figures