0954
Tumor microenvironment (TME) mapping: MRI of intratumoral heterogeneity of oxygen metabolism and neovascularization uncovers two survival relevant subgroups of IDH1 wild-type glioblastoma1Department of Neurosurgery, University of Erlangen-Nürnberg, Erlangen, Germany, 2Institute of Medical Radiology, University Clinic of St. Pölten, St. Pölten, Austria, 3Department of Neuroradiology, University of Erlangen-Nürnberg, Erlangen, Germany, 4Department of Neuropathology, University of Erlangen-Nürnberg, Erlangen, Germany, 5Department of Neurology, University Clinic of St. Pölten, St. Pölten, Austria
Synopsis
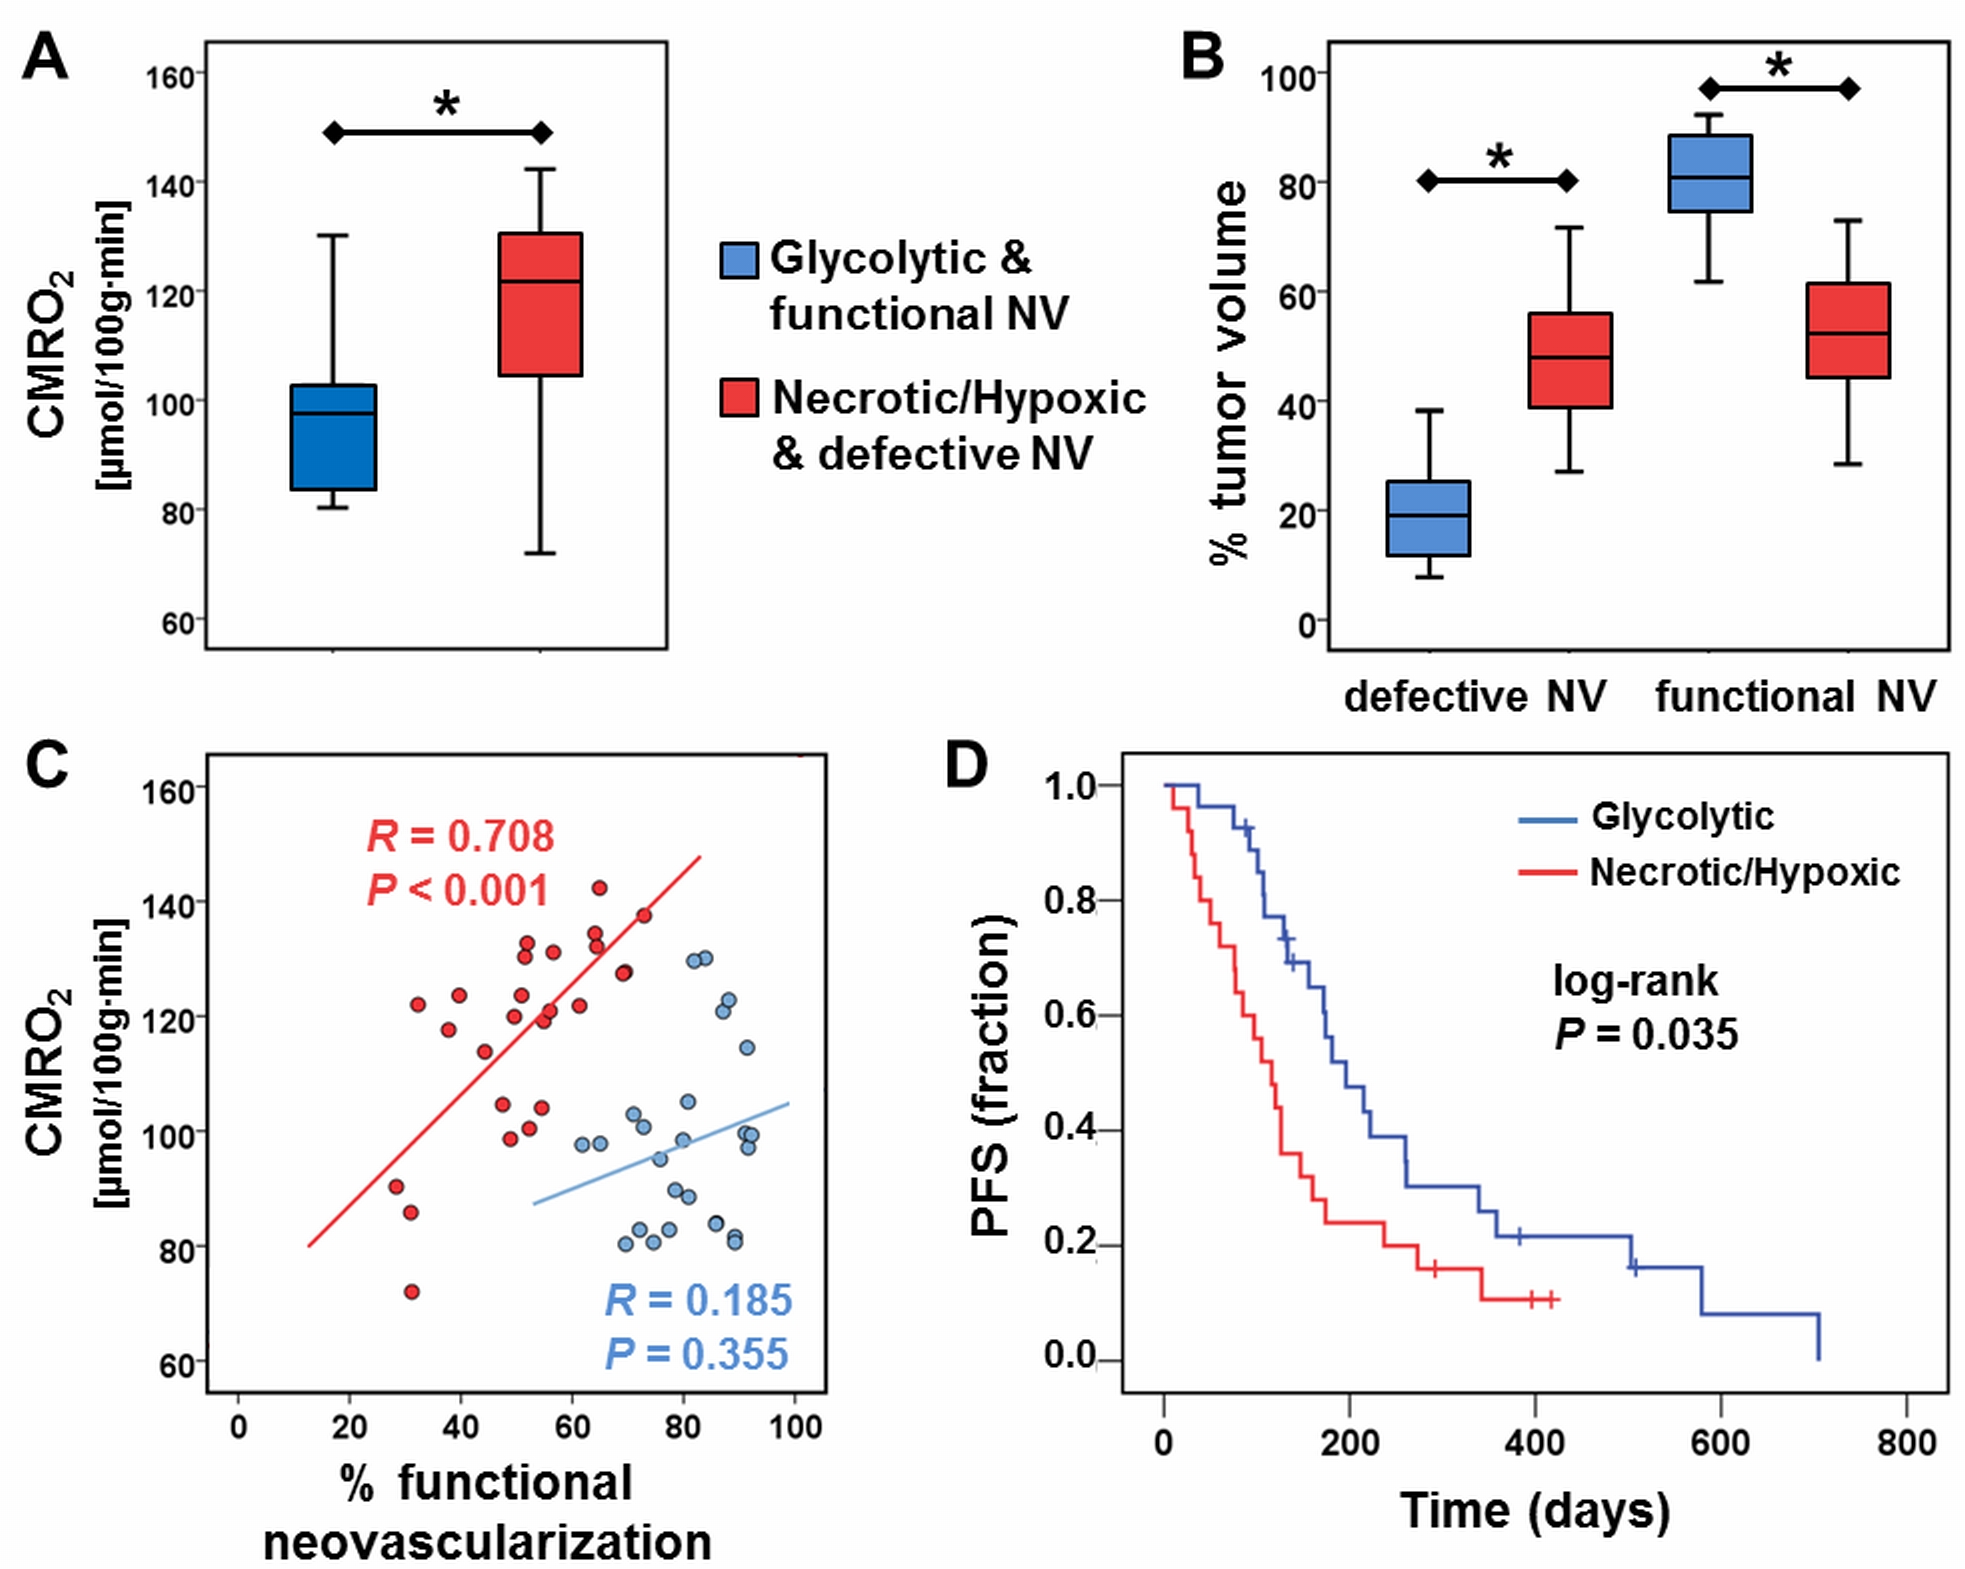
The dismal prognosis of glioblastoma is largely attributed to hypoxic and perivascular niches in the tumor microenvironment (TME) which are essential for elucidation of pathophysiological mechanisms behind therapy resistance and recurrence. Here, we combined MRI biomarkers for oxygen metabolism and neovascularization with an automatic classification strategy for localization of hypoxic and vascular niches within the heterogeneously structured TME. Correlation with the metabolic pathway for energy production uncovered two different phenotypes for glioblastoma IDH1wt: A glycolytic phenotype with stable functional neovasculature, and a necrotic/hypoxic phenotype with defective neovasculature and a more aggressive tumor behavior. The glycolytic phenotype showed longer progression-free survival.
Introduction
Knowledge of the hypoxic and perivascular niches in the tumor microenvironments (TMEs) is essential for understanding treatment failure. Reprogramming of energy metabolism additionally represent a considerable problem in therapeutic management of glioblastoma (1). In contrast to normal differentiated cells, which rely primarily on mitochondrial oxidative phosphorylation (OxPhos) for energy production, most cancer cells instead rely on aerobic glycolysis, a phenomenon termed “Warburg effect”. The interplay between oxygen metabolism, neovascularization and energy metabolism is of crucial importance in tumor biology. The purpose was to combine MRI biomarkers for oxygen metabolism and neovascularization with an automatic classification strategy including energy metabolic pathways for localization of hypoxic and vascular niches. We termed our approach TME mapping.Methods
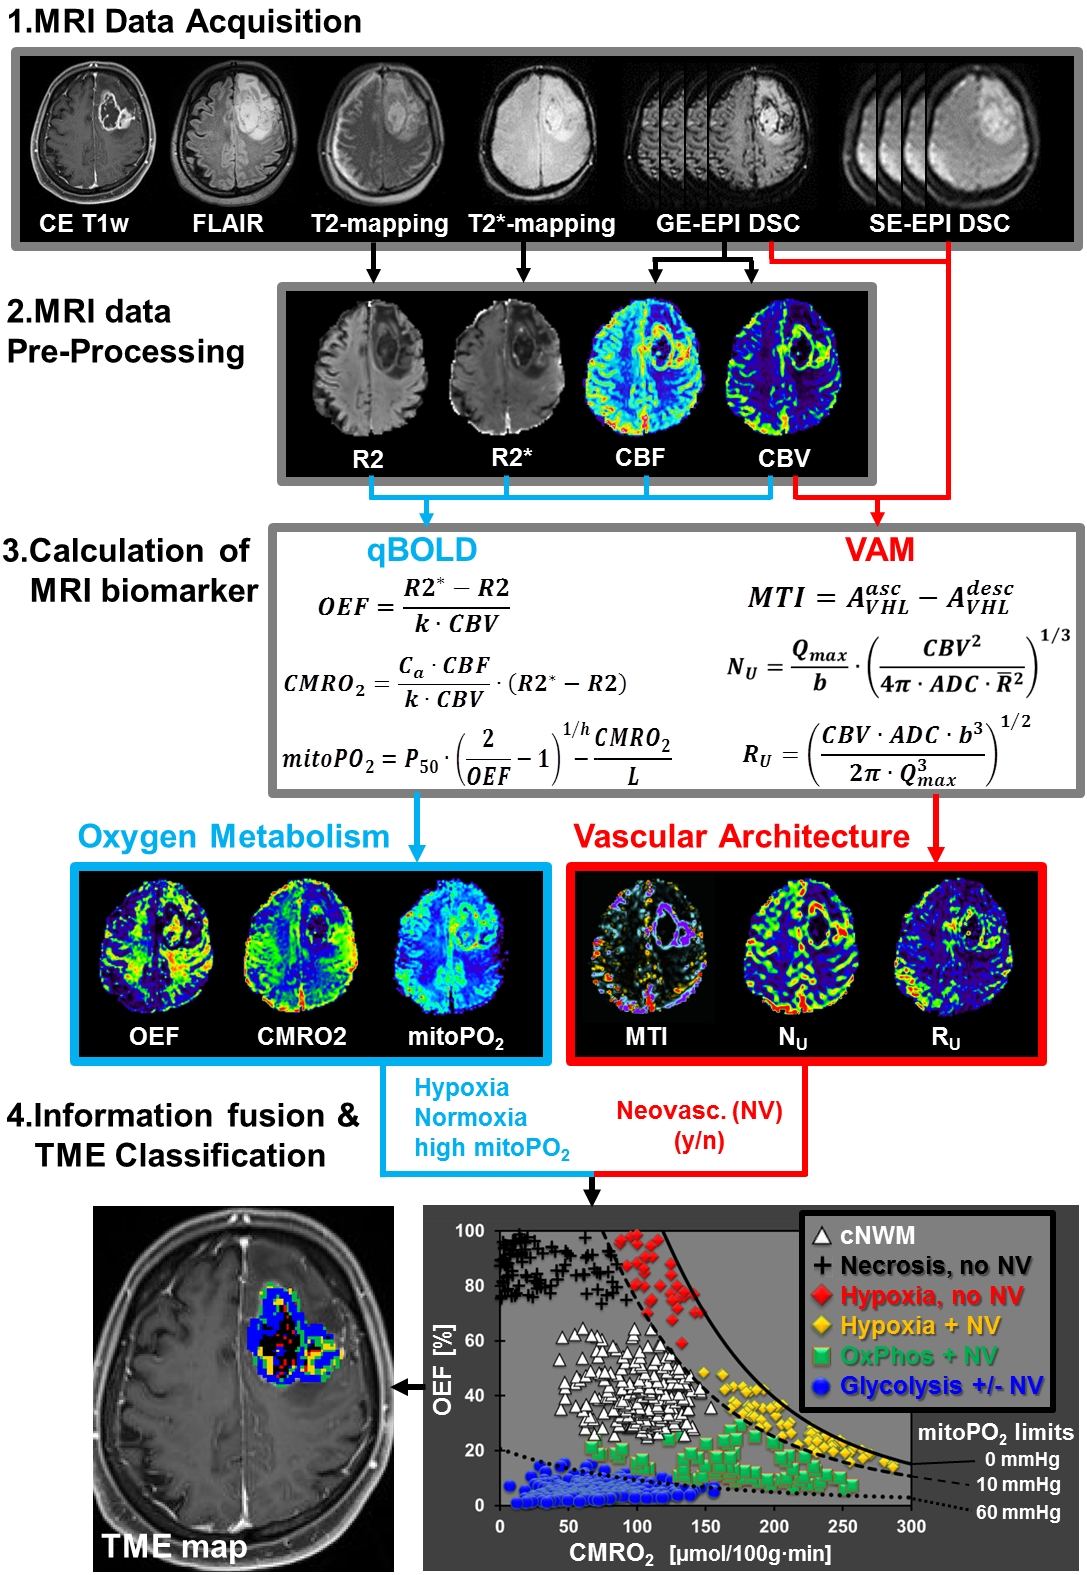
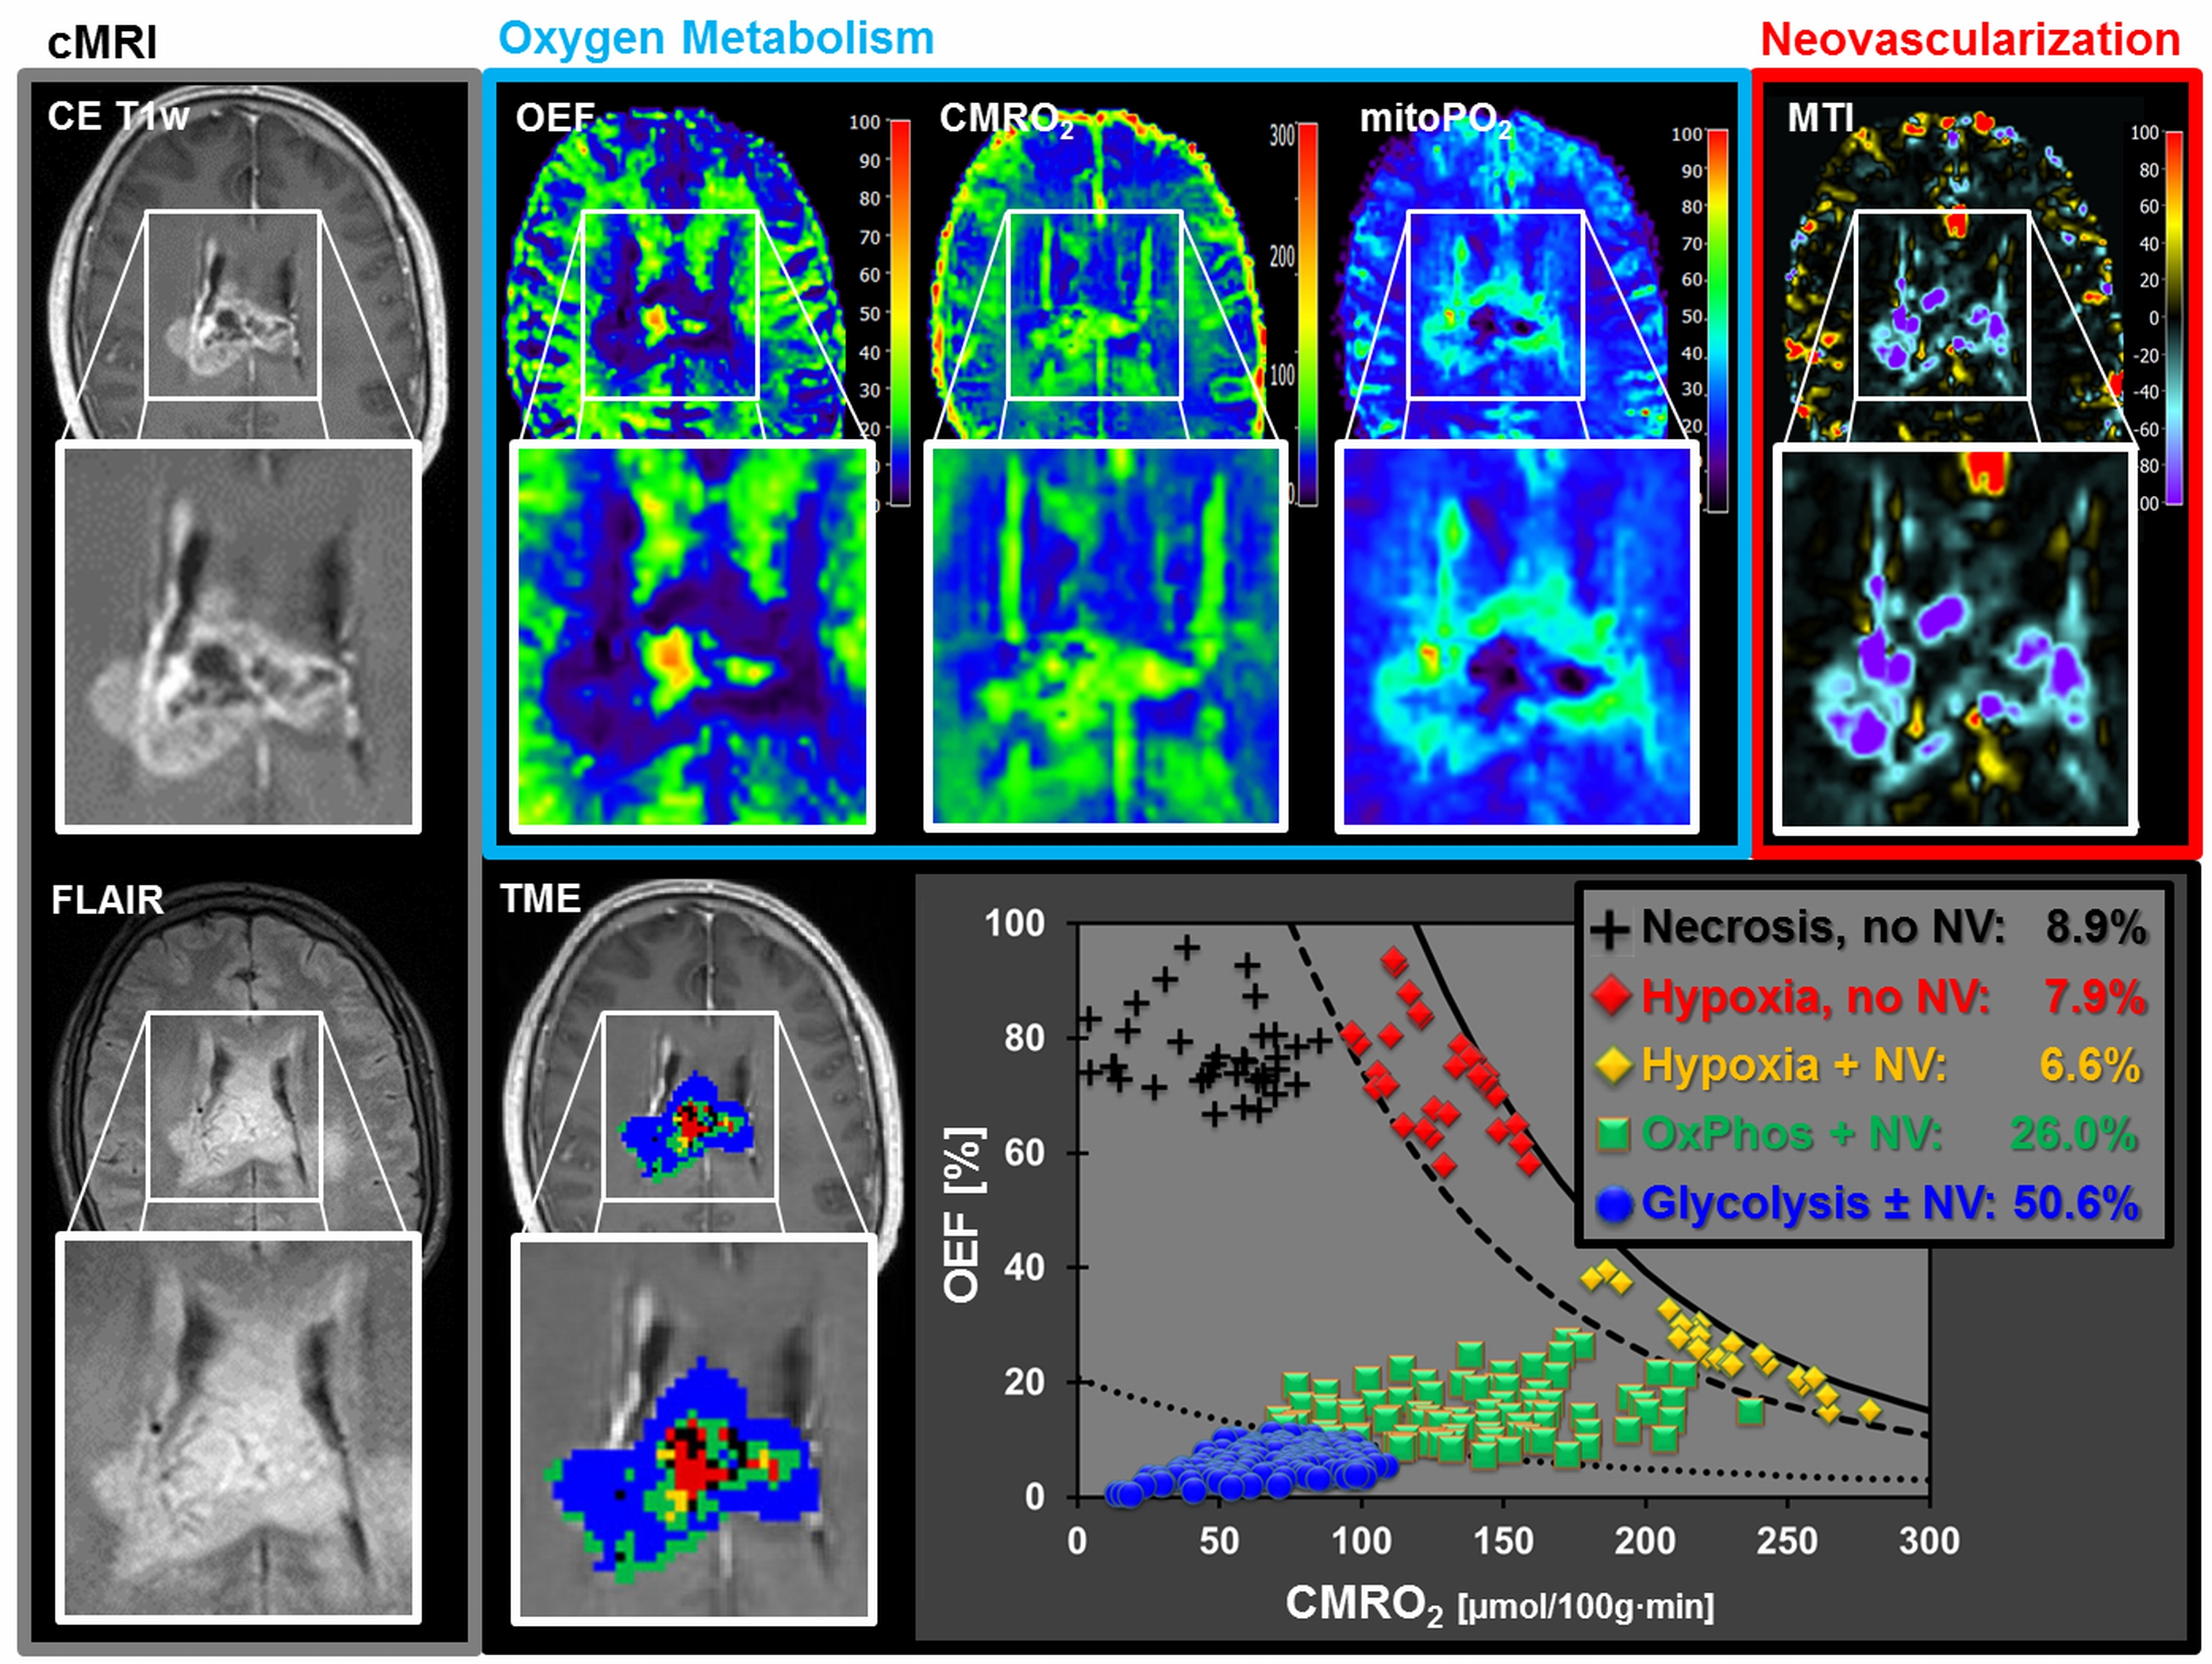
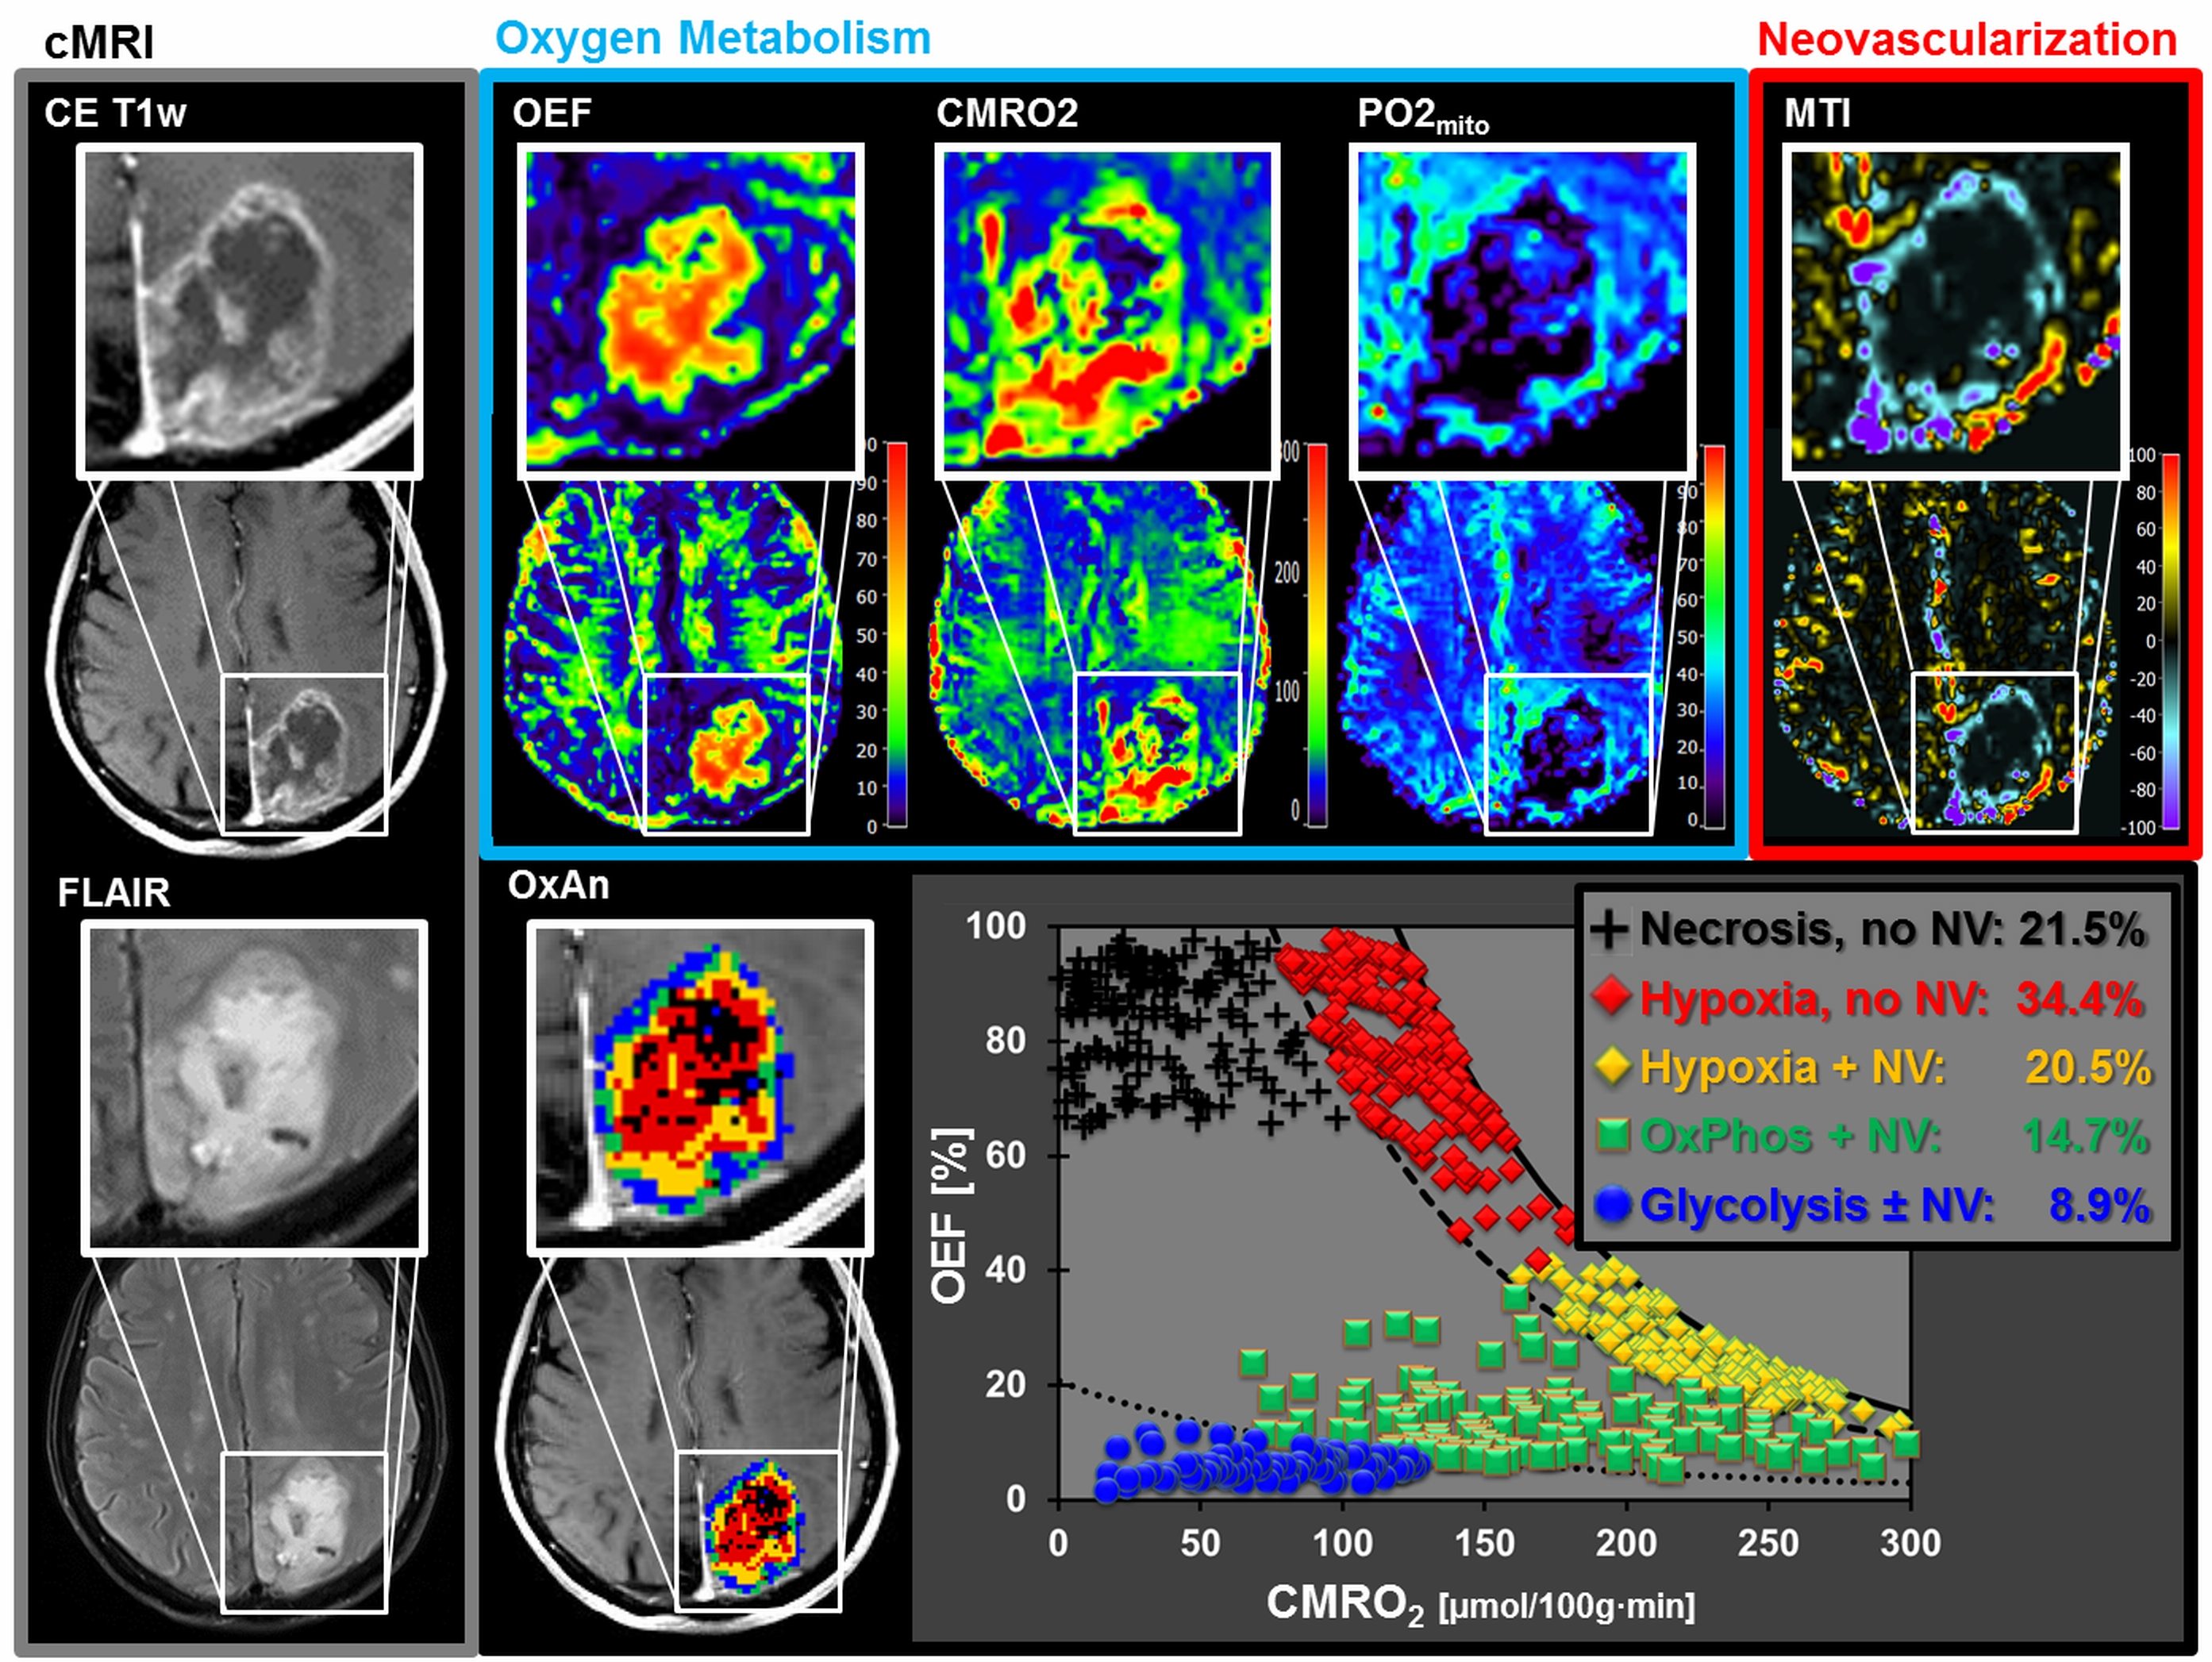
52 patients with newly-diagnosed, untreated glioblastoma (IDH1 wildtype) were examined with a physiological MRI protocol including multiparametric quantitative blood-oxygen-level-dependent (qBOLD) and vascular architecture mapping (VAM). For qBOLD, R2*- and R2-mapping (8 echoes each) was performed. For VAM we used spin-echo and gradient-echo EPI dynamic susceptibility contrast (DSC) sequences in combination with a dual contrast agent injections approach (Fig.1, phase1)(2–4). All data processing was performed with custom-made MatLab software. qBOLD data were used for calculation of MRI biomarker maps of oxygen metabolism including oxygen extraction fraction (OEF), cerebral metabolic rate of oxygen (CMRO2)(5) and the average mitochondrial oxygen tension (mitoPO2)(6,7). The VAM data were used for calculation of MRI biomarker maps of neovascularization including the microvessel type indicator (MTI) as well as the upper limit of microvessel radius (RU) and microvessel density (NU) (Fig.1, phases2 and 3)(8). Fusion of MRI biomarker information about oxygen metabolism (OEF, CMRO2, mitoPO2) and neovascularization (MTI, RU, NU) as well as classification of TME (Fig.1, phase4) consisted of four steps. (i) classification of the oxidative status in mitochondria; (ii) classification of the tumor neovasculature integrity; (iii) fusion of this classified information in one imaging data set; and (iv) classification of TME within this data set considering the CMRO2-OEF-scatterplot (Fig.1, bottom). This procedure was associated with the introduction of six different TMEs for oxygen metabolism and neovascularization: (i) TME with mitoPO2 <10mmHg and dysfunctional neovasculature: “Hypoxia, no NV”; red voxels in the TME map; (ii) TME with mitoPO2 <10mmHg with functional neovasculature: “Hypoxia+NV”; yellow; (iii) TME with mitoPO2 = 10–60mmHg and no neovascularization: “Necrosis”; black; (iv) TME with mitoPO2 = 10–60mmHg and neovascularization: “OxPhos+NV”; green; (v) TME with mitoPO2 >60mmHg and neovascularization: “Glycolysis+NV”; blue; and (vi) TME with mitoPO2 >60mmHg and no neovascularization: “Glycolysis, no NV”; blue. As described above, the voxels of each TME were assigned with different colors which resulted in the so-called oxygen metabolism-neovascularization TME map. Association of the different TME volume fractions with progression-free survival (PFS) was assessed using Kaplan-Meier analysis and Cox proportional hazard models.Results
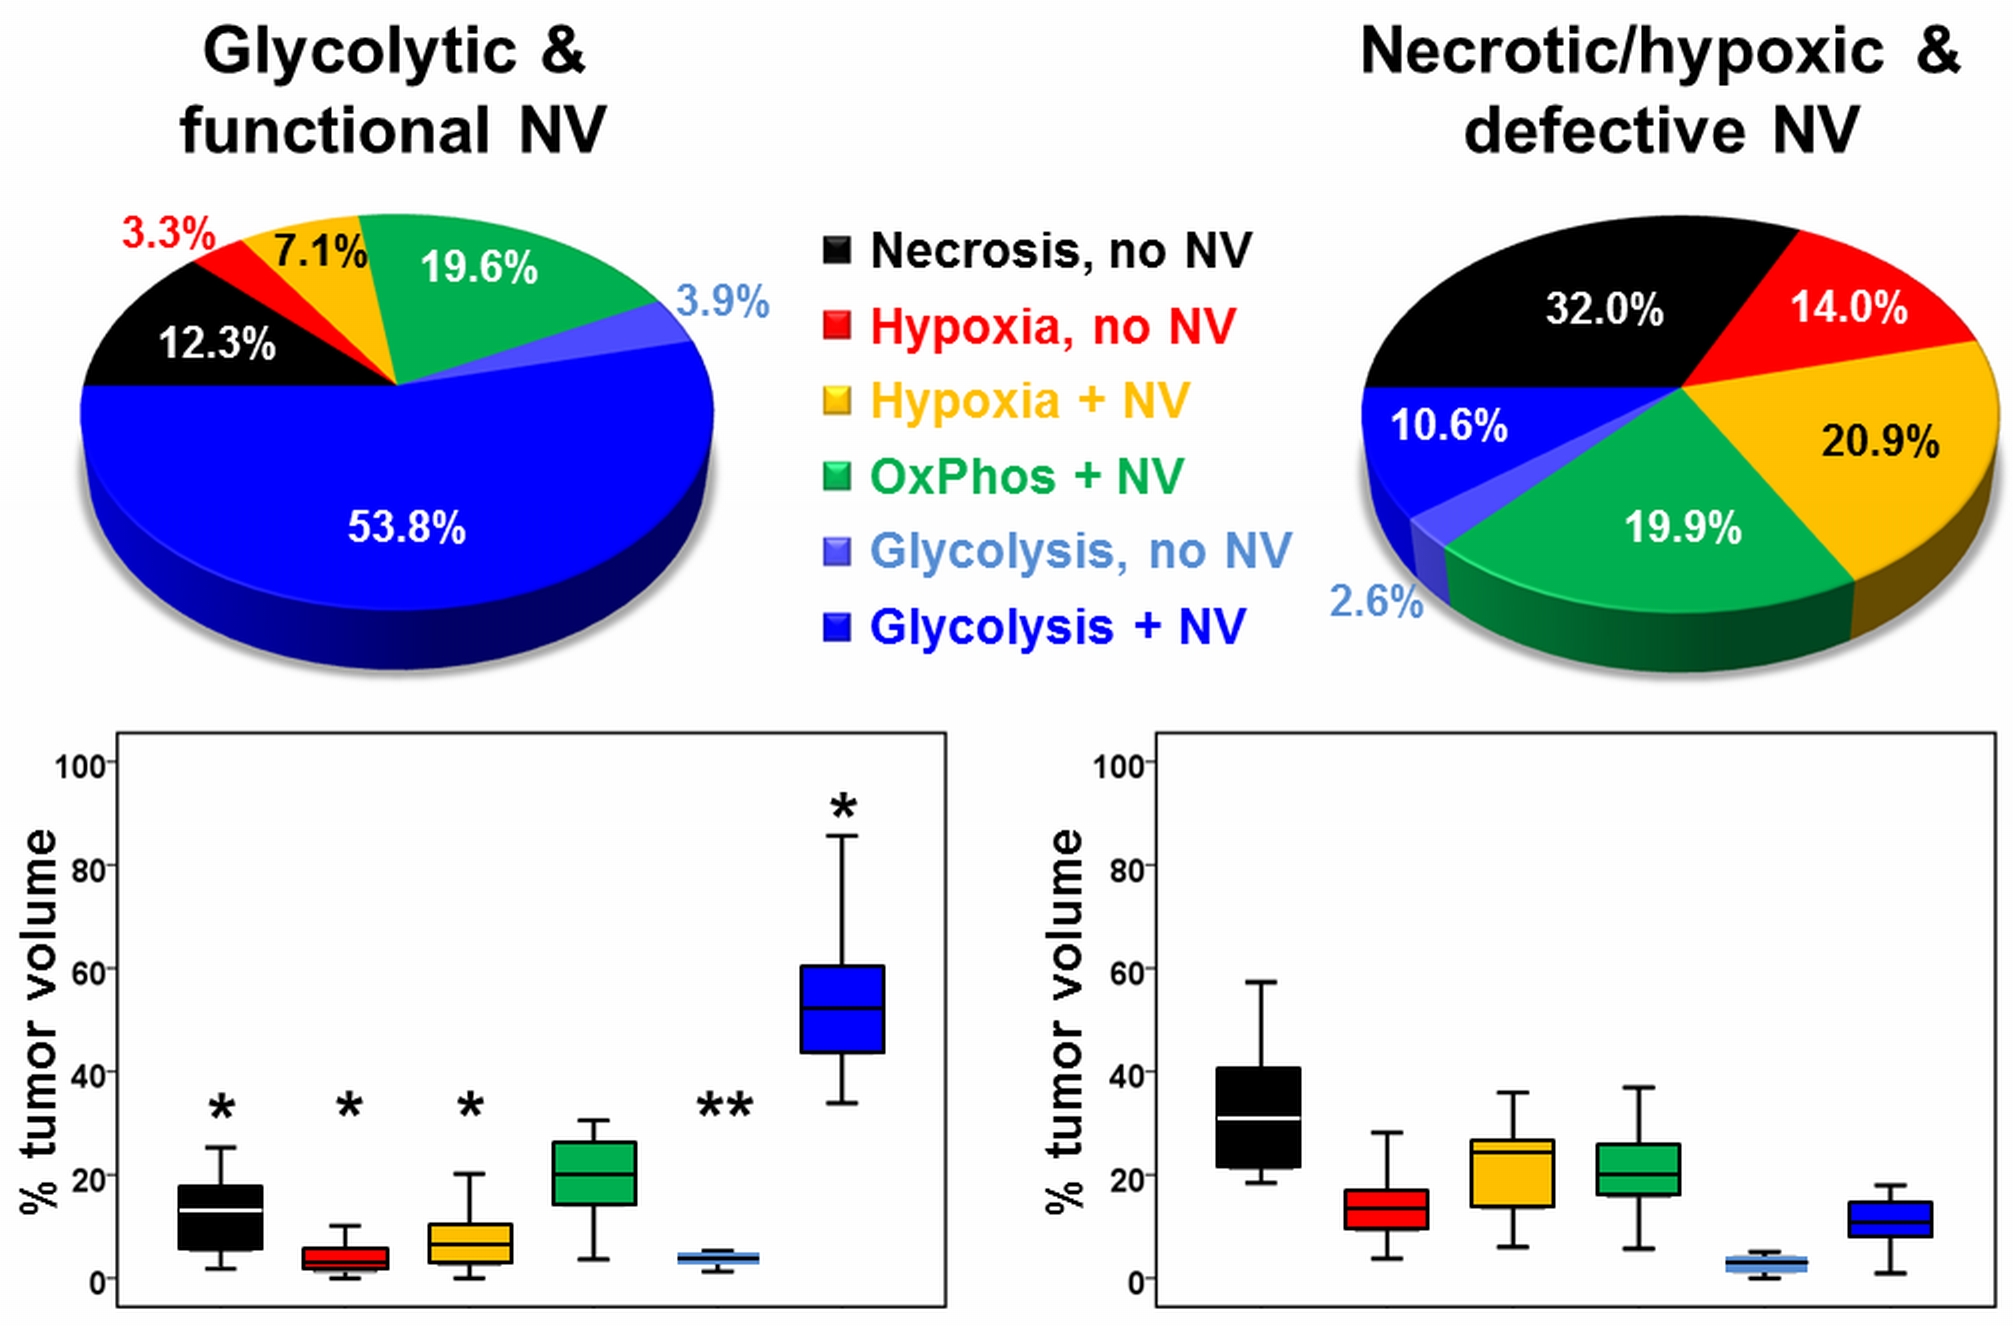
A common spatial structure of TMEs was detected: central necrosis surrounded by tumor hypoxia (with defective and functional neovasculature) and different TMEs with a predominance of OxPhos and glycolysis for energy production, respectively (Fig.2 and 3). The percentage of the different TMEs on the total tumor volume uncovered two clearly different subtypes of glioblastoma IDH1wt: a glycolytic dominated phenotype with predominantly functional neovasculature and a necrotic/hypoxic dominated phenotype with approximately 50% of defective neovasculature (Fig.4). Patients with a necrotic/hypoxic dominated phenotype showed significantly shorter PFS (P=0.035; Fig.5).Discussion
The finding of a common spatial structure of TMEs is conclusively explainable due to the known sequence of events during the development of glioblastoma obtained from preclinical studies and histopathology (9,10). The widely accepted model of glioblastoma progression includes an explanation of the relationship between pseudopalisades, angiogenesis, and aggressive clinical behavior (11,12). The glycolytic phenotype with high percentage of stable functional neovasculature is dominated by the vascular niche that provides a protective microenvironment in which glioblastoma stem cells are able to freely proliferate and remain undifferentiated and are unaffected by any external influences (13,14). In the necrotic/hypoxic phenotype with a high percentage of defective neovasculature, however, the hypoxic niche plays a major role which is associated with tumor progression and resistance to both radiotherapy and chemotherapy (10). Hypoxia promotes a more malignant phenotype of cancer cells and supports the survival of glioma stem cells which possess greater drug resistance, self-renewal potential and tumorigenicity (15,16).Conclusions
We performed fusion of imaging parameters about energy production and neovascularization (two hallmarks of cancer) and thereby gained a more precise insight into the intratumoral heterogeneity of human glioblastoma's pathophysiology. Our non-invasive mapping approach allows for the user-independent classification of TMEs and the detection of hypoxic and vascular niches in glioblastoma. This enabled us to identify patient subgroups with significant different PFS.Acknowledgements
No acknowledgement found.References
1. Vartanian A, Singh SK, Agnihotri S, Jalali S, Burrell K, Aldape KD, Zadeh G. GBM’s multifaceted landscape: Highlighting regional and microenvironmental heterogeneity. Neuro. Oncol. 2014;16:1167–1175.
2. Stadlbauer A, Zimmermann M, Heinz G, Oberndorfer S, Doerfler A, Buchfelder M, Rössler K. Magnetic resonance imaging biomarkers for clinical routine assessment of microvascular architecture in glioma. J. Cereb. Blood Flow Metab. 2017;37:632–643.
3. Stadlbauer A, Zimmermann M, Kitzwögerer M, Oberndorfer S, Rössler K, Dörfler A, Buchfelder M, Heinz G. MR Imaging–derived Oxygen Metabolism and Neovascularization Characterization for Grading and IDH Gene Mutation Detection of Gliomas. Radiology 2016;283:799–809.
4. Hsu Y-Y, Yang W-S, Lim K-E, Liu H-L. Vessel size imaging using dual contrast agent injections. J. Magn. Reson. Imaging 2009;30:1078–84.
5. Christen T, Schmiedeskamp H, Straka M, Bammer R, Zaharchuk G. Measuring brain oxygenation in humans using a multiparametric quantitative blood oxygenation level dependent MRI approach. Magn Reson Med 2012;68:905–911.
6. Gjedde A. Cerebral blood flow change in arterial hypoxemia is consistent with negligible oxygen tension in brain mitochondria. Neuroimage 2002;17:1876–1881.
7. Vafaee MS, Vang K, Bergersen LH, Gjedde A. Oxygen consumption and blood flow coupling in human motor cortex during intense finger tapping: implication for a role of lactate. J. Cereb. Blood Flow Metab. 2012;32:1859–68.
8. Jensen JH, Lu H, Inglese M. Microvessel density estimation in the human brain by means of dynamic contrast-enhanced echo-planar imaging. Magn. Reson. Med. 2006;56:1145–1150.
9. Rong Y, Durden DL, Van Meir EG, Brat DJ. “Pseudopalisading” necrosis in glioblastoma: a familiar morphologic feature that links vascular pathology, hypoxia, and angiogenesis. J. Neuropathol. Exp. Neurol. 2006;65:529–39.
10. Hardee ME, Zagzag D. Mechanisms of glioma-associated neovascularization. Am. J. Pathol. 2012;181:1126–1141.
11. Brat DJ, Castellano-Sanchez A, Kaur B, Van Meir EG. Genetic and biologic progression in astrocytomas and their relation to angiogenic dysregulation. Adv. Anat. Pathol. 2002;9:24–36.
12. Holash J, Maisonpierre PC, Compton D, et al. Vessel cooption, regression, and growth in tumors mediated by angiopoietins and VEGF. Science. 1999;284:1994–8.
13. Calabrese C, Poppleton H, Kocak M, et al. A Perivascular Niche for Brain Tumor Stem Cells. Cancer Cell 2007;11:69–82.
14. Gilbertson RJ, Rich JN. Making a tumour’s bed: glioblastoma stem cells and the vascular niche. Nat. Rev. Cancer 2007;7:733–736.
15. Bao S, Wu Q, McLendon RE, Hao Y, Shi Q, Hjelmeland AB, Dewhirst MW, Bigner DD, Rich JN. Glioma stem cells promote radioresistance by preferential activation of the DNA damage response. Nature 2006;444:756–760.
16. Galli R, Binda E, Orfanelli U, Cipelletti B, Gritti A, De Vitis S, Fiocco R, Foroni C, Dimeco F, Vescovi A. Isolation and characterization of tumorigenic, stem-like neural precursors from human glioblastoma. Cancer Res. 2004;64:7011–7021.
Figures