0952
Multiscale measurement of the effects of glucose starvation on 4T1 murine breast cancer cells using an MRI and optical microscopy compatible bioreactor1Medical Physics, University of Wisconsin - Madison, Madison, WI, United States, 2Morgridge Institute for Research, Madison, WI, United States, 3Laboratory for Optical and Computational Instrumentation (LOCI), University of Wisconsin - Madison, Madison, WI, United States, 4Cell and Regenerative Biology, University of Wisconsin - Madison, Madison, WI, United States, 5Biomedical Engineering, University of Wisconsin - Madison, Madison, WI, United States, 6Radiology, University of Wisconsin - Madison, Madison, WI, United States
Synopsis
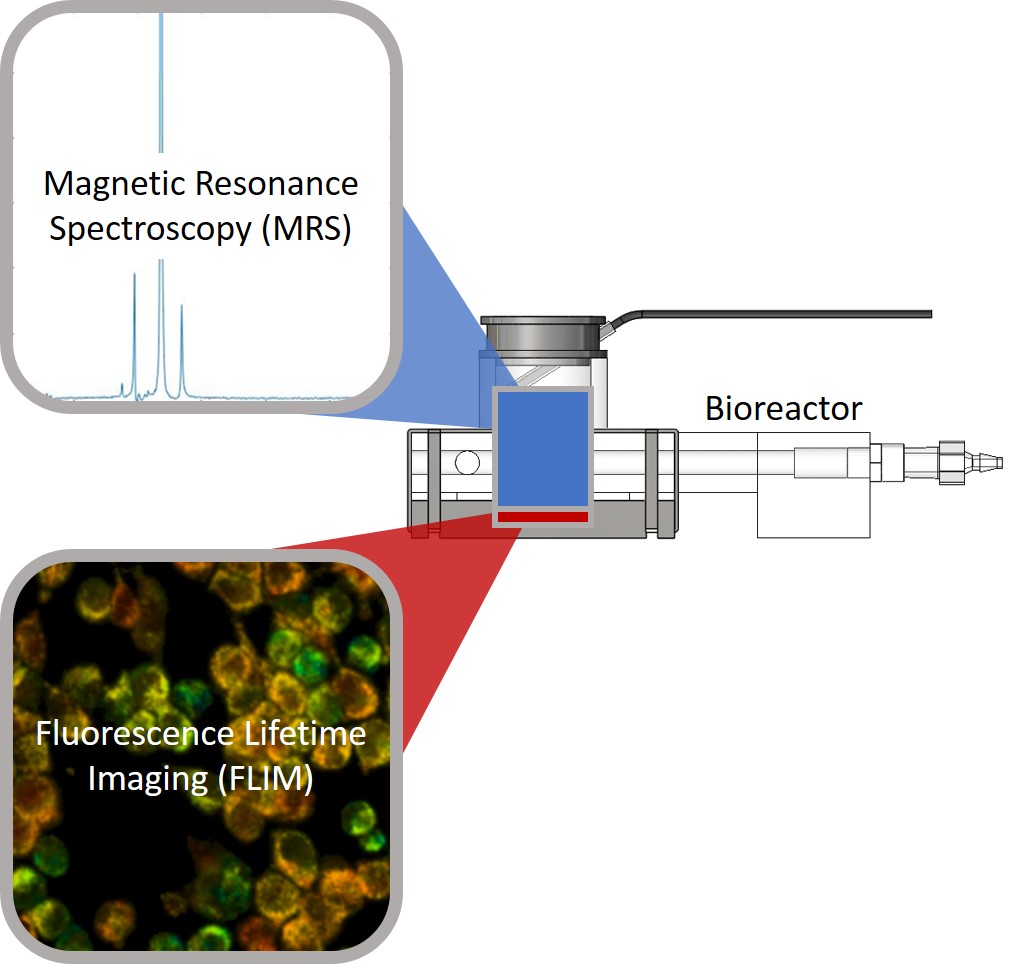
The design and application of a novel bioreactor capable of facilitating both magnetic resonance spectroscopy (MRS) and optical fluorescence microscopy for complementary metabolic information is described. Fluorescence lifetime imaging (FLIM) of nicotinamide adenine dinucleotide (NADH) and hyperpolarized [1-13C] pyruvic acid (PA) MRS were performed on 3D cell cultures of 4T1 murine breast cancer cells to study the effects of glucose starvation across cellular and population scales. The system provides a novel test-bed for simulating cell-matrix and cell-cell interactions in a 3D microenvironment for investigating multi-scale cellular metabolism in vitro.
Purpose
Tumor metabolism is an important feature and potential therapy target in cancer1. However, many aspects of the metabolism of tumor cells are not fully understood. Fluorescence lifetime imaging (FLIM)2 based optical microscopy and hyperpolarized 13C magnetic resonance spectroscopy (MRS)3 are methods that enable in vitro and in vivo measurement of cellular metabolism. FLIM measures the rate of decay of a molecule’s fluorescence, including the metabolic cofactor nicotinamide adenine dinucleotide (NADH) whose fluorescence lifetime depends on its protein binding state allowing visualization of metabolic processes that are dominant within a cell4. Hyperpolarized MRS most commonly uses hyperpolarized [1-13C] pyruvic acid to measure metabolic products of glycolysis, especially lactate production. As these techniques occur on very different scales they can yield complementary information at the individual cell and entire population scales (Figure 1). Here, we present a multi-modal and multi-scale study of the effects of glucose starvation on 4T1 murine breast cancer cell metabolism using a novel MRI and optical microscopy compatible bioreactor capable of combined MRS and NADH FLIM in 3D cell cultures comprised of collagen gels that mimic the tumor microenvironment.Methods
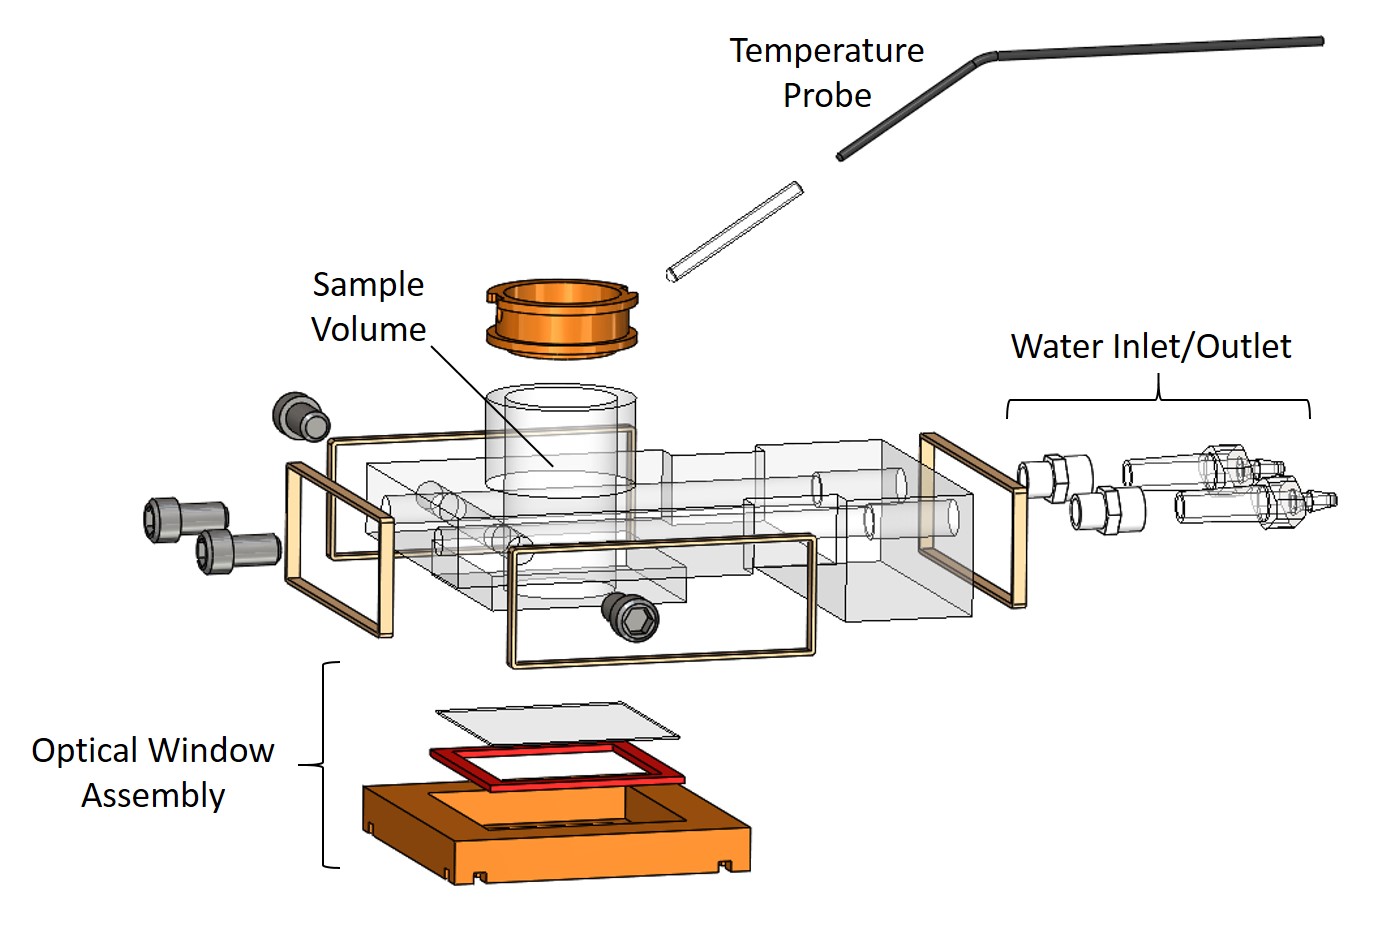
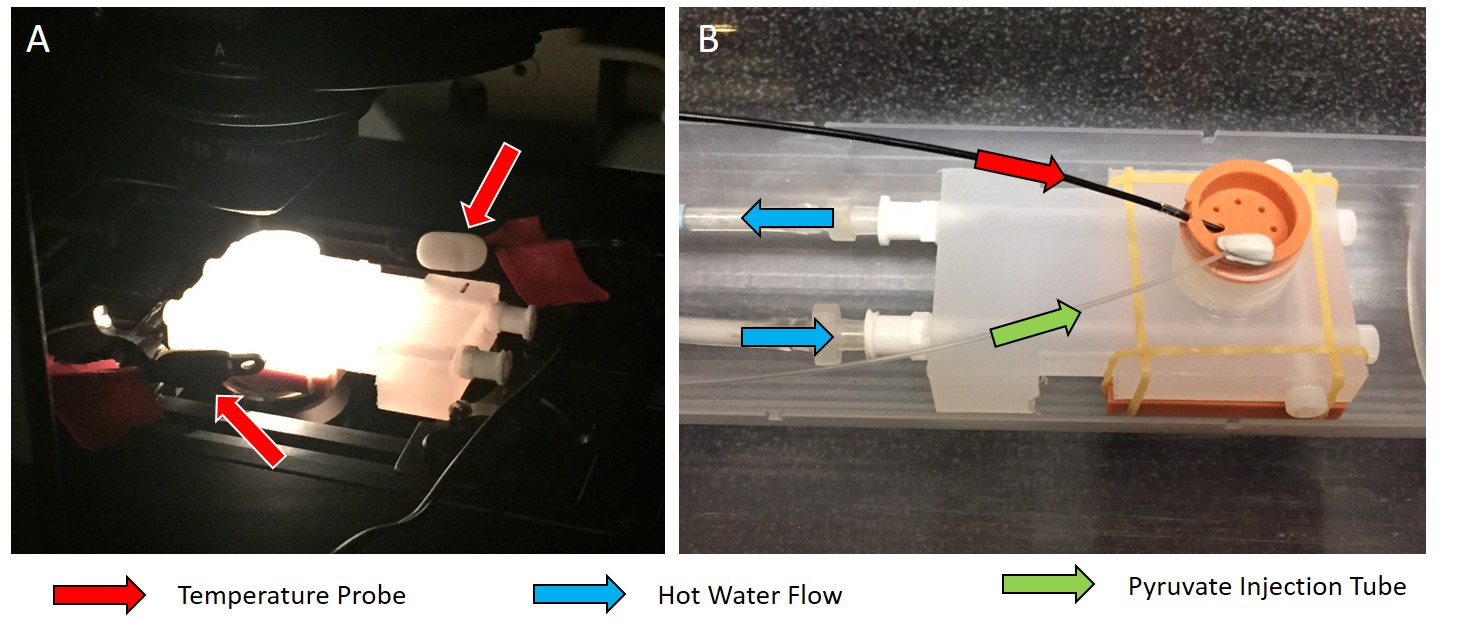
The bioreactor (Figure 2) was designed using SolidWorks (Dassault Systemes, Velizy-Villacoublay, France). The experimental setups for both optical microscopy and MRS experiments are shown in Figure 3. Temperature feedback is achieved with two independent sample probes for optical imaging and with an MR-compatible temperature probe for MRS experiments.
4T1 murine breast cancer cells5 in normal growth media were compared to 4T1 cells in glucose-free media to study the effects of glucose starvation. Collagen gels were polymerized as previously described6. In brief, collagen was neutralized with 2x HEPES buffer, then further diluted to 2mg/mL with cells and media. Approximately 8 million cells were used per replicate. After polymerization of collagen, cells were allowed to incubate for 1-2 hours prior to experiments. For the glucose-free state, glucose-free media was used for this incubation period. Optical imaging was performed with a 20x air objective on a custom multiphoton laser scanning system built around an inverted Nikon TE300 microscope7. MRS experiments were performed in a 4.7T preclinical MRI scanner (Agilent, Palo Alto, CA).
For MRS experiments, 30µL aliquots of [1- 13C]PA (Cambridge Isotope Laboratories Inc., Tewksbury, MA) and 15mM trityl radical (Ox063, GE Healthcare) were polarized in a Hypersense polarizer (Oxford Instruments) for ~1 hour8. Samples were dissoluted with 4mL of solvent containing 1.2mL 426mM NaOH, 1.4mL 400 mM Tris buffer and 1.4mL 250mg/L EDTA. [1-13C]PA was drawn off and 400µL were rapidly injected into the sample volume of the bioreactor. Dynamic global spectra (FA=10º, TR=3000ms) were acquired with a dual-tuned 1H/13C volume coil (Doty Scientific, Columbia, SC). N=9 FLIM (3 each from 3 bioreactor preparations) and N=5 MRS (2 bioreactors were prepared for each state in addition to the 3 used for combined studies) measurements were aquired for each state.
Results
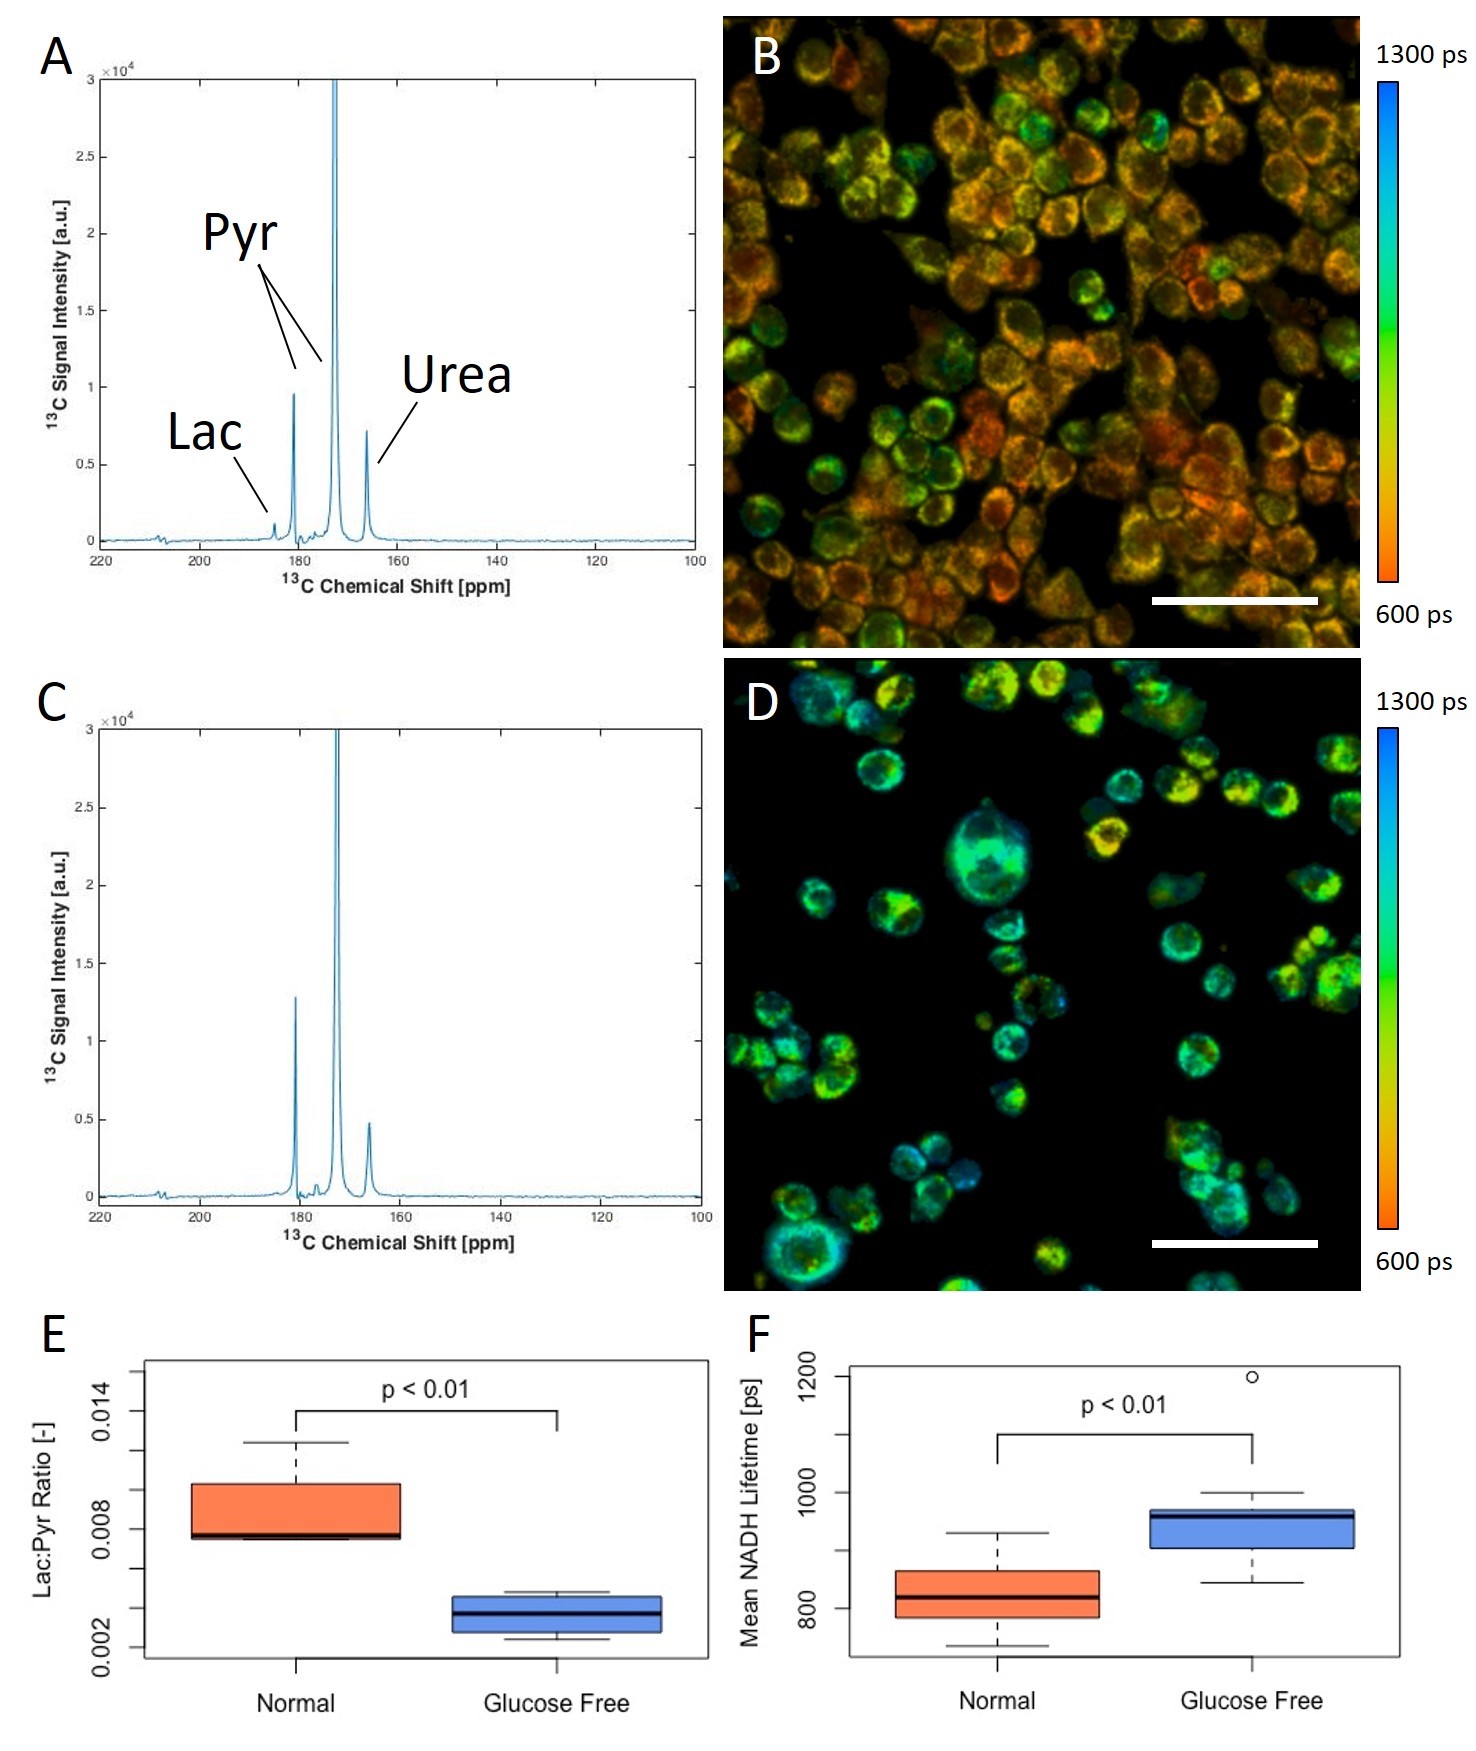
MRS results showed a significant decrease (p<0.01) in lactate production of 4T1 cells in the glucose-free state compared to the normal state (Figure 4). NADH lifetime results showed a corresponding increase in mean NADH lifetime of 4T1 cells from the normal state to the glucose-free state (p<0.01) (Figure 4). 4T1 cells in the glucose-free state are also less densely clumped together and have a rounder overall shape than those in the normal state (Figure 4B vs. 4D).Discussion
Here, multi-scale imaging was used to investigate the juxtaposition of cellular and population level changes in metabolism in response to glucose starvation. Changes in lactate production at the population level, coincided with changes in the chemical bound state of NADH and morphological changes at the cellular level between normal and glucose-starved 4T1 cells. Both changes suggest a shift away from glycolysis in the glucose-free state. This could indicate other metabolic processes at work, cells beginning to die of starvation or both, as the 4T1 strain is known to be a metastatic cell line that heavily depends on glycolysis9. Future work will aim to investigate more precise inhibition of metabolic pathways in concert with markers of apotosis and recovery after reintroduction of glucose and lactate substrates in a wider range of breast cancer cell lines.Conclusion
Hyperpolarized [1-13C] PA MRS (global metabolism) and NADH fluorescence lifetime (cellular metabolism) were performed on 4T1 murine breast cancer cells under normal and glucose-starved conditions, showing a shift away from glycolysis in the glucose-starved state at both the population and cellular scales. This system represents a novel approach to achieving multimodal and multiscale measurement of metabolism in 3D cell cultures.Acknowledgements
Funding for this project was provided by The Morgridge Institute for Research, the Departments of Medical Physics and Radiology at UW-Madison, UL1TR000427 to UW ICTR from NIH/NCATS and the AAPM 2014 Graduate Fellowship.References
- L. M. Phan, S.-C. J. Yeung, M.-H. Lee. Cancer metabolic reprogramming: importance, main features, and potentials for precise targeted anti-cancer therapies. Cancer Biol Med. 2014; 11(1):1-19.
- C.-W. Chang, D. Sud, M.-A. Mycek. Fluorescence lifetime imaging microscopy. Methods Cell Biol. 2007; 81:495-524.
- F. A. Gallagher, S. E. Bohndiek, M. I. Kettunen, D. Y. Lewis, D. Soloviev K. M. Brindle. Hyperpolarized 13C MRI and PET: in vivo tumor biochemistry. J Nucl Med Off Publ Soc Nucl Med. 2011; 52(9):1333-1336.
- D. S. Elson, I. Munro, J. Requejo-Isidro, J. McGinty, C. Dunsby, N. Galletly, G. W. Stamp, M. a. A. Neil, M. J. Lever, P. A. Kellett, A. Dymoke-Bradshaw, J. Hares, P. M. W. French. Real-time time-domain fluorescence lifetime imaging including single-shot acquisition with a segmented optical image intensifier. New J Phys. 2004; 6(1):180.
- S.A. DuPré, D. Redelman, K.W. Hunter. The Mouse Mammary Carcinoma 4T1: Characterization of the Cellular Landscape of Primary tumours and Metastatic Tumour Foci. Int J Exp Pathol. 2007; 88(5):351-360.
- B. Burkel, B. A. Morris, S. M. Ponik, K. M. Riching, K. W. Eliceiri, P. J. Keely. Preparation of 3D Collagen Gels and Microchannels for the Study of 3D Interactions In Vivo. J Vis Exp JoVE. 2011; 111.
- D.L. Wokosin, J.M. Squirrell, K.W. Eliceiri, J.G. White. Optical workstation with concurrent, independent multiphoton imaging and experimental laser microbeam capabilities. Rev Sci Instrum. 2003; 74(1):193-201.
- J. W. Gordon, D. J. Niles, E. B. Adamson, K. M. Johnson, S. B. Fain. Application of Flow Sensitive Gradients for Improved Measures of Metabolism Using Hyperpolarized 13C MRI. Magn Reson Med. 2016; 75(3):1242-1248.
- B.A. Morris, B. Burkel, S.M. Ponik, J. Fan, J.S. Condeelis, J.A. Aguirre-Ghiso, J. Castracane, J.M. Denu, P.J. Keely. Collagen Matrix Density Drives the Metabolis Shift in Breast Cancer Cells. eBioMedicine. 2016; 13:146-156.
Figures