0931
Myelin water fraction, diffusion tensor imaging, and g-ratio measurements characterize myelin changes in normative aging, mild cognitive impairment, and dementia1National Institutes of Health, Baltimore, MD, United States
Synopsis
In previous work, we showed evidence of myelin loss with mild cognitive impairment (MCI) using a direct and specific MRI measure of myelin water fraction, a surrogate for myelin content. Here, we extend this by investigating changes in myelin content in normative aging, MCI, and dementia using myelin content, diffusion tensor imaging, and g-ratio measurements. Our results showed decrease in myelin content in several brain regions of the subjects diagnosed with MCI or dementia in comparison with the old healthy subjects. Higher myelin content in middle-aged subjects was also observed, in agreement with the literature.
PURPOSE
An emerging hypothesis implicates loss of myelin as an important pathophysiologic correlate of mild cognitive impairment (MCI) and dementia (1-4). Indeed, white matter abnormalities occur even in the presymptomatic stages of Alzheimer's disease (AD) (5). Previous investigations have relied upon conventional, indirect measurements of myelin content including relaxation times, magnetization transfer, and diffusion imaging. In an earlier study, we showed evidence of regional brain myelin loss in MCI using a direct measure of myelin water fraction (MWF), a surrogate for myelin content (6). In this work, we extend our analysis to investigate myelin content changes using MWF and diffusion tensor imaging (DTI) measures, namely, the fractional anisotropy (FA), and mean, axial, and radial diffusivity (MD, AxD, RD), in the brains of healthy young and old subjects, and subjects with documented MCI, AD, and vascular dementia (VD). We also investigated the ratio between the inner and the outer diameter of the myelin sheath computed through the myelin g-ratio, using the neurite orientation dispersion and density imaging (NODDI)-DTI model (7), a simplification of the NODDI model (8-9).MATERIAL & METHODS
Experimental design
Eight subjects were studied: two healthy middle-aged controls (males, ages 45 and 47), two healthy old controls (males, ages 80 and 84), two old subjects with documented MCI (female, age 84, and male, age 89), one subject with AD (female, age 72), and one subject with VD (male, age 75). Scans were performed on a 3T Philips Achieva MRI system equipped with an eight-channel phased-array head coil. For each volunteer, the imaging protocol included:
• mcDESPOT for MWF mapping (10-12): 3D SPGR and bSSFP images were acquired over a sequence of flip angles (FAs) and with short repetition times (TRs). bSSFP images were acquired twice, with phase increment of 0 or π to correct for off-resonance effects. Voxel size was 1.6mm x 1.6mm x 1.6mm. Low-resolution fast spin-echo images with two different excitation FAs were acquired to correct for B1 inhomogeneity using the double-angle method (13). Total acquisition time was ~ 20 min.
• DTI for FA, MD, AxD, and RD mapping: Diffusion-weighted images were acquired with a spin-echo echo-planar-imaging sequence, with: TR = 10.7 s, echo time (TE) = 69 ms, and b-value of 0 and 700 s/mm2 (encoded in 32 directions). Voxel size was 2mm x 2mm x 2mm, and acquisition time was ~ 6 min.
All images were acquired with SENSE factor of 2 and a large field-of-view of 240mm x 208mm x 150mm, and reconstructed to an isotropic voxel volume of 1 mm3.
MWF, FA, MD, AxD, RD, and g-ratio mapping
MWF maps were calculated using the Bayesian Monte Carlo analysis of the two-component echo-time-corrected mcDESPOT signal model (10-12). FA, MD, AxD, RD, and eigenvalue maps were generated from the DTI data, using FSL software (14). Derived MWF, MD, and DTI-eigenvalues maps were used to map the g-ratio, using myelin volume fraction obtained from MWF (15). Axonal volume fraction was calculated from the volume fraction of the intraneurite compartment, derived from the MD and DTI-eigenvalues, using the NODDI-DTI model (7). Given the limited cohort in this study, analysis was limited to visual inspection of parameter maps.
RESULTS & DISCUSSION
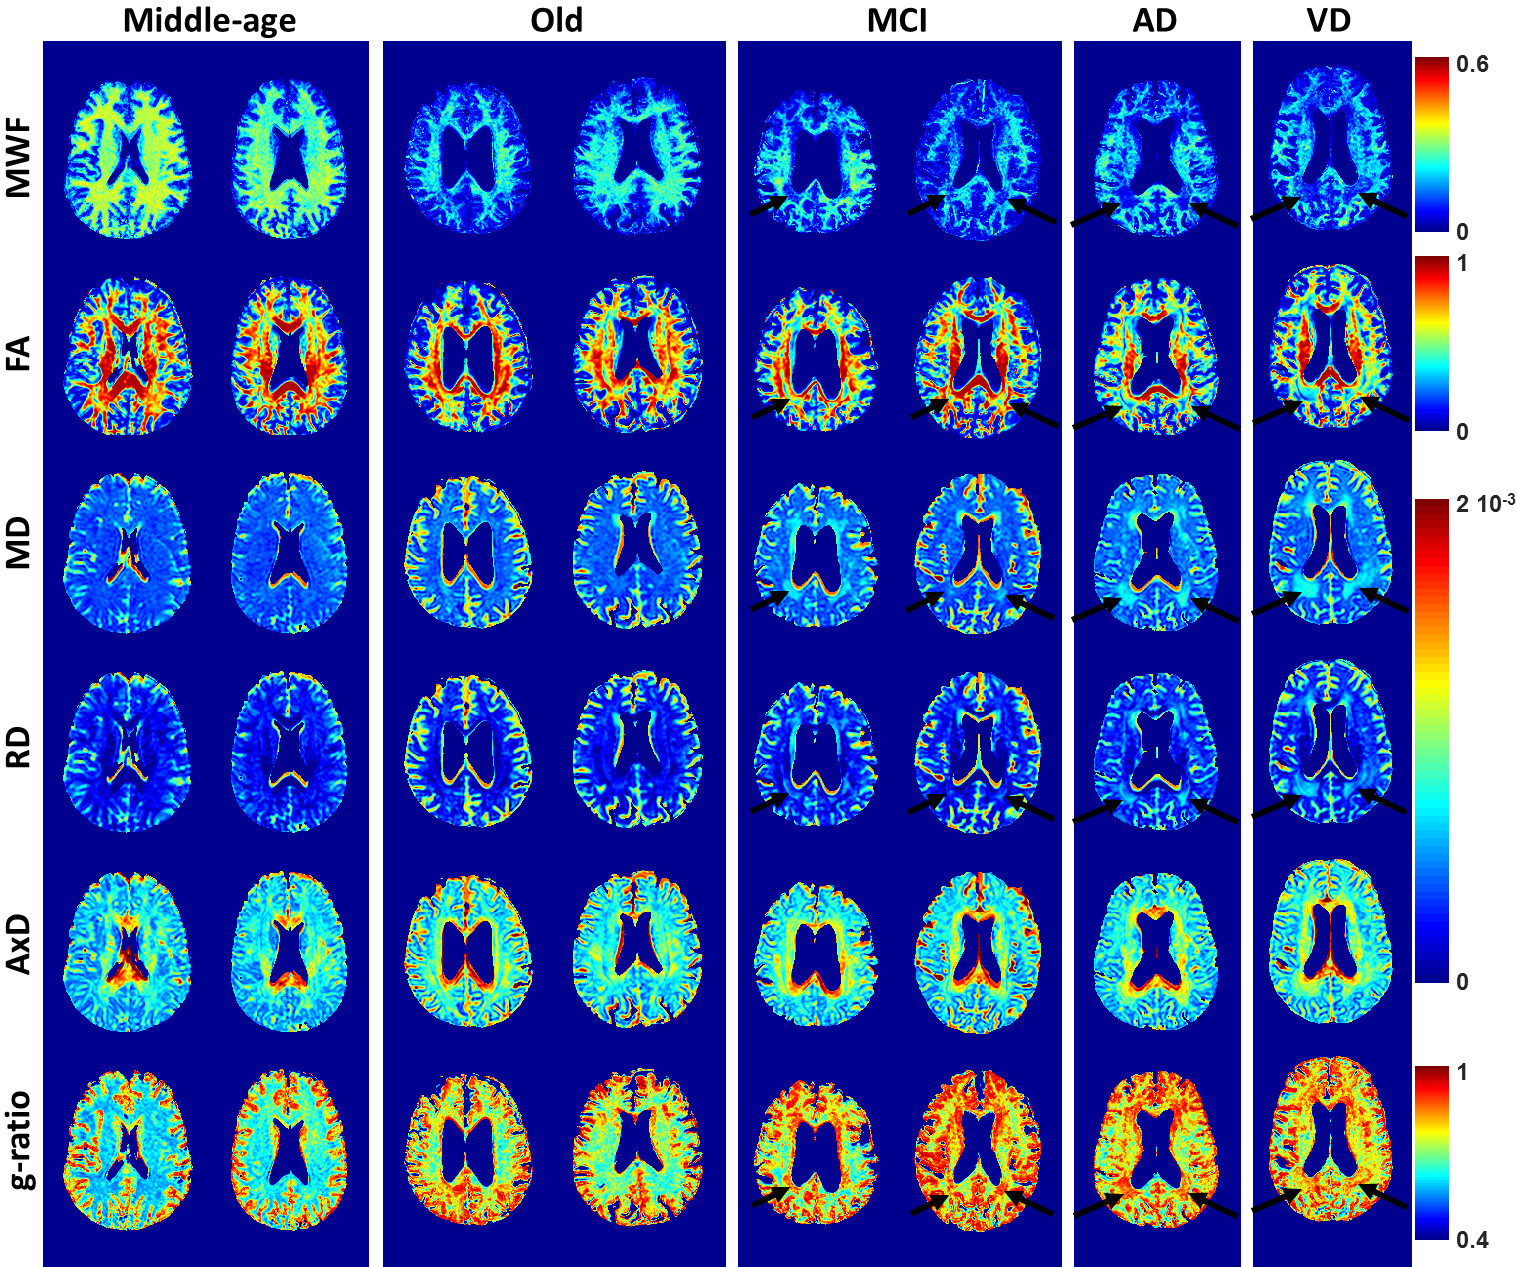
Figure: Visual inspection of parameter maps showed decreased MWF in several brain regions (black arrows) of the subjects diagnosed with MCI, AD, or VD in comparison with the old controls. As expected, the MWF decrease was accompanied by an increase in both MD and RD and a decrease in FA. These results suggest a decrease in the lipid-rich myelin sheath and replacement of myelin by less-restricted cellular water (1-6). This is further supported by the increase in g-ratio and the negligible changes in AxD in those regions. These preliminary DTI results are, overall, in agreement with the literature (16-17). Furthermore, our results showed greater regional demyelination in AD and VD when compared to that in MCI. Longitudinal studies may indicate whether the degree of demyelination in MCI represents a prognostic indicator.
Finally, parameter maps showed a substantial decrease in MWF and an increase in g-ratio in old subjects as compared to middle-aged subjects, as expected (18). However, changes in DTI measures with age was not conclusive. This is likely due to the insensitivity of DTI to water diffusion between myelin sheaths resulting from use of long TE relative to the short T2 of MWF (18).
CONCLUSIONS
Our results show the first demonstration of myelin content alterations in normative aging, MCI, AD, and VD, using a direct measure of MWF, DTI, and g-ratio mapping. This motivates study of a larger cohort for quantitative statistical analyses.Acknowledgements
This work was supported by the Intramural Research Program of the National Institute on Aging of the National Institutes of Health.References
1. Bartzokis G. Age-related myelin breakdown: a developmental model of cognitive decline and alzheimer’s disease. Neurobiol Aging 2004a;25:5-18.
2. Bartzokis G, Lu PH, Mintz J. Human brain myelination and amyloid beta deposition in Alzheimer’s disease. Alzheimer’s Dementia: J. Alzheimer’s Assoc. 2007b;3:122-125.
3. Bartzokis G. Alzheimer’s disease as homeostatic responses to age-related myelin breakdown. Neurobiol Aging 2011;32(8):1341-1371.
4. Carmeli C, Donati A, Antille V, Viceic D, Ghika J, et al. Demyelination in mild cognitive impairment suggests progression path to Alzheimer's disease. PLoS One. 2013 ;30;8(8):e72759.
5. Sachdev PS, Zhuang L, Braidy N, Wen W. Is Alzheimer's a disease of the white matter? Curr Opin Psychiatry 2013;26(3):244-251.
6. Bouhrara M, Reiter DA, Bergeron CM, Zukley LM, Resnick SM, et al. Demyelination in mild cognitive impairment. ISMRM 2017; 2347, Honolulu, HI, USA.
7. Edwards LJ, Pine KJ, Weiskopf N, Mohammadi S. NODDI-DTI: extracting neurite orientation and dispersion parameters from a diffusion tensor. BioRxiv 2017;dx.doi.org/10.1101/077099.
8. Zhang H, Schneider T, Wheeler-Kingshott CA, Alexander DC. NODDI: practical in vivo neurite orientation dispersion and density imaging of the human brain. Neuroimage 2012 ;61(4):1000-1016.
9. Campbell JSW, Leppert IR Narayanan S, Boudreau M, Duval T, et al. Promise and pitfalls of g-ratio estimation with MRI. Neuroimage. 2017:S1053-8119(17)30685-7.
10. Bouhrara M, Spencer RG. Improved determination of the myelin water fraction in human brain using magnetic resonance imaging through Bayesian analysis of mcDESPOT. NeuroImage 2016;127:456-71.
11. Bouhrara M, Spencer RG. Rapid Simultaneous High-resolution Mapping of Myelin Water Fraction and Relaxation Times in Human Brain using BMC-mcDESPOT. NeuroImage 2017 ;147:800-811.
12. Bouhrara M, Spencer RG. Incorporation of nonzero echo times in the SPGR and bSSFP signal models used in mcDESPOT. Magn Reson Med 2015;74(5):1227-1235.
13. Stollberger R, Wach P. Imaging of the active B1 field in vivo. Magn Reson Med 1996;35(2):246-251.
14. Jenkinson M, Beckmann CF, Behrens TE, Woolrich MW, Smith SM. FSL. NeuroImage 2012 ;62:782-90.
15. Jung W, Lee J, Shin HG, Nam Y, Zhang H, et al. Whole brain g-ratio mapping using myelin water imaging (MWI) and neurite orientation dispersion and density imaging (NODDI). Neuroimage 2017;S1053-8119(17)30801-7.
16. Oishi K, Mielke MM, Albert M, Lyketsos CG, Mori S. DTI Analyses and Clinical Applications in Alzheimer’s Disease. J Alzheimers Dis 2011;26:287-296.
17. Nir TM, Jahanshad N, Villalon-Reina JE, Toga AW, Jack CR, et al. Effectiveness of regional DTI measures in distinguishing Alzheimer's disease, MCI, and normal aging. Neuroimage Clin 2013 ;3:180-195.
18. Arshad M, Stanley JA, Raz N. Adult age differences in subcortical myelin content are consistent with protracted myelination and unrelated to diffusion tensor imaging indices. Neuroimage 2016;143:26-39.
Figures