0930
Evidence of altered myelination in adolescents with Attention-Deficit/Hyperactivity Disorder: A multi-echo T2 imaging study1Psychiatry and Behavioral Neurosciences, Wayne State University School of Medicine, Detroit, MI, United States
Synopsis
Attention-deficit/hyperactivity disorder (ADHD) is a highly prevalent childhood disorder with considerable evidence of a developmental basis for the etiology of ADHD. Structural neuroimaging studies, though limited in its interpretation, have implicated cortical and subcortical white matter in ADHD. Here we examine myelin content and axonal size/packing density in adolescents with ADHD in six white matter tracts using multi-echo T2 (ME-T2) imaging. Results show reduced myelin content as well as smaller axonal size (increased axonal packing density), which is suggestive of a lack of progressive myelination in commissural and projection tracts in ADHD.
Introduction
Attention-deficit/hyperactivity disorder (ADHD) is a highly prevalent neurodevelopmental disorder in children impairing executive functions that is not fully understood. Structural neuroimaging studies have implicated cortical and subcortical white matter1-3 including the shape of the striatum4 and the growth rate of the cross-sectional area of the genu of the corpus callosum5 in ADHD. However, volume/cross-sectional area measurements and DTI metrics are limited in its interpretation with respect to providing information directly related to the myelin macrostructure in white matter6,7. The myelin sheath that wraps around axons (or white matter fibers) plays a key role in transmitting signal across fibers. The speed at which signals are transmitted is directly proportional to the number of wraps of the myelin sheath around axons, which also correlates with caliber of axons (i.e., axonal size). A disruption in the myelination of axons, either in myelin wraps (myelin content) or axonal size, may, therefore, cause a dysfunction in the transmission of signal in white matter fiber and provide an underlying mechanism related to symptoms and cognitive deficits in ADHD. Quantitative measurements reflecting myelin content and axonal size/density can be estimated by modeling the multi-T2 components of water in ME-T2 imaging data6,7,8. The signal amplitude of the short T2 component reflecting water trapped in between myelin layers is expressed as a myelin water fraction (MWF) relative to the total water signal. The intermediate T2 relaxation time constant of the larger intracellular/extracellular water compartment (termed geometric mean or geomT2IEW) reflects axon size and axon density7,9. Moreover, we recently demonstrated that these myelin indices obtained from ME-T2 imaging are highly reliable7. The purpose of this study was to investigate whether myelin-related indices reflecting myelin content and axonal caliber/packing density from ME-T2 imaging within key white matter tracts are altered in adolescents with ADHD compared to healthy controls.Methods
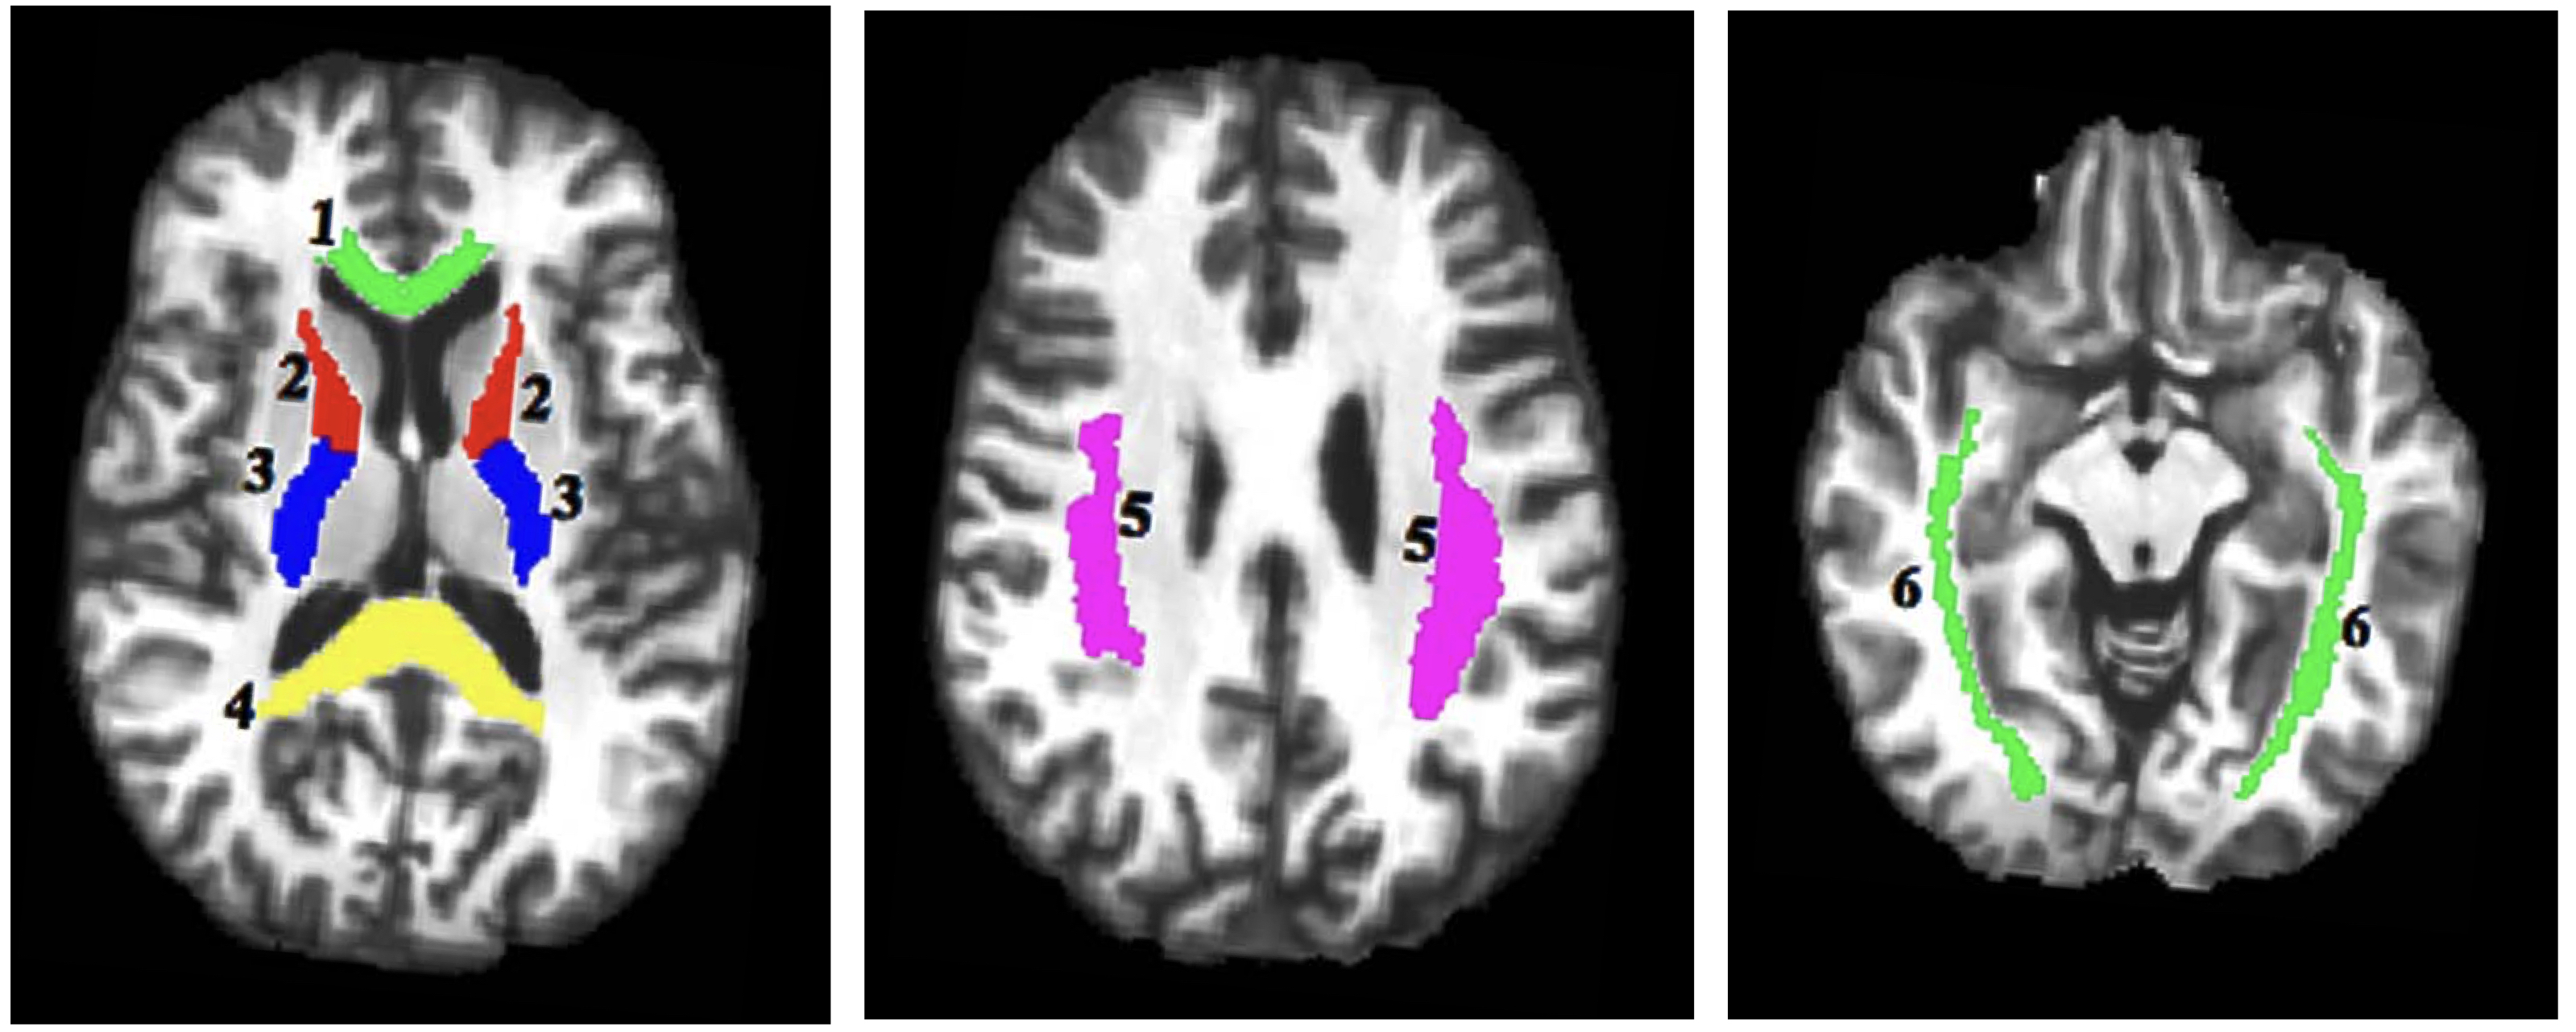
Participants included 14 DSM-IV-defined ADHD adolescents (mean age 15.1±2.4 yrs old; age range 11.9 to 19.1 yrs old; 9 males and 5 females) and 26 healthy controls (mean age 16.4±2.2 yrs old; age range11.8 to 19.5 yrs old; 10 males and 16 females). The ME-T2 was acquired on a 3T Siemens Verio system using either a 12 or 32-channel receive-only head coil and a 3D-GRASE sequence (32 echoes, 11 ms inter-echo spacing, TR=1110 ms, FOV= 222x165 mm2, matrix size= 192x144 in the axial plane and 24 5-mm thick slices)6,7. Six regions of interest (ROI) in key white matter areas were examined: projection fibers (anterior and posterior limb of the internal capsule, ALIC and PLIC), commissural fibers (genu and splenium of the corpus callosum) and association fibers (superior longitudinal and inferior fronto-occipital fasciculi, SLF and IFOF). The ROIs were identified using the JHU White Matter Atlas in standard space, projected onto the subjects’ space, and used to extract the ME-T2 data (Figure 1). Regularized NNLS was used to fit the ME-T2 data with 200 logarithmically spaced T2 values of 10-2,000 ms. The geomT2IEW component was defined as T2 values between 40 and 200 ms. A repeated measure GEE model with side (right and left), age and sex as independent variables was fit to the MWF and geomT2IEW data for each ROI.Results
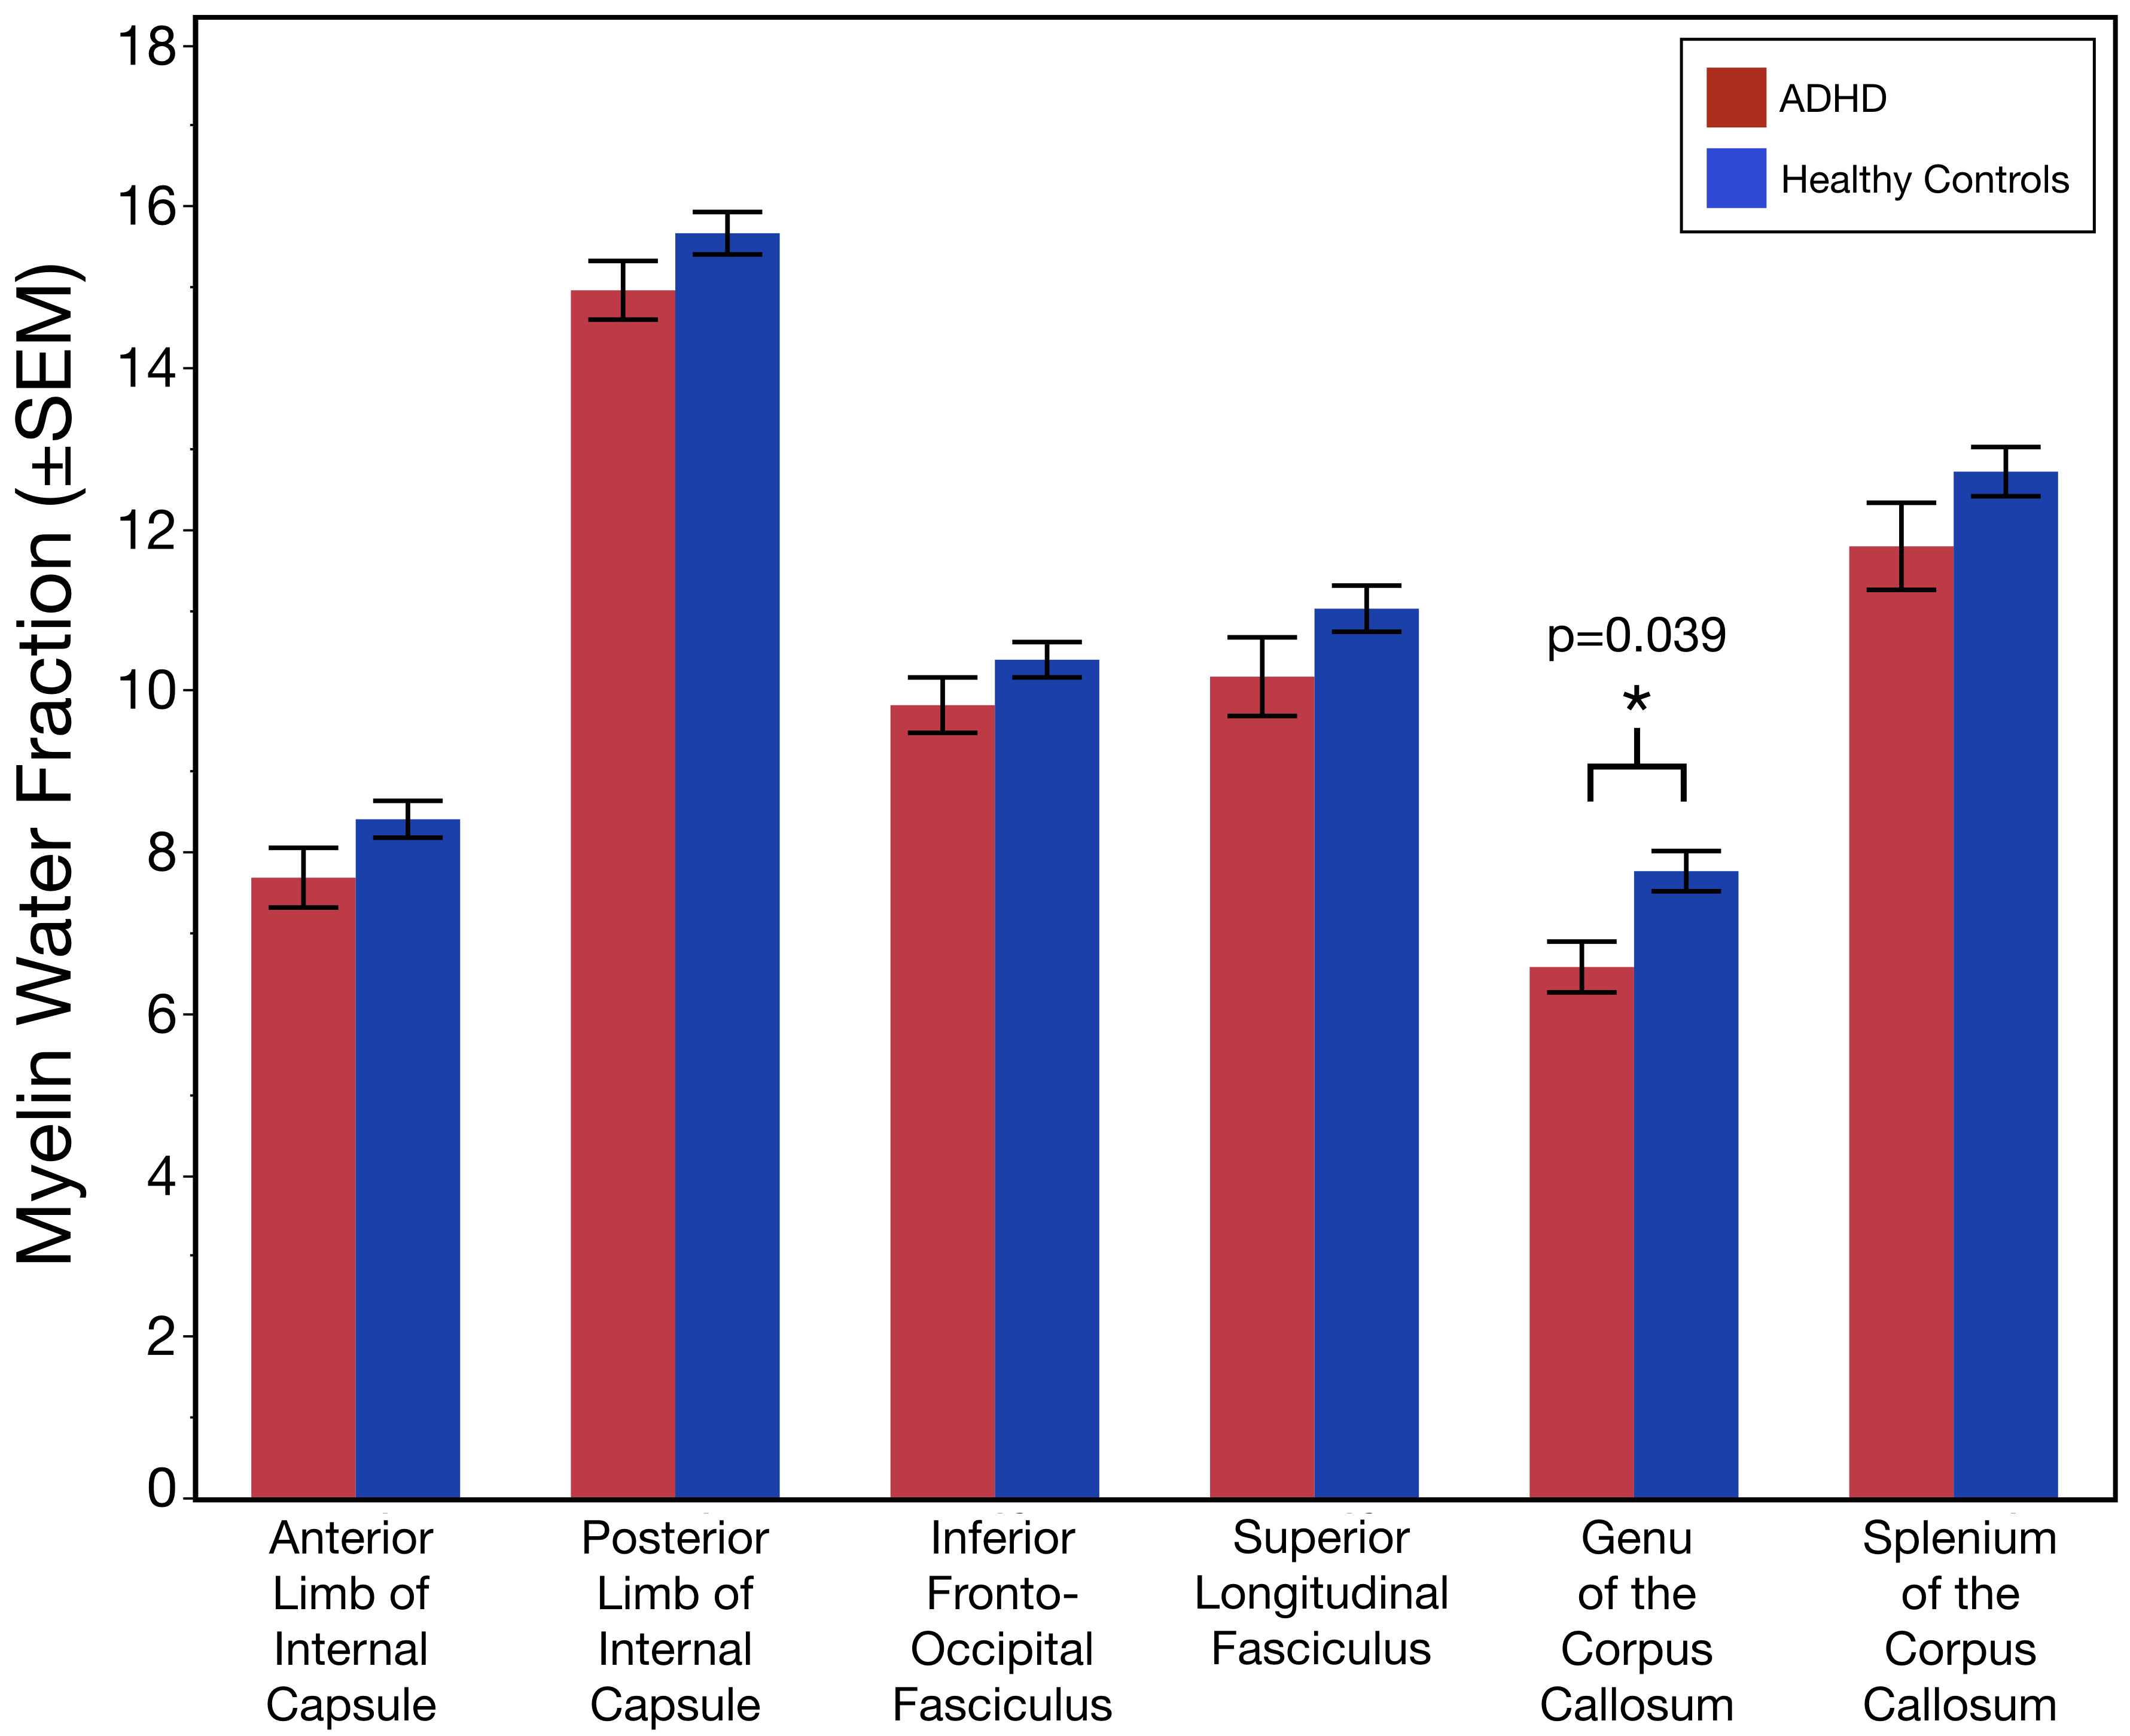
The age distribution did not differ between the two subject groups (p=0.10). Relative to controls, MWF values were significantly lower in the genu of the corpus callosum of individuals with ADHD (Χ2= 4.27; p = 0.039; Figure 2). Additionally, geomT2IEW values were significantly lower in the splenium of the corpus callosum (Χ2= 3.93; p = 0.048) and the PIC (Χ2= 4.00; p = 0.027) of ADHD adolescents compared to controls (Figure 3).Conclusion
These novel results show for the first-time evidence of reduced myelin content in the genu of the corpus callosum of individuals with ADHD compared to controls without detectable differences in the axonal size or packing density. Also, results demonstrated lower geomT2IEW values in the splenium of the corpus callosum and PIC of ADHD adolescents compared to controls. Both, myelin content and the geomT2IEW values in these 6 ROI’s increase with age in healthy individuals reflecting the continued myelination and axonal size expansion well into early adulthood6,7,10. Therefore, the observed reduced MWF suggests an altered progression in the myelination of axons in the genu of the corpus callosum of ADHD. Moreover, these results suggest a lack of continued axonal size expansion in the splenium of the corpus callosum and PIC of ADHD. Ultimately, longitudinal measurements are warranted to truly characterize developmental changes in myelin content and axonal size expansion of white matter tracts across adolescence in ADHD.Acknowledgements
This study was supported by NIMH under award number R01 MH59299 (DRR) and by the Lycaki-Young Funds from the State of Michigan.References
1. Shaw P, Eckstrand K, Sharp W, et al. Attention-deficit/hyperactivity disorder is characterized by a delay in cortical maturation. Proc. Natl. Acad. Sci. U.S.A. 2007.
2. Chen L, Hu X, Ouyang L, et al. A systematic review and meta-analysis of tract-based spatial statistics studies regarding attention-deficit/hyperactivity disorder. Neuroscience and biobehavioral reviews. 2016;68:838-847.
3. Silk TJ, Vilgis V, Adamson C, et al. Abnormal asymmetry in frontostriatal white matter in children with attention deficit hyperactivity disorder. Brain Imaging and Behavior. 2016;10(4):1080-1089.
4. Goradia DD, Vogel S, Mohl B, et al. Distinct differences in striatal dysmorphology between attention deficit hyperactivity disorder boys with and without a comorbid reading disability. Psychiatry Research: Neuroimaging. 2016;258(C):30-36.
5. Gilliam M, Stockman M, Malek M, et al. Developmental trajectories of the corpus callosum in attention-deficit/hyperactivity disorder. Biological psychiatry. 2011;69(9):839-846.
6. Arshad M, Stanley JA, Raz N. Adult age differences in subcortical myelin content are consistent with protracted myelination and unrelated to diffusion tensor imaging indices. NeuroImage. 2016;143(C):26-39.
7. Arshad M, Stanley JA, Raz N. Test-retest reliability and concurrent validity of in vivo myelin content indices: Myelin water fraction and calibrated T1 w/T2 w image ratio. Human brain mapping. 2017;38(4):1780-1790.
8. MacKay A, Whittall K, Adler J, Li D, Paty D, Graeb D. In vivo visualization of myelin water in brain by magnetic resonance. Magnetic resonance in medicine. 1994;31(6):673-677.
9. Dula AN, Gochberg DF, Valentine HL, Valentine WM, Does MD. Multiexponential T2, magnetization transfer, and quantitative histology in white matter tracts of rat spinal cord. Magnetic resonance in medicine. 2010;63(4):902-909.
10. Arshad M, Stanley JA, Raz N. Age Related Diferences in the geomT2 Relaxation Assessed Using Multi-Echo T2 Imaging. Proceedings of the International Society for Magnetic Resonance in Medicine. 2017;24:4273.
Figures