0928
Evaluation of recovery in myelin water signal after acute ischemic stroke1Laboratory for Imaging Science and Technology,Department of Electrical and Computer Engineering, Seoul National University, Seoul, Republic of Korea, 2Department of Neurology, Seoul National University Hospital, Seoul, Republic of Korea
Synopsis
This study investigated the recovery in myelin water signals after acute ischemic stroke. The results showed an increase of myelin water signals in acute lesions after 3 months of treatment. Furthermore, mild stroke patients recovered more than severe stroke patients when comparing measures of myelin water signals in acute lesions.
Purpose
Stroke is one of the leading causes of life-long disability and mortality accounting for 11% or approximately 6.3 million deaths of the cause of death [1]. As white matter (WM) is vulnerable to hypoxemia and energy failure, WM damage is a common aftermath of ischemic stroke. Animal studies have shown that in the cellular level, myelin loss is observed in stroke lesions combined with deterioration of the microenvironments and cellular structures. The lesion goes through a repair process whereby oligodendrocyte progenitors migrate to injured areas, differentiate to oligodendrocytes, and form myelination [2]. In this context, the failure of appropriate re-myelination after a stroke has been suggested to result in permanent neurologic deficit, cognitive impairment, and dementia. Evaluation of myelin using a myelin biomarker (e.g. myelin water imaging (MWI)) targeting chronic stroke was previously conducted [3]. However, assessment of changes in myelin water signal in acute stroke patients and observation of the temporal changes in human subjects are needed. In this study, we evaluated increase of myelin water signal after acute ischemic stroke.Methods
Eleven acute stroke patients were scanned twice at 3T in the acute phase of stroke (first scan) and 3 months follow-up (second scan) after the acute stoke treatment with national current guidelines for stroke management (IRB-approved). For MWI, ViSTa MWI was utilized [4]. ViSTa MWI: a 3D segmented EPI based ViSTa sequence [4] was implemented using the following parameters: resolution = 1.5 x 1.5 x 4 mm3, 32 slices, TR/TE = 1160/6.6 ms, TI1/TI2/TD = 560/220/380 ms, partial k-space = 6/8, EPI factor = 15, and scan time = 6 min 48 sec. To quantify MWF, a PDw GRE sequence based on the same EPI as the ViSTa sequence was acquired (TR = 75 ms, flip angles = 5°, and scan time = 26 sec). The ViSTa myelin water fraction (apparent MWF; aMWF) was calculated by dividing the ViSTa data by the PDw GRE data and multiplying a scaling factor [4]. Data processing and analysis: All ViSTa MWI images including the first and second scans were registered non-linearly to the MNIT1152 template using SyN in ANTs [5]. To examine changes in aMWFs after the treatment of infarction, ROIs of acute lesions were delineated using FSL. In addition, the contra-lateral sides (CLSs) of the lesions were also drawn in order to evaluate aMWFs of normal WM. aMWFs of the initial phase and follow-up scans were compared using Wilcoxon signed rank test. For further analyses for clinical relevance, Spearman’s correlation was calculated between aMWF of acute lesions and Fazekas scale used to quantify the amount of pre-stroke WM lesions [6]. Scatter plots between aMWF of lesions and Fazekas scale were generated to compare trend of the initial scan with that of the follow-up scan. Lately, stroke patients were dichotomized into mild and severe groups based on Fazekas scale; the mild group consisted of 0 and 1 of Fazekas scale and the severe group consisted of 2 and 3. Statistical difference of the two groups was investigated using Mann Whitney U test. Statistical analysis was performed using SPSSResults
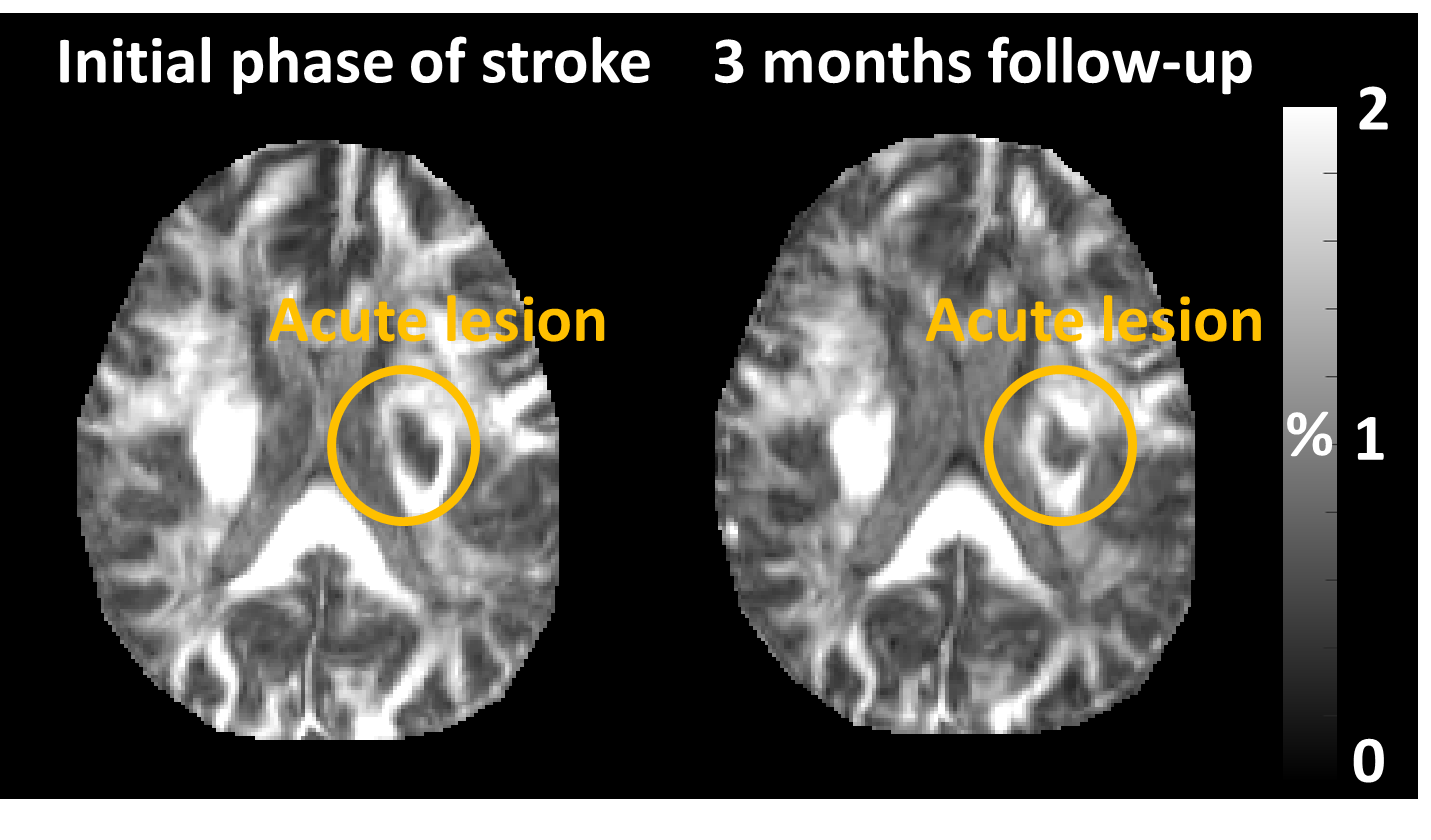
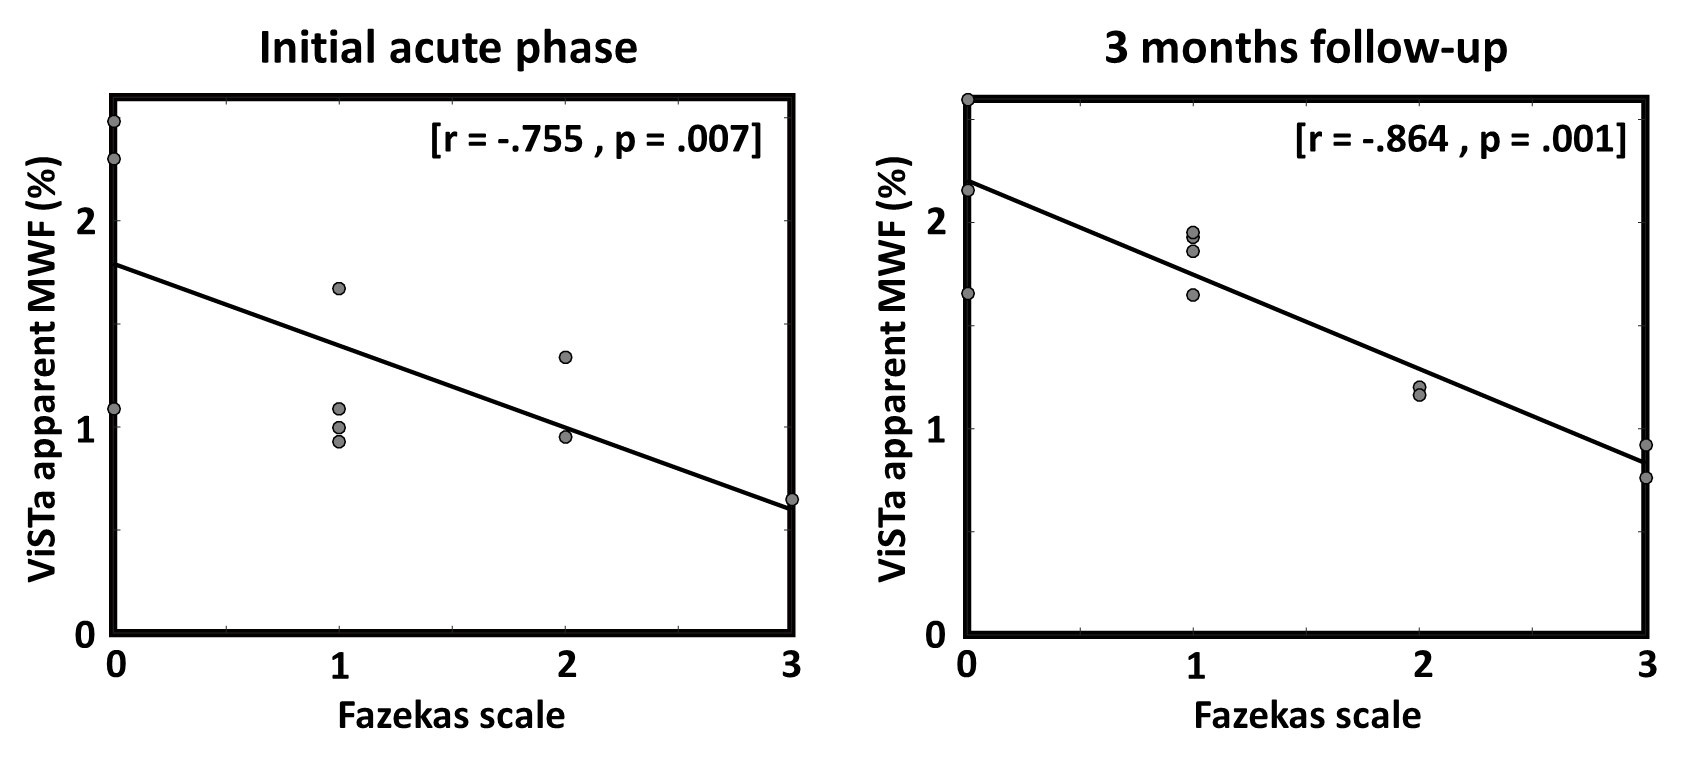
Representative images of ViSTa MWI were shown in Fig. 1. After treatment, aMWFs of lesions evidently increased, when comparing the images of initial phase and follow-up. Fig.2 shows that aMWFs of lesions increased significantly at 3 months follow-up from the initial phase of acute stroke (about 20% increase, p = .037) but those of CLS (p = .169) did not, confirming the partial recovery of aMWF in acute lesions. As shown in Fig. 3, aMWF of the second follow-up scan lesions after treatment had stronger correlation with Fazekas scale (r = -.864) than that of the first initial scan lesions (r = -.755). Interesting finding was that aMWF of the mild WM disease group increased more than that of the severe group after acute stroke, allowing significant difference between the mild and severe groups in the second follow-up scan (Fig. 4). These results suggested that patients with milder previous WM damage may be more recoverable in aMWF after acute ischemic stroke.Discussion and Conclusion
This study observed an increase of aMWF after acute stroke in human subjects, one possible reason for partial recovery in aMWF is re-myelination. Ischemic damage by acute stroke is characterized by the deterioration of oligodendrocytes which mediate myelination, followed by the repair process of myelination in local lesions [2]. In this line of thought, the acquisition of aMWF from ViSTa may aid the prediction of recovery in myelin after an acute ischemic stroke.Acknowledgements
This present study was approved by the Institutional Review Board at the Seoul National University Hospital and supported by Eisai Korea Inc. (Approval No. H-1506-077-681).References
[1] GBD 2016 Causes of Death Collaborators. Global regional and national age-sex specific mortality for 264 causes of death, 1980–2016: a systematic analysis for the Global Burden of Disease Study 2016. Lancet. 2017
[2] Sozmen EG, Rosenzweig S, Llorente IL, DiTullio DJ, Machnicki M, Vinters HV, Havton LA, Giger RJ, Hinman JD, and Carmichael ST. Nogo receptor blockade overcomes remyelination failure after white matter stroke and stimulates functional recovery in aged mice. PNAS. 2016
[3] Borich MR, Mackay AL, Vavasour IM, Rauscher A, and Boyd LA. Evaluation of white matter myelin water fraction in chronic stroke. Neuroimage: Clinical. 2013
[4] Oh SH, Bilello M, Schindler M, Markowitz CE, Detre JA, and Lee J. Direct visualization of short transverse relaxation time component (ViSTa). Neuroimage. 2013
[5] Avants B and Gee JC. Geodesic estimation for large deformation anatomical shape averaging and interpolation. NeuroImage. 2004; 23 Suppl.
[6] Fazekas F, Chawluk JB, Alavi A, Hurtig HI, and Zimmerman RA. MR signal abnormalities at 1.5 T in Alzheimer’s dementia and normal aging. AJR AM J Roentgenol. 1987.
[7] Wang LE, Tittgemeyer M, Imperati D, Diekhoff S, Ameli M, Fink GR, Grefkes C. Degeneration of corpus callosum and recovery of motor function after stroke: a multimodal magnetic resonance imaging study. Hum Brain Mapp. 2012 Dec;33(12):2941-56.
Figures