0927
Are we seeing any better? A comprehensive comparison of myelin biomarkers in the healthy and multiple sclerosis post mortem spinal cord1Queen Square MS Centre, UCL Institute of Neurology, Faculty of Brain Sciences, University College London, London, United Kingdom, 2Philips UK, Surrey, United Kingdom, 3Centre for Medical Image Computing, Department of Computer Science, University College London, London, United Kingdom, 4Department of Anatomy and Neurosciences, VU University medical centre, Amsterdam, Netherlands, 5Department of Neurology, Haukeland University Hospital, Bergen, Norway, 6Cardiff University Brain Research Imaging Centre, Cardiff University, Cardiff, United Kingdom, 7Department of Brain and Behavioural Sciences, University of Pavia, Pavia, Italy, 8Brain MRI 3T Research Centre, C. Mondino National Neurological Institute, Pavia, Italy
Synopsis
Conventional MRI of the multiple sclerosis (MS) spinal cord offers low specificity to underlying pathological processes taking place. Quantitative MRI metrics able to characterize damage at the microstructural level are required. Of particular interest are those known to be sensitive to myelin content, which can be generated via various different contrast mechanisms. It is important to assess the specificity of such prospective myelin biomarkers to MS spinal cord pathology and validation studies comparing MRI with histological findings are essential for this purpose. Here a comparison of myelin-sensitive quantitative MRI metrics measured in MS and healthy ex vivo cord are presented.
Introduction
In people with multiple sclerosis (MS), demyelinating lesions in the spinal cord (SC) are a frequent cause of neurological disability, and detection of such abnormalities via MRI is key for diagnosis and determining prognosis1. Histopathology has shown that cord grey matter (GM) demyelination is more prominent than in white matter (WM), extends beyond focal lesions2, and does not respect anatomical boundaries3.
Conventional MRI of the spinal cord has limited sensitivity and specificity for underlying pathophysiology, therefore quantitative MRI indices that assess tissue microstructure in vivo are sought. The performance of available MRI indices in assessing SC tissue microstructure is uncertain, given the challenges associated with performing reliable and robust measurement in the cord in vivo4-6.
We present a comprehensive comparison in ex-vivo healthy and MS SC samples of quantitative MRI metrics commonly adopted to investigate MS pathology in vivo, with a particular focus on those thought to be sensitive to myelin content, as a first step towards the overall aim of finding new non-invasive myelin biomarkers for more accurate prognosis, patient stratification and treatment monitoring in MS.
Methods
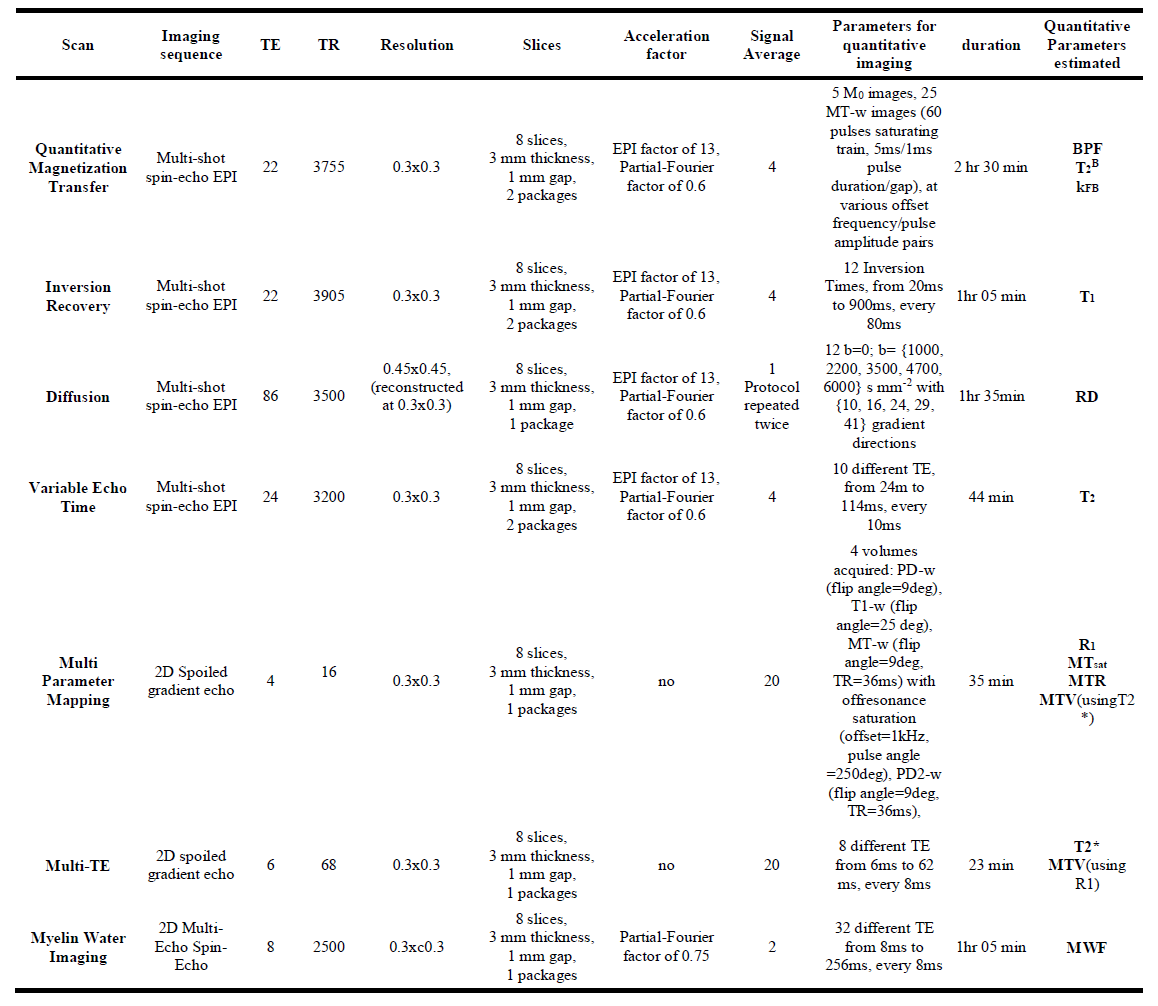
3 healthy and 4 MS formalin-fixed SC samples underwent MRI examination, while immersed in a 10mmol/L phosphate buffered saline solution. Imaging was performed using a 3T Philips Achieva system (Philips Healthcare, Best, The Netherlands) with a 32-channel coil, with the protocol described in figure 1.
The following quantitative MRI indices were calculated: longitudinal (T1) and transverse relaxation times (T2 and T2*), magnetization transfer ratio (MTR), Magnetization transfer saturation (MTsat), longitudinal relaxation rate (R1), Bound Pool Fraction (BPF), bound pool transverse relaxation time (T2B), free-to-bound pool magnetization exchange rate (kFB), macromolecular total volume (MTV), all using custom-written software in Matlab (The Mathworks, Natick, MA); myelin water fraction (MWF), using the MERA toolbox7; and radial diffusivity (RD) using the dtifit routine from FSL (FMRIB, Oxford, UK).
Regions-of-Interest (ROIs) were manually drawn for WM and GM in all slices in the healthy samples, and for normal appearing WM (NAWM), normal appearing GM (NAGM) and lesions (where visible) in all slices in the MS samples, on the (echo-averaged) multi-echo T2*-weighted images.
Metrics were qualitatively compared by examining their distributions within different tissue types, and through linear correlations. In particular, correlations of metrics considered sensitive to myelin (namely BPF, MTV and MWF) with each other, and with other quantitative measurements (from relaxation, diffusion and magnetization transfer) were explored.
Results
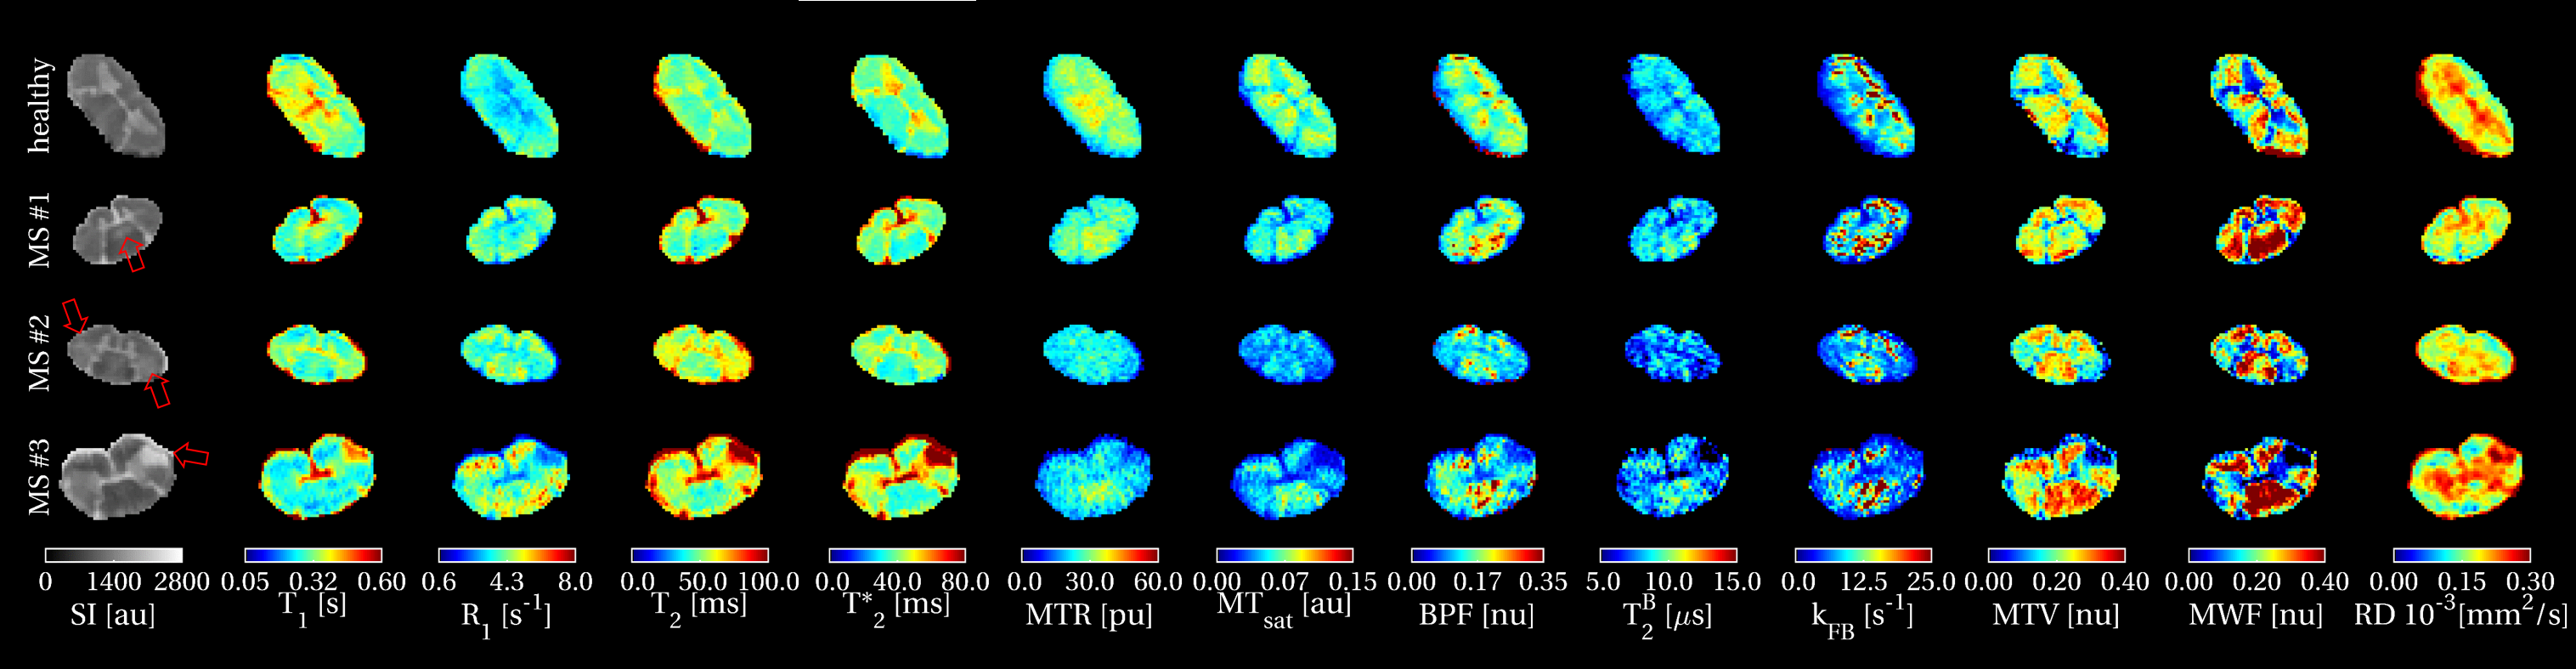
All the parameters calculated reproduce the expected contrast between tissue types in healthy and normal appearing tissue: indices sensitive to myelination show higher values in WM/NAWM compared to GM/NAGM and variation of normal contrast can be observed in lesions in all parameters (figure 2). All of the myelin-sensitive metrics, such as MTR, MTsat, BPF, MTV and MWF show reductions in lesion ROIs (examples highlighted by arrows in the anatomical images of figure 2), although with different intensity patterns.
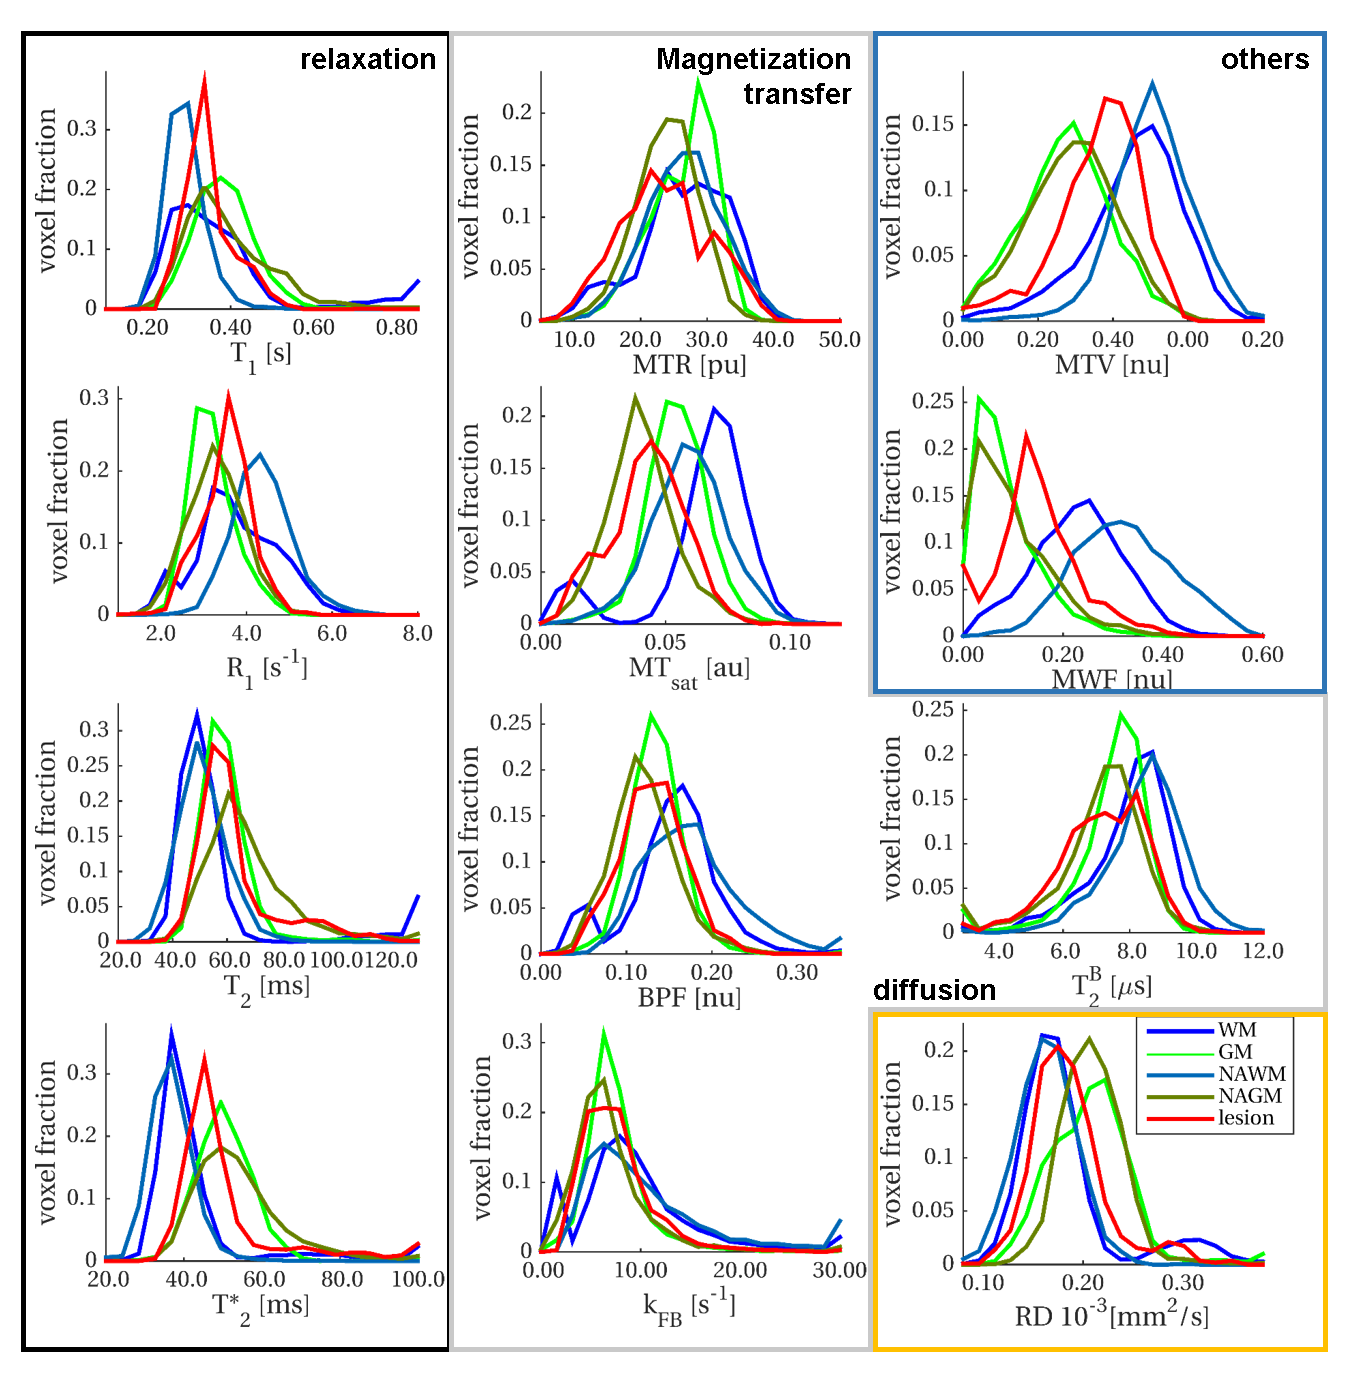
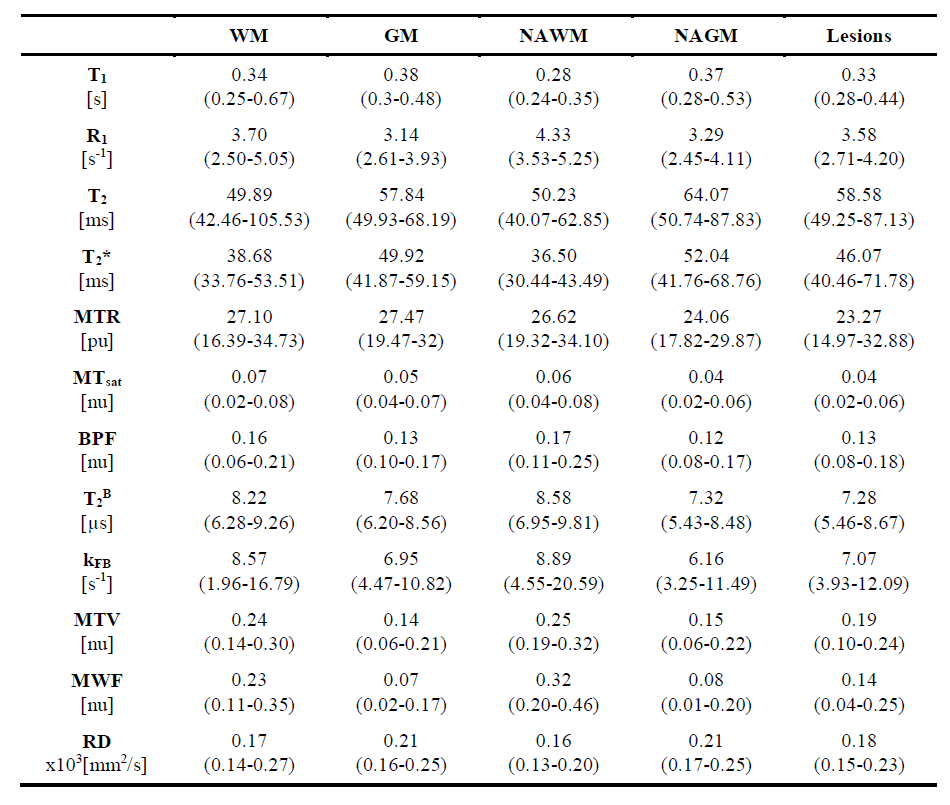
In lesions parameters distributions shift towards higher or lower values (according to the metric considered) when compared to WM/NAWM distributions (figure 3). Heterogeneity between samples, possibly due to post mortem delay prior to fixation and/or different lengths of fixation process, are likely to blur this separation for some of the metrics (e.g. T1 and MTR). Distributions are quantitatively summarized in table 4.
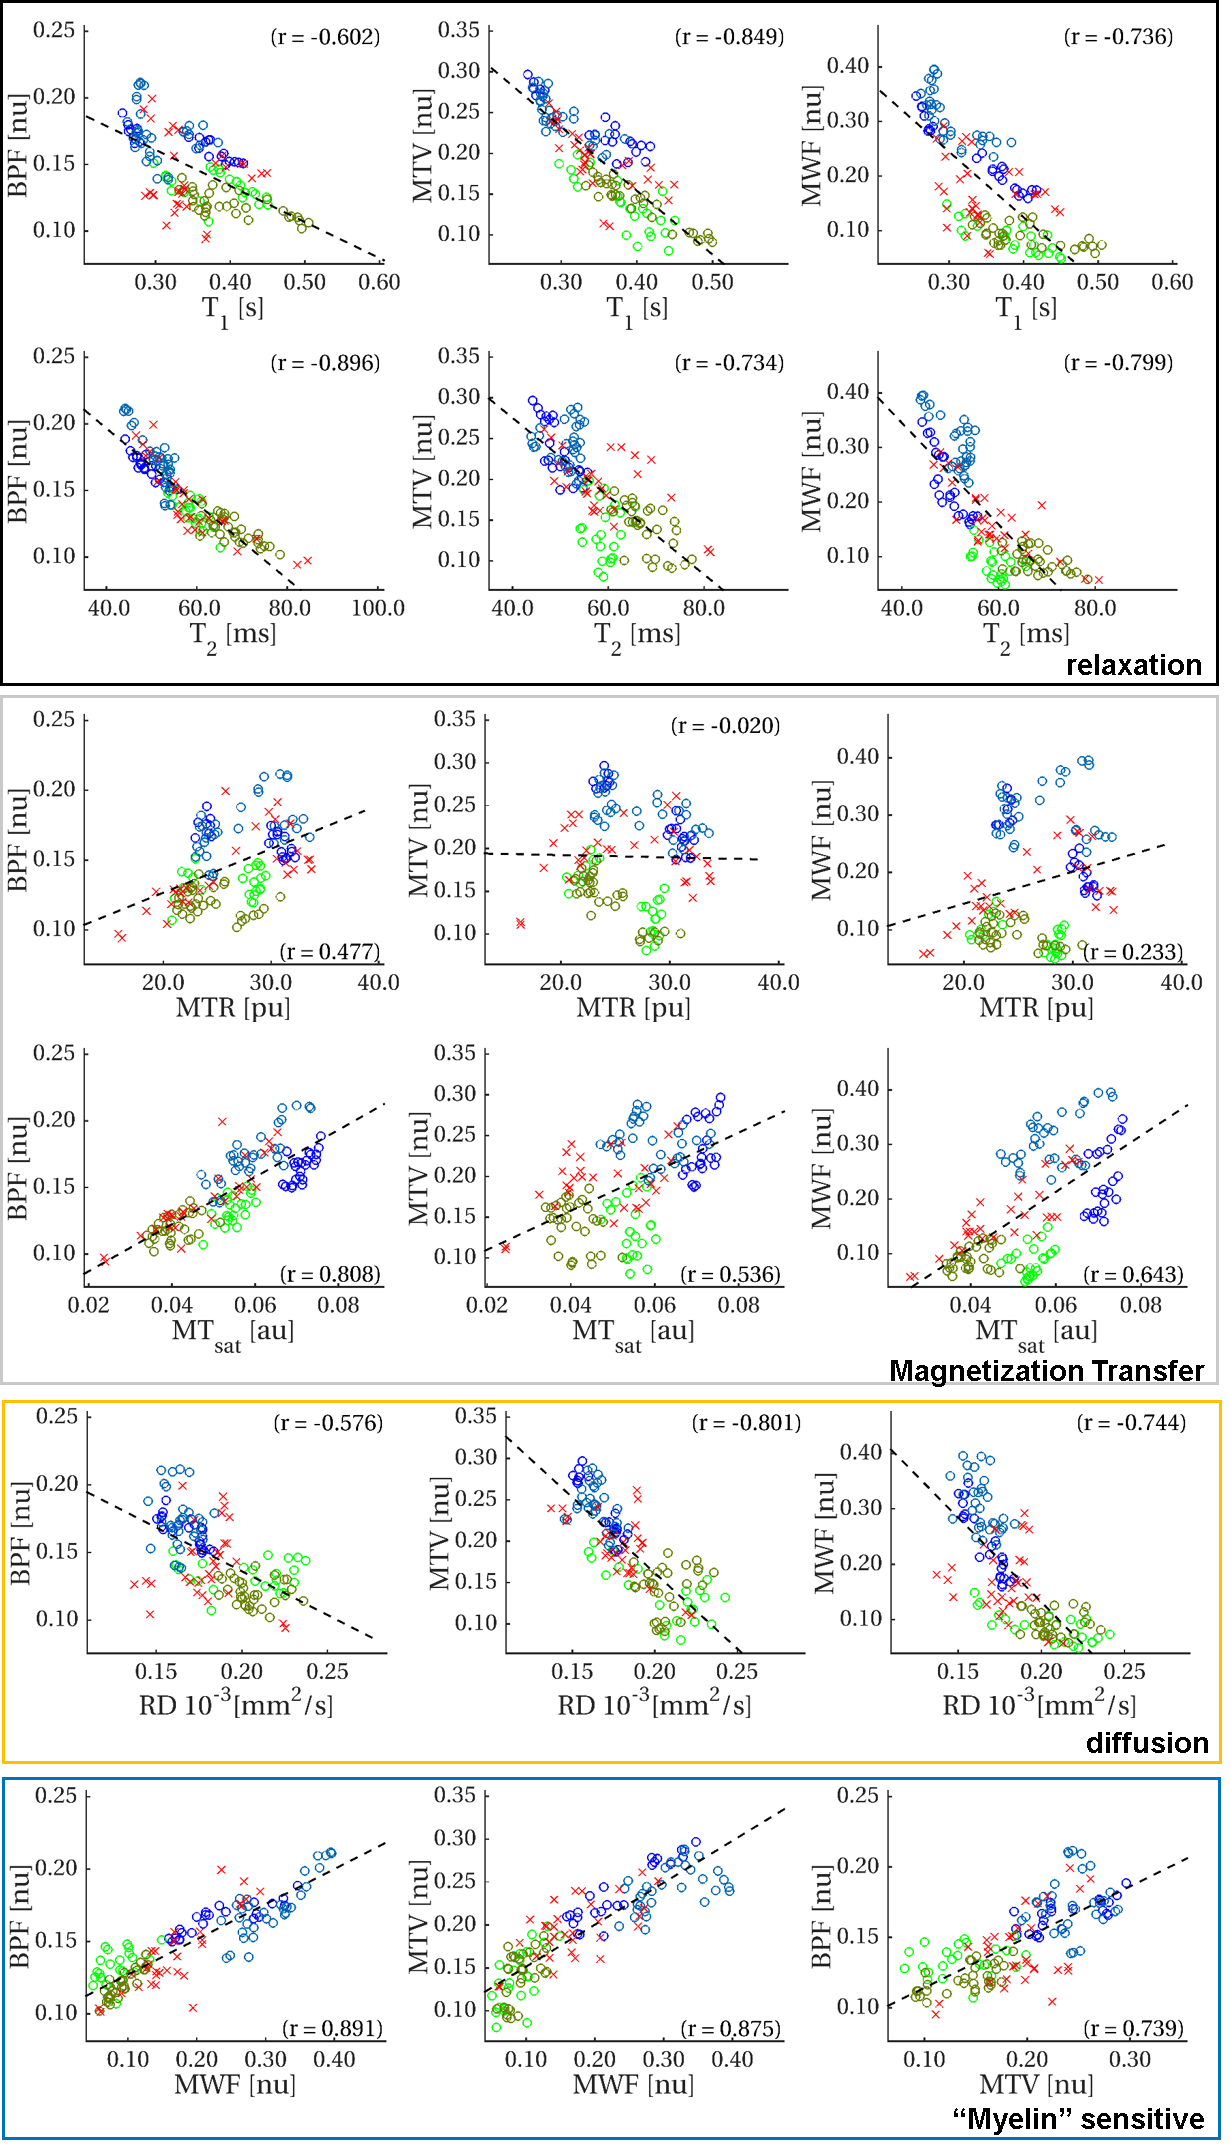
Linear correlations are explored between myelin-sensitive indices with other quantitative metrics (figure 5). Weaker correlations are found with MT-based measurements (MTR and MTsat) which are thought to be myelin-sensitive, although BPF is well correlated with MTsat. In general, myelin-sensitive parameters are strongly correlated with each other, and with relaxation times, with varying strengths, e.g. BPF is strongly correlated with T2 but less so with T1.
Discussion and Conclusions
We have presented preliminary results comparing several quantitative MRI indices commonly proposed as potential myelin biomarkers. Specific features of SC tissue microstructure (e.g. larger axons compared to the brain) and MS SC pathology require quantitative MRI metrics to be validated for the specific case of SC tissue, as some of the relationships between quantitative MRI measurements and tissue properties may vary compared to the brain8.
The dataset presented here represents a unique opportunity to assess to what extent each measure captures different pathological processes in MS lesions and/or more subtle tissue damage extending beyond focal lesions in the SC.
Comparison of the MRI findings reported here with measures derived from histology is our next step. Such an analysis will elucidate the potential of the current state-of-the-art of quantitative MRI in the SC to outperform conventional MRI examination and specifically measure myelin in MS pathology.
Acknowledgements
Funding was received from the UK MS Society, INSPIRED (a spinal cord imaging grant funded by the International Spinal Research Trust, Wings for Life, and CHNF), and the Department of Health’s NIHR Biomedical Research Centres funding scheme. EPSRC (M020533; through CMIC Pump-Priming Awards). Horizon2020-EU.3.1 (ref: 634541). CT has received a post-doctoral research ECTRIMS fellowship (2015), and has also received honoraria and support for travelling from Teva Pharmaceuticals Europe and Ismar Healthcare.References
[1] Kearney H, et al. Nature Reviews Neurology 2015, 11: 327-338; [2] Gilmore C P, et al. J Neurol Neurosurg Psychiatry 2009, 80:182-7; [3] Gilmore C P, et al. Brain Pathol. 2006, 16:202-8; [4] Barkhof F. Current opinion in neurology 2002, 15:239-245; [6] Stroman P W, et al. Neuroimage 2014, 84:1070-1081; [6] Wheeler-Kingshott, C A et al. Neuroimage 2014, 84:1082-1093; [7] Does, M. Multi-exponential relaxation analysis (MERA) toolbox, version 2, http://www.vuiis.vanderbilt.edu/~doesmd/MERA/MERA_Toolbox.html; [8] Dula A N, et al. MRM 2010, 63:902-909.Figures