0926
Inhomogeneous Magnetization Transfer (ihMT) sensitivity to myelin impairments in cuprizone mouse model1Aix Marseille Univ, CNRS, CRMBM, UMR 7339, Marseille, France, 2Aix Marseille Univ, CNRS, IBDM, UMR 7288, Marseille, France, 3Division of MR Research, Beth Israel Deaconess Medical Center, Harvard Medical School, Boston, MA, United States, 4Aix Marseille Univ, APHM, Hôpital de La Timone, Pôle de Neurosciences Cliniques, Service de Neurologie, Marseille, France
Synopsis
Inhomogeneous magnetization transfer (ihMT) is a new MR imaging modality weighted by the dipolar relaxation time (T1D), which has demonstrated a strong linear correlation with myelin-specific fluorescence signal measured in genetically-modified mice, hence validating the technique as a myelin biomarker. In the current study, the ihMT sensitivity has been evaluated on a cuprizone mouse model, a widely used model of de- and remyelination. A longitudinal analysis has been performed in vivo and quantitative signal was compared to myelin amount measured by GFP quantification at remarkable time points in order to evaluate the ihMT sensitivity for monitoring in vivo myelin state.
Introduction
Inhomogeneous magnetization transfer (ihMT) is a new MR imaging modality1–3 weighted by the dipolar relaxation time (T1D), which has demonstrated a strong linear correlation with myelin-specific fluorescence signal measured in genetically-modified mice, hence validating the technique as a myelin biomarker.4 This genetically-modified mouse line expresses the green fluorescent protein (GFP) under the control of proteolipid protein (plp) gene promoter (hence called plp-GFP mouse model). Thus, production of plp, a major myelin protein, triggers synthesis of GFP5, which remains in the oligodendrocyte cytosol and can be quantitatively measured by fluorescence microscopy. In the current study, the sensitivity of ihMT to myelin status has been evaluated on a cuprizone mouse model, a widely used model of de- and remyelination.6–8 Feeding healthy mice with cuprizone diet induces specific death of mature oligodendrocyte and leads to secondary demyelination. After removing the toxin from the diet, spontaneous remyelination occurs via oligodendrocyte progenitor cell reactivation and differentiation. A longitudinal analysis has been performed in vivo using ihMT on plp-GFP cuprizone mice. Quantitative ihMT signal was compared to myelin amount measured by GFP quantification at remarkable time points of the model in order to evaluate the ihMT sensitivity for monitoring in vivo myelin state.Method
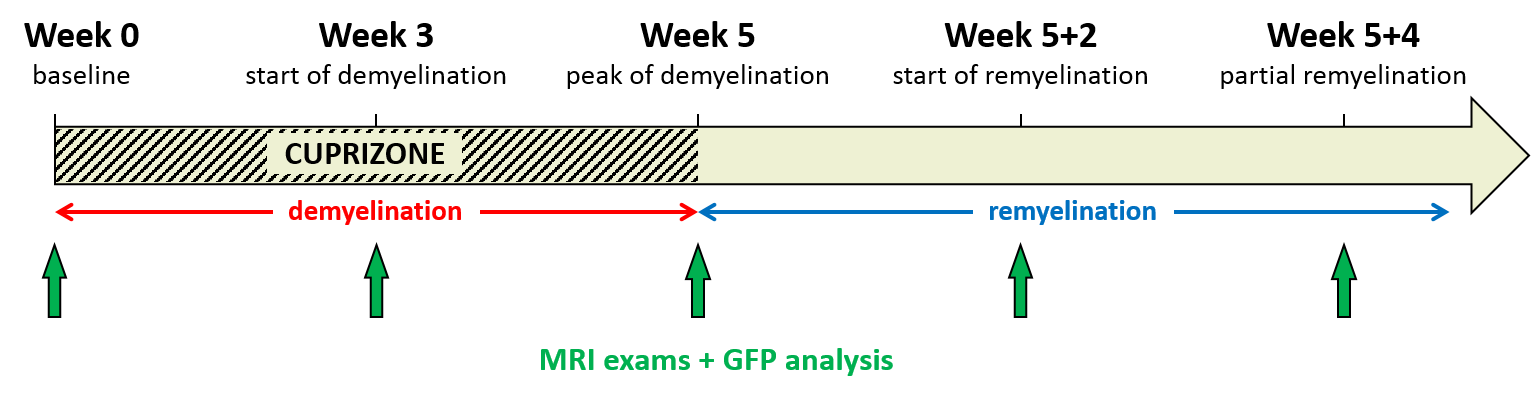
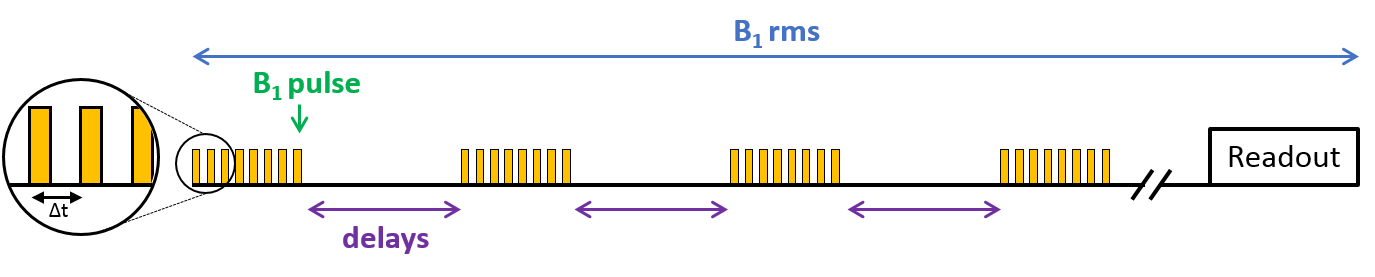
Dynamics of myelin loss and re-expression in mice after cuprizone feeding depends on toxin concentration and has been previously documented.9,10 We used a diet containing 0.2% cuprizone known to quickly induce a massive oligodendrocyte death in the corpus callosum (CC) and followed by myelin destruction, appearing within 3 to 5 weeks. Cuprizone was halted after 5 weeks allowing for remyelination within 2 weeks. MR experiments were performed on a Bruker Avance 500 MHz/89mm wide bore vertical imager on anaesthetized mice (mixed sex, age=10 weeks at W0). A 2D ihMT prepared single shot RARE sequence11 (TR/TE=3.4s/2.4ms, FOV=25x25mm², Mtx=128x128, slice thickness=1mm), was used to explore CC in a single axial slice. A boosted ihMT saturation4,12,13 scheme combined with weak T1D-filtering2 (Fig.2) was used with the following parameters: number of pulses for each saturation burst, Np=12; burst repetition time, BTR=90ms; pulse width and interpulse repetition time, PW/Δt=1/1.3ms; averaged RF power, B1rms=6.7µT, saturation time, τ=0.9s; and frequency offset, Δf=10kHz. For each experiment, a total number of 260 NEX (60min) was acquired and ihMTR values (defined as the ihMT signal divided by the unsaturated M0 signal) were measured in corpus callosum (CC) for each mouse (n=18 at W0, n=16 at W3, n=12 at W5, n=5 at W5+2 and n=4 at W5+4). At each time point, 4 mice (and 2 at baseline, W0) were sacrificed after MR experiments for histological analysis. After perfusion with fixative (PFA 4%), mouse brains were extracted and sectioned for direct fluorescence analyses in 20µm thick slices located at similar levels than MRI slices (-0.7mm from Bregma). Quantification of myelin content in CC was obtained by the mean GFP signal intensity measurement (ImageJ software (NIH)).Results and Discussion
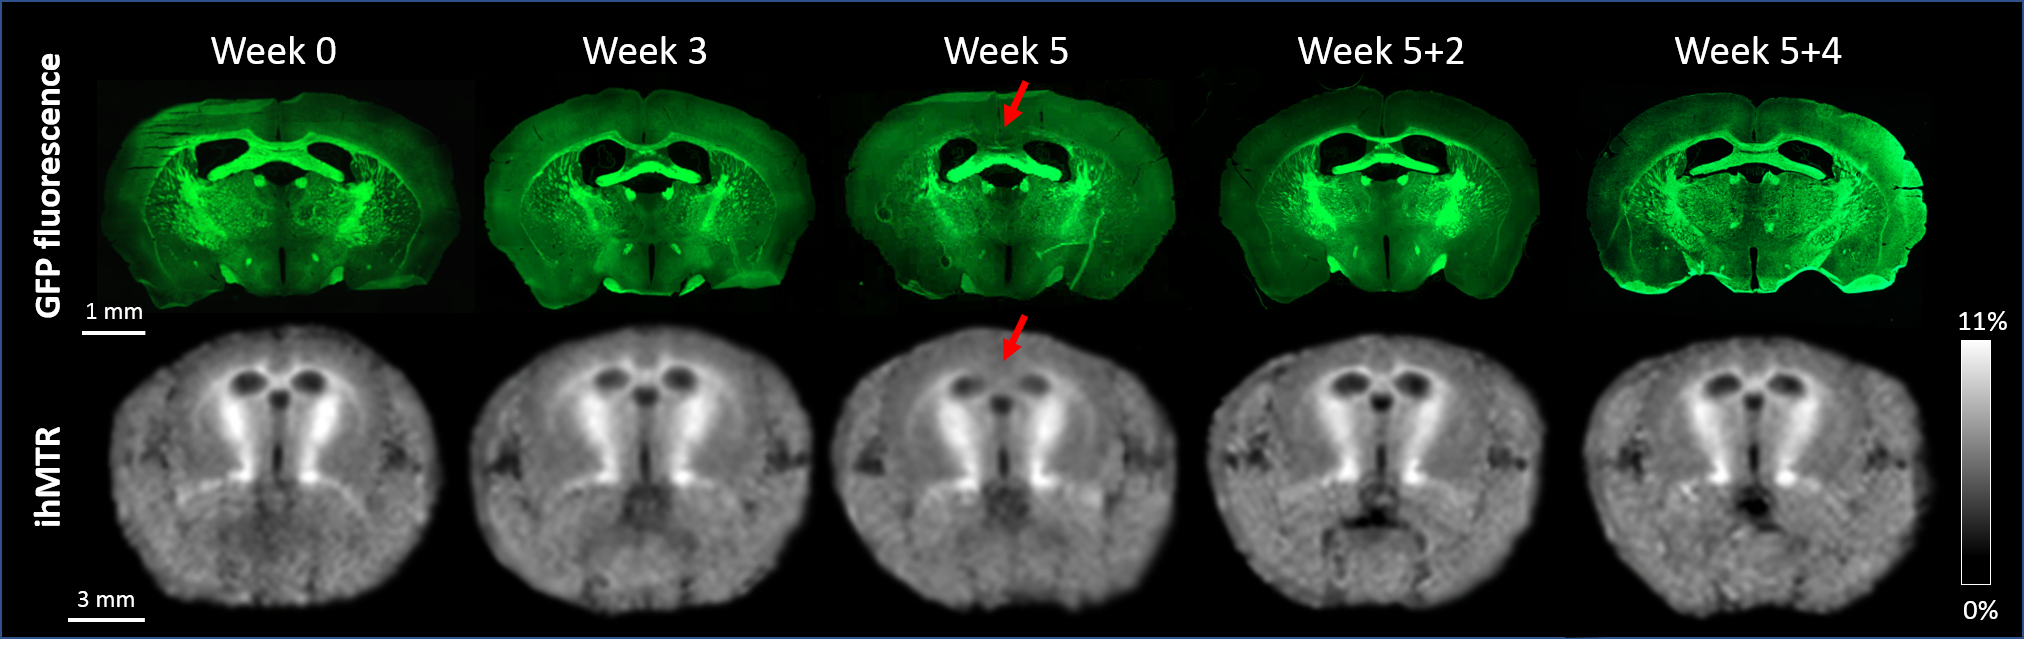
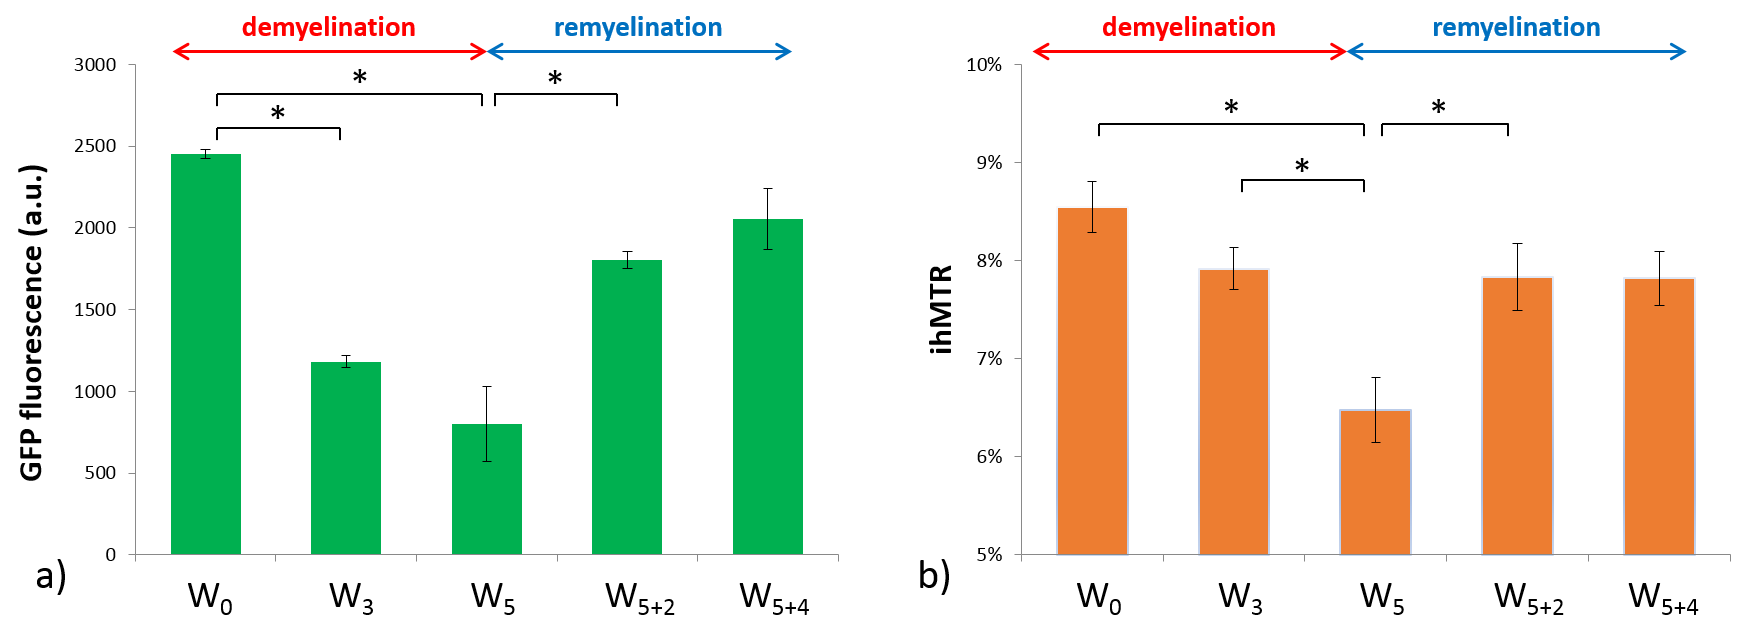
Typical GFP and ihMTR images are shown on Fig.3 for relevant time points. Mean signal values measured in CC with fluorescence microscopy and ihMT technique are plotted in Fig.4a and 4b respectively. GFP and ihMTR signals start from their maximum at W0 (baseline); a progressive drop can be appreciated starting from W3 and reaching a minimum signal at W5 (peak of demyelination). After the cuprizone was diet stopped, GFP and ihMTR signals recover from W5+2 to W5+4. These results demonstrate the sensitivity of ihMT for myelin status in a de- and remyelination mouse model. Of interest, differences between GFP microscopy and ihMT could however be noticed. A fractional signal loss of 67% was measured with GFP at the peak of demyelination (W5) compared to baseline (W0), whereas ihMTR signal decreased by 24% only. Myelin destruction process leads to progressive modification of myelin sheath structure, hence potentially leading to reduced T1D value. However, the saturation parameters used in this study minimally filtered short T1D component signal4 and hence, a fraction of the total ihMT signal measured at W5 could originated from myelin debris with short T1D, thus underestimating the ihMT fraction signal loss due to demyelination effect. The other difference is the signal intensity at W3, significantly different from W5 for ihMT but not for GFP fluorescence. This result can be explained by the different main source of signal of both modalities. While GFP fluorescence comes from the oligodendrocyte cytosol, the main part of ihMT signal comes from highly concentrated lipids in myelin sheath, which may explain W3 signal discordance: oligodendrocyte death precedes myelin destruction.9,14
Conclusion
In accordance with GFP fluorescence analysis, ihMT appeared to be sensitive to myelin status changes (demyelination an remyelination) in cuprizone model.Acknowledgements
Support from A*MIDEX grant (n°ANR-11-IDEX-0001-02) funded by the French Government “Investissements d’Avenir” program.The authors thank N.C. for animal handling.References
1. Varma G, Girard OM, Prevost VH, Grant AK, Duhamel G, Alsop DC. Interpretation of magnetization transfer from inhomogeneously broadened lines (ihMT) in tissues as a dipolar order effect within motion restricted molecules. J. Magn. Reson. 2015;260:67–76. doi: 10.1016/j.jmr.2015.08.024.
2. Prevost VH, Girard OM, Mchinda S, Varma G, Alsop DC, Duhamel G. Optimization of inhomogeneous magnetization transfer (ihMT) MRI contrast for preclinical studies using dipolar relaxation time ( T 1D ) filtering. NMR Biomed. 2017:e3706. doi: 10.1002/nbm.3706.
3. Swanson SD, Malyarenko DI, Fabiilli ML, Welsh RC, Nielsen J-F, Srinivasan A. Molecular, dynamic, and structural origin of inhomogeneous magnetization transfer in lipid membranes: Origin of ihMT Contrast. Magn. Reson. Med. 2017;77:1318–1328. doi: 10.1002/mrm.26210.
4. Prevost VH, Girard OM, Cayre M, Varma G, Mchinda S, Ranjeva J-P, Pelletier J, Durbec P, Alsop DC, Duhamel G. Validation of inhomogeneous Magnetization Transfer (ihMT) as a myelin biomarker. ISMRM Congr. 2017.
5. Ferent J, Ruat M, Traiffort E. Investigation of the proteolipid protein promoter activity during demyelination and repair. Differ. Res. Biol. Divers. 2013;85:182–189. doi: 10.1016/j.diff.2013.05.002.
6. Magalon K, Zimmer C, Cayre M, et al. Olesoxime accelerates myelination and promotes repair in models of demyelination. Ann. Neurol. 2012;71:213–226. doi: 10.1002/ana.22593.
7. Petiet A, Aigrot M-S, Stankoff B. Gray and White Matter Demyelination and Remyelination Detected with Multimodal Quantitative MRI Analysis at 11.7T in a Chronic Mouse Model of Multiple Sclerosis. Front. Neurosci. [Internet] 2016;10. doi: 10.3389/fnins.2016.00491.
8. Turati L, Moscatelli M, Mastropietro A, et al. In vivo quantitative magnetization transfer imaging correlates with histology during de- and remyelination in cuprizone-treated mice: QUANTITATIVE MAGNETIZATION TRANSFER IMAGING IN CUPRIZONE-TREATED MICE. NMR Biomed. 2015;28:327–337. doi: 10.1002/nbm.3253.
9. Skripuletz T, Gudi V, Hackstette D, Stangel M. De- and remyelination in the CNS white and grey matter induced by cuprizone: the old, the new, and the unexpected. Histol. Histopathol. 2011;26:1585–1597. doi: 10.14670/HH-26.1585.
10. Gudi V, Moharregh-Khiabani D, Skripuletz T, Koutsoudaki PN, Kotsiari A, Skuljec J, Trebst C, Stangel M. Regional differences between grey and white matter in cuprizone induced demyelination. Brain Res. 2009;1283:127–138. doi: 10.1016/j.brainres.2009.06.005.
11. Girard OM, Prevost VH, Varma G, Cozzone PJ, Alsop DC, Duhamel G. Magnetization transfer from inhomogeneously broadened lines (ihMT): Experimental optimization of saturation parameters for human brain imaging at 1.5 Tesla: Optimizing Saturation Parameters for ihMT Brain Imaging at 1.5T. Magn. Reson. Med. 2015;73:2111–2121. doi: 10.1002/mrm.25330.
12. Mchinda S, Varma G, Prevost VH, et al. Whole brain inhomogeneous Magnetization Transfer (ihMT) imaging: sensitivity enhancement within a steady-state gradient echo sequence. Magn. Reson. Med. 2017.
13. Prevost VH, Girard OM, Mchinda S, Varma G, Alsop DC, Duhamel G. On the boost effect of inhomogeneous Magnetization Transfer (ihMT). ISMRM Congr. 2017.
14. Brück W, Porada P, Poser S, Rieckmann P, Hanefeld F, Kretzschmar HA, Lassmann H. Monocyte/macrophage differentiation in early multiple sclerosis lesions. Ann. Neurol. 1995;38:788–796. doi: 10.1002/ana.410380514.
Figures