0925
A comparison of magnetization transfer, diffusion tensor imaging and ultrashort TE measurements in a murine model of demyelination1Université de Strasbourg, CNRS, ICube, FMTS, Strasbourg, France, 2Institut Mines Télécom Atlantique, INSERM, LaTIM, Brest, France
Synopsis
Exploration of myelin content in the brain and spinal cord is essential for monitoring pathologies such as multiple sclerosis. Quantitative MRI methods such as diffusion tensor imaging (DTI) and quantitative magnetization transfer imaging (qMT) already demonstrated efficiency in characterizing demyelination. Ultrashort echo time sequences were previously investigated for myelin characterization within long-T2 suppression condition. In this work, we propose to compare parameters from DTI, qMT, and Diff-UTE in ex-vivo brains, using a murine model of demyelination.
Introduction
Assessment of myelin content in brain regions is essential for monitoring pathologies such as multiple sclerosis. Quantitative MRI methods such as diffusion tensor imaging (DTI) and magnetization transfer imaging (qMT) have demonstrated sensitivity to demyelination in animal and human studies, but can be affected by others factors such as inflammation and gliosis1,2,3. Radial diffusivity ($$$\lambda_\perp$$$) is sensitive to myelin changes4, but remains sensitive to other factors such as axon diameter and crossing fiber bundles5. qMT probes macromolecular content by indirectly assessing exchange between bound and free proton pools6. The bound pool fraction ($$$f$$$), a metric derived from qMT, is sensitive to myelin content, but is also influenced by sequence-dependent parameters.
Several studies suggest that myelin can be directly imaged with ultrashort echo time (UTE) sequences, and thus overcoming the lack of specificity of other methods7,8,9. The Diff-UTE sequence was previously proposed as a short-T2 (T2<1 ms) selective method within a long-T2 suppression condition (T2>10 ms), and provided a high contrast in myelinated areas of an ex vivo mouse brain10.
In this study, we propose to compare parameters from DTI, qMT, and Diff-UTE in ex-vivo brains, using a murine model of demyelination through a cuprizone diet, typically resulting in a global demyelination of white and grey matter1,2,11.
Methods
Experiments were conducted on a 7T preclinical scanner (Bruker BioSpec, Ettlingen, Germany), using a 23-mm volume Tx/Rx coil. Female C57BL/6 mice (3 healthy vs. 4 cuprizone-fed with a respective mean weight of 20.0±1.5 g and 15.7±0.5 g) were sacrificed at 13 weeks of age. Demyelination was induced by cuprizone administration in standard chow (0.2%) for 5 consecutive weeks prior to sacrifice. Mice were perfused with 4% paraformaldehyde under deep anesthesia (preceded and followed by PBS flushing), and stored at 4°C into PBS. Fixed mouse heads were soaked into PFPE (Galden, Solvay) before scanning.
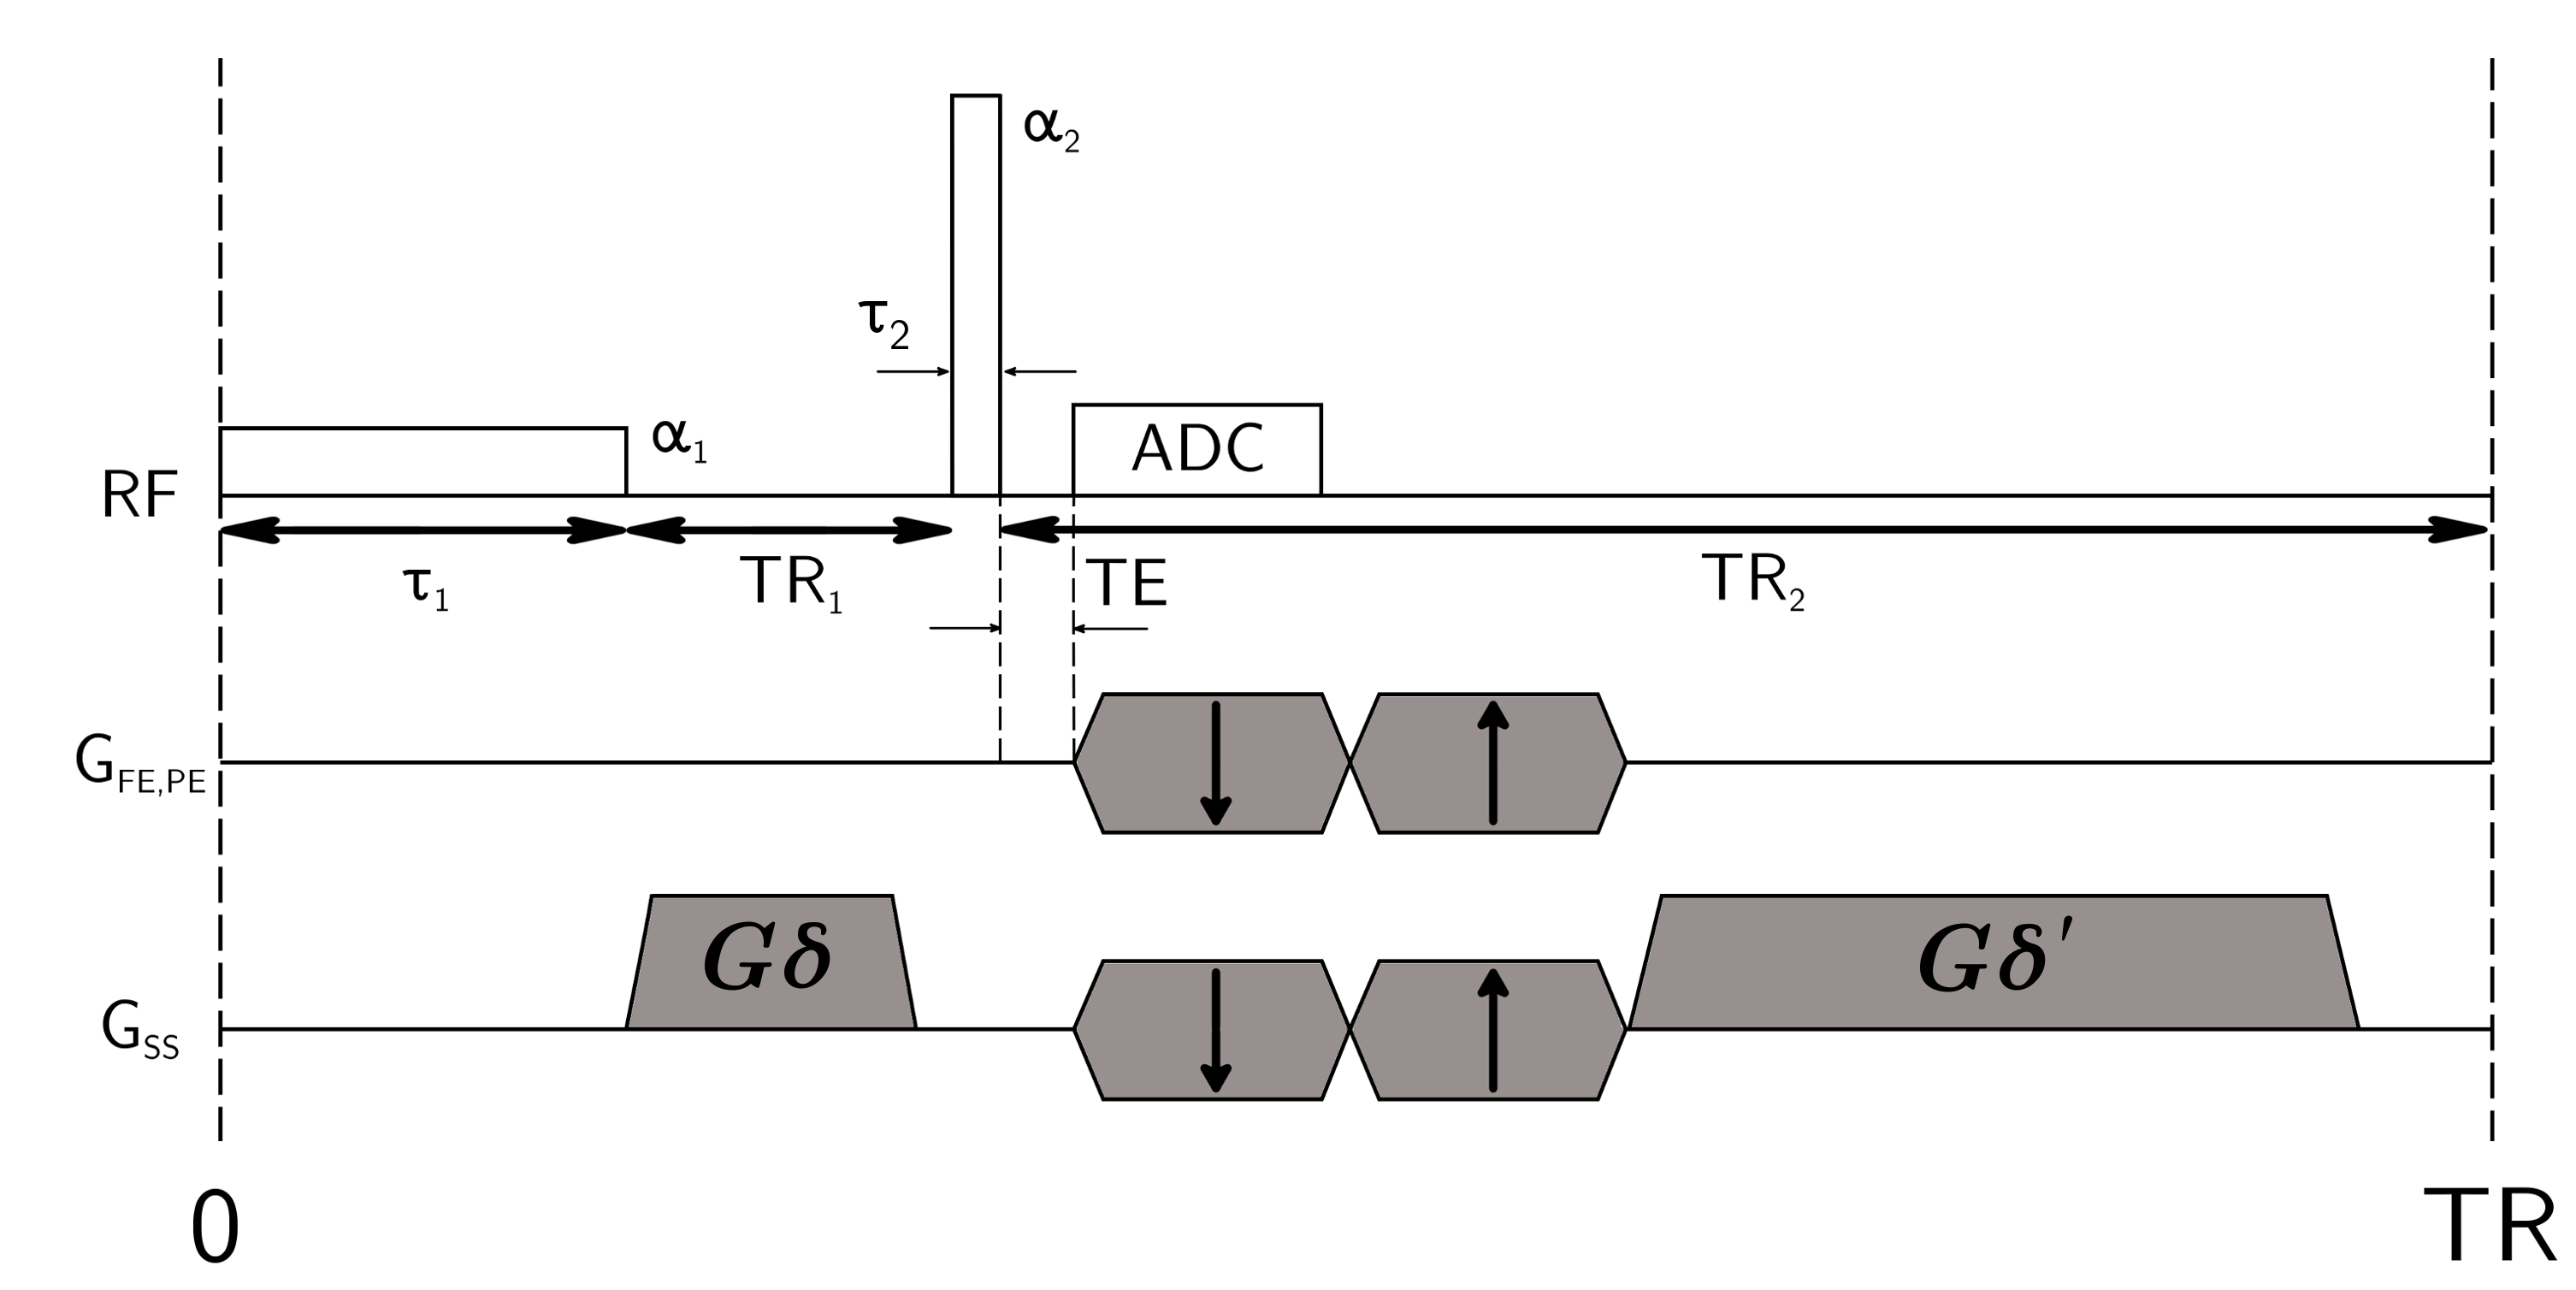
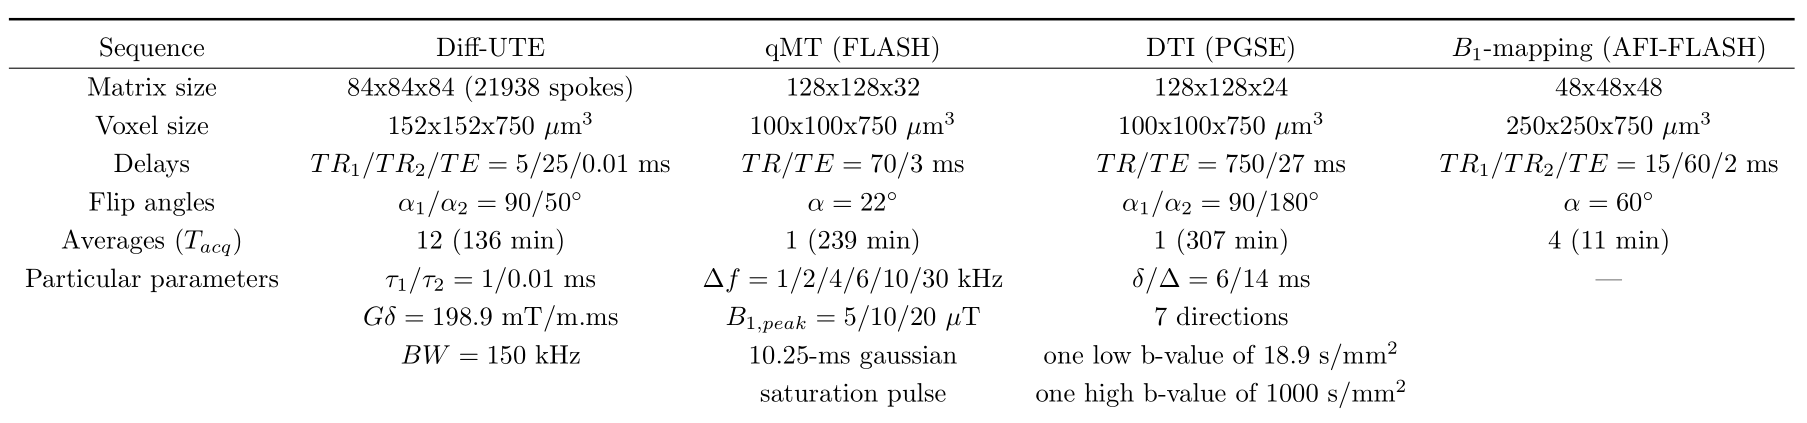
Diff-UTE pulse sequence is given in Figure 1. Diff-UTE, qMT, DTI and B1-mapping 3D acquisitions were performed using the protocol detailed in Figure 2.
qMT and B1-mapping sequences used strong spoiling gradients and appropriate RF spoiling12,13. To compensate for potential B0-drift effects, all images were registered onto the lowest b-value image from the DTI protocol using the ANTs registration package14, and denoised using BM4D15. Parameters were then estimated using a constrained non-linear least-square fitting process for DTI, and Sled and Pike's rectangular pulse model implemented in the qMTLab toolbox16 for qMT. Voxels were extracted in the corpus callosum (CC), external capsules (EC) and cortex from ROIs drawn following the highly contrasted fractional anisotropy maps in both groups. Diff-UTE signal was normalized (nDiff-UTE) to that of a piece of rubber (T2≈0.5 ms) considered as an inter-individual reference, and from a ROI positioned in the same slice throughout the scans. In both groups, mean and standard deviations of relevant parameters (normalized Diff-UTE signal, $$$f$$$ and $$$\lambda_\perp$$$) were estimated on the extracted ROIs. Spearman correlation coefficients between the metrics and nDiff-UTE signal in the white matter (concatenation of CC and EC voxels) were estimated. Additionally, logistic regressions of the group (healthy or cuprizone) vs. relevant parameters in the white matter ROIs were estimated and compared using the Akaike Information Criteria (AIC).
Results
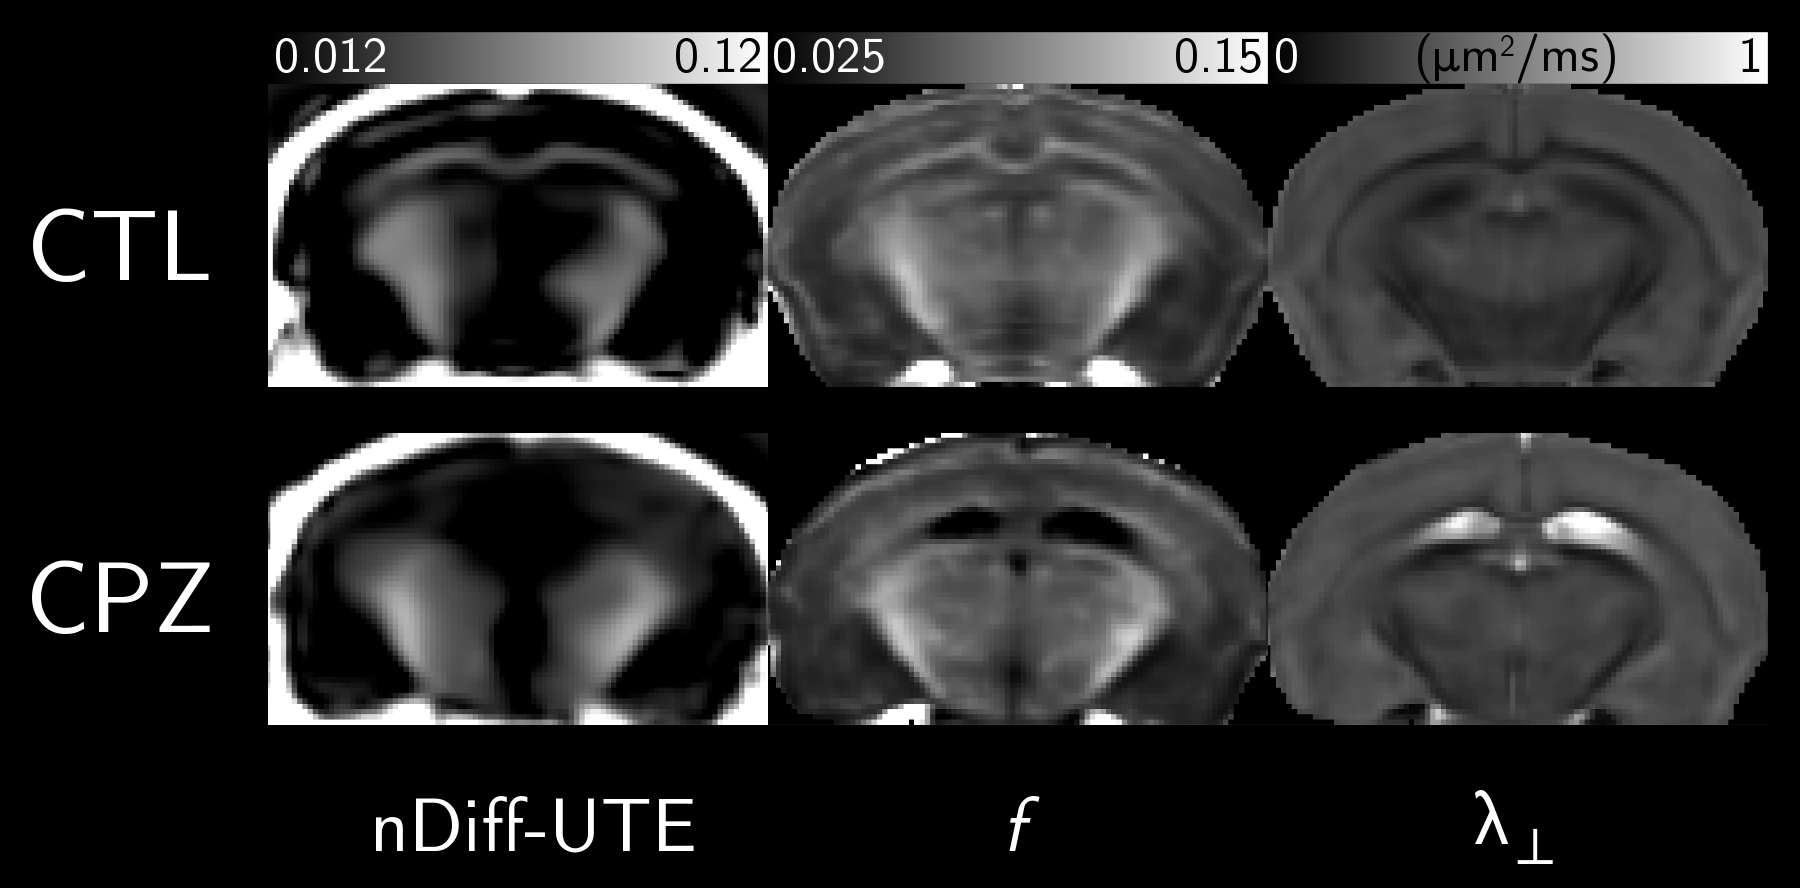
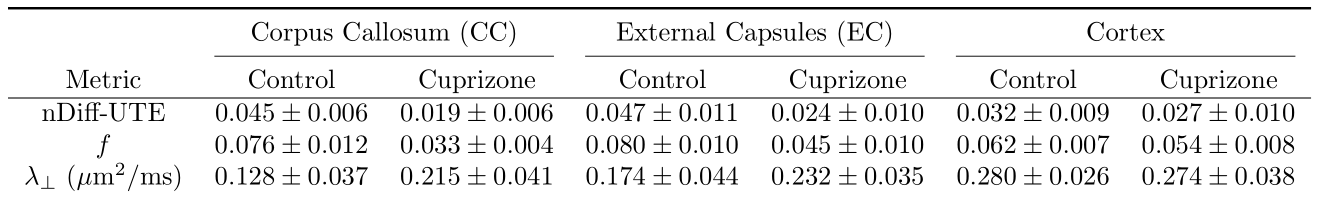
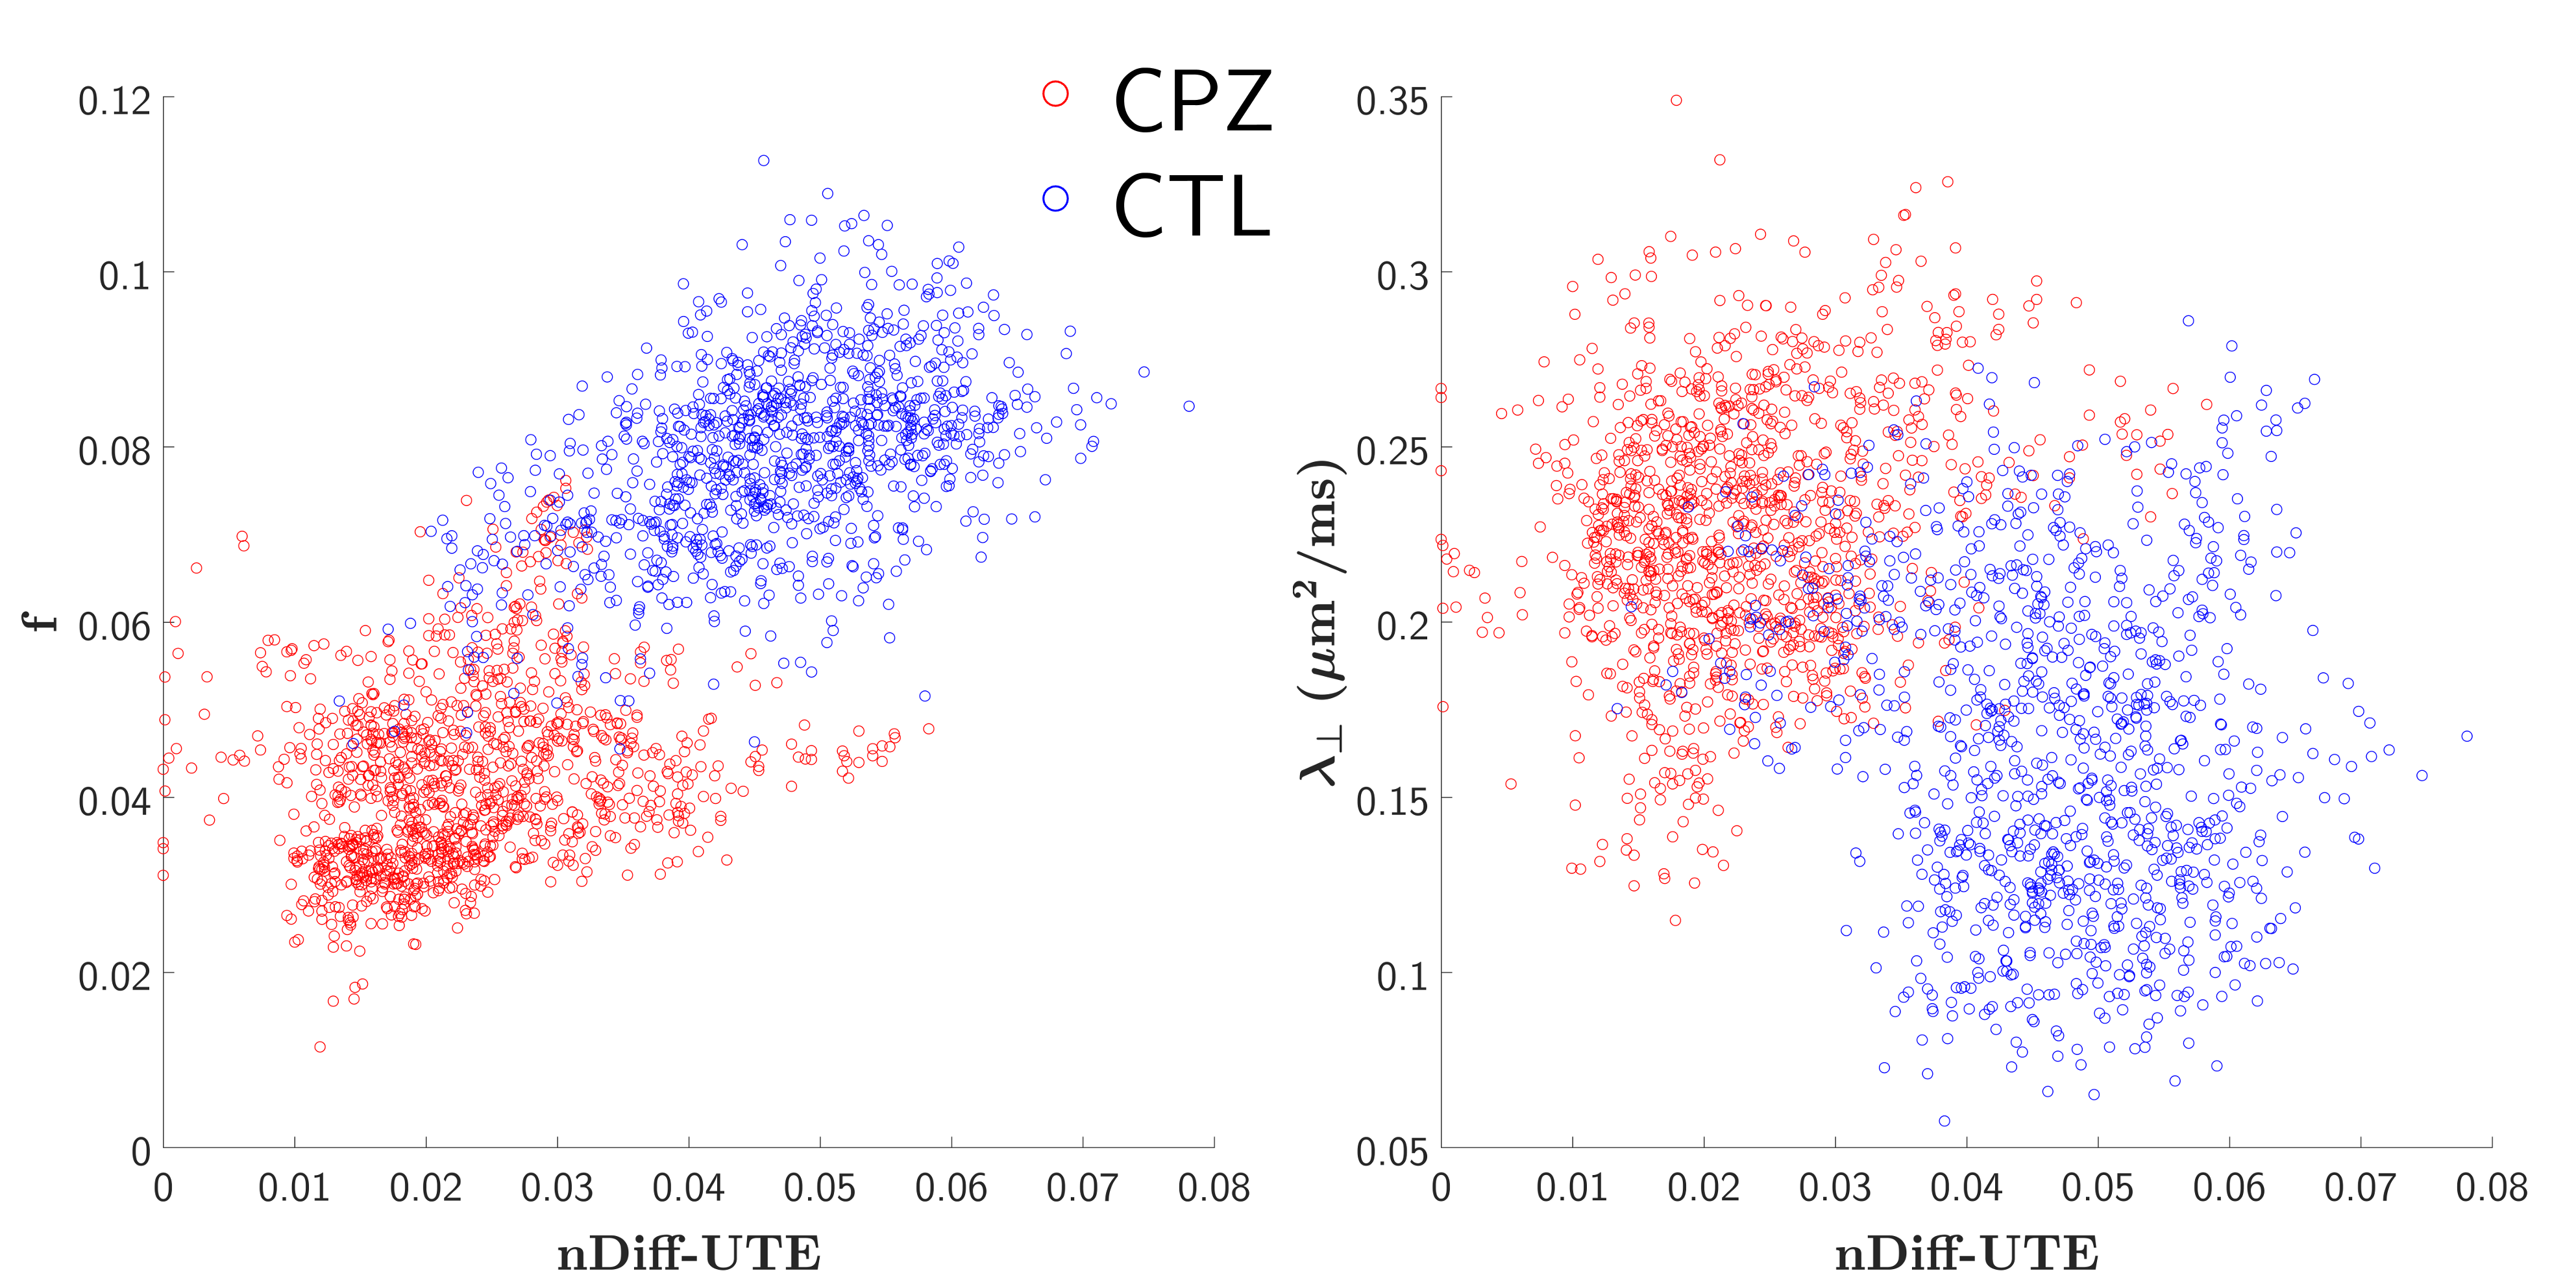
A montage of representative healthy and cuprizone-fed mice views is given in Figure 3. Metrics mean and standard deviations are shown in the table in Figure 4. Mean nDiff-UTE values showed sensitivity to demyelination (-58% in CC), and mean $$$\lambda_\perp$$$ and $$$f$$$ differences amounted respectively to +68% and -57% in the CC, consistent with the values reported in Ref. 1. The correlations with nDiff-UTE signal amounted respectively in control (nCTL=1047), cuprizone (nCPZ=1182) and combined groups to 0.47, 0.31 and 0.79 for $$$f$$$, and -0.14, 0.18 and -0.46 for $$$\lambda_\perp$$$ (p<0.001). All three logisitic regressions were statistically significant (p<0.001), and their AIC established that nDiff-UTE (AIC=1280) is more informative than $$$\lambda_\perp$$$ (AIC=2089), but less than $$$f$$$ (AIC=582). Scatter plots are shown in Figure 5.Discussion and Conclusion
While changes have been detected using the three metrics between healthy and cuprizone-fed groups, the relative information content is unequal from one metric to another. The generated signals in UTE (and therefore in Diff-UTE) are most likely related to pools with slightly longer T2 relaxation times than the saturated one in MT (T2≈10 μs), as previously reported in studies of the normal appearing white matter7,8,9,17, and may carry complementary information about the actual macromolecular content. Further work will investigate correlations of the estimated metrics with histology using Myelin Basic Protein immunostaining.Acknowledgements
The authors thank Dr. Laura Harsan for helpful discussions.References
1. Thiessen JD, Zhang Y, Zhang H, Wang L, Buist R, Del Bigio MR, Kong J, Li XM, Martin M. Quantitative MRI and ultrastructural examination of the cuprizone mouse model of demyelination. NMR in Biomedicine 2013;26:1562–1581
2. Khodanovich MY, Sorokina IV, Glazacheva VY, Akulov AE, Nemirovich-Danchenko NM, Romashchenko AV, Tolstikova TG, Mustafina LR, Yarnykh VL. Histological validation of fast macromolecular proton fraction mapping as a quantitative myelin imaging method in the cuprizone demyelination model. Scientific Reports 2017;7:46686
3. Enzinger C, Barkhof F, Ciccarelli O, Filippi M, Kappos L, Rocca MA, Ropele S, Rovira A, Schneider T, de Stefano N, Vrenken H, WheelerKingshott C, Wuerfel J, Fazekas F. Nonconventional MRI and microstructural cerebral changes in multiple sclerosis. Nature Reviews Neurology 2015;11:676–686
4. Song SK, Yoshino J, Le TQ, Lin SJ, Sun SW, Cross AH, Armstrong RC. Demyelination increases radial diffusivity in corpus callosum of mouse brain. NeuroImage 2005;26:132–140
5. Hüppi PS, Dubois J. Diffusion tensor imaging of brain development. Seminars in Fetal and Neonatal Medicine 2006;11:489–497
6. Sled JG, Pike GB. Quantitative imaging of magnetization transfer exchange and relaxation properties in vivo using MRI. Magnetic Resonance in Medicine 2001;46:923–931
7. Horch RA, Nyman JS, Gochberg DF, Dortch RD, Does MD. Characterization of 1H NMR signal in human cortical bone for magnetic resonance imaging. Magnetic Resonance in Medicine 2010;64:680–687
8. Wilhelm MJ, Ong HH, Wehrli SL, Li C, Tsai PH, Hackney DB, Wehrli FW. Direct magnetic resonance detection of myelin and prospects for quantitative imaging of myelin density. Proceedings of the National Academy of Sciences 2012;109:9605–9610
9. Du J, Ma G, Li S, Carl M, Szeverenyi NM, Vanden-Berg S, Corey-Bloom J, Bydder GM. Ultrashort echo time (UTE) magnetic resonance imaging of the short T2 components in white matter of the brain using a clinical 3T scanner. NeuroImage 2014;87:32–41
10. Soustelle L, Loureiro de Sousa P, Lamy J, Rousseau F, Armspach J. Myelin and Cortical Bone Short-T2 Quantification Using Saturation and Diffusion-Based Long-T2 Suppression in a Steady-State 3D-UTE Sequence. in Proceedings of the 25th Annual Meeting of ISMRM, Honolulu, Hawaii, USA, 2017. p. 4030
11. Turati L, Moscatelli M, Mastropietro A, Dowell NG, Zucca I, Erbetta A, Cordiglieri C, Brenna G, Bianchi B, Mantegazza R, Cercignani M, Baggi F, Minati L. In vivo quantitative magnetization transfer imaging correlates with histology during de- and remyelination in cuprizone-treated mice. NMR in Biomedicine 2015;28:327–337
12. Zur Y, Wood ML, Neuringer LJ. Spoiling of transverse magnetization in steady-state sequences. Magnetic Resonance in Medicine 1991;21:251–263
13. Nehrke K. On the steady-state properties of actual flip angle imaging (AFI). Magnetic Resonance in Medicine 2009;61:84–92
14. Avants BB, Tustison NJ, Song G, Cook PA, Klein A, Gee JC. A reproducible evaluation of ANTs similarity metric performance in brain image registration. NeuroImage 2011;54:2033–2044
15. Maggioni M, Katkovnik V, Egiazarian K, Foi A. Nonlocal Transform-Domain Filter for Volumetric Data Denoising and Reconstruction. IEEE Transactions on Image Processing 2013;22:119–133
16. Cabana JF, Gu Y, Boudreau M, Levesque IR, Atchia Y, Sled JG, Narayanan S, Arnold DL, Pike GB, CohenAdad J, Duval T, Vuong MT, Stikov N. Quantitative magnetization transfer imaging made easy with qMTLab: Software for data simulation, analysis, and visualization. Concepts in Magnetic Resonance Part A 2015;44A:263–277
17. Boucneau T, Tang S, Han M, Henry RG, Xu D, Larson PE. In Vivo Characterization of Brain Ultrashort-T2 Components. in Proceedings of the 24th Annual Meeting of ISMRM, Singapore, Singapore, 2016. p. 330
Figures