0924
Neurochemical signature of the metabolic mechanisms underlying de- & re-myelination in the mouse’s cerebellum1Institute for Biomedical Engineering, ETH and University of Zurich, Zurich, Switzerland, 2NORD Discovery & Translational Area, Pharmaceutical research and Early Development, Roche Innovation Center Basel, F. Hoffmann-La Roche Ltd, Basel, Switzerland, 3Institute of Pharmacology and Toxicology, University of Zurich, Zurich, Switzerland, 4Neuroscience Center Zurich, Zurich, Switzerland
Synopsis
Because of an increasing therapeutic need to understand the underlying mechanism of myelin damage and repair in pathologies such as multiple sclerosis (MS), we used 1H-MRS to longitudinally characterize the metabolic changes in the cerebellum associated with de- and re-myelination in the cuprizone mouse model. Our results, in line with similar findings in the corpus callosum, suggest that a group of metabolites provide a unique neurochemical signature of cuprizone induced de- and re-myelination. Additionally, we observe a reversible and robust increase of GABA levels upon cuprizone feeding that goes in contradiction with current trends in clinical studies of MS patients.
Introduction
Recent studies have shown that alterations to myelin may be a core pathological feature of many neuroinflammatory and neurodegenerative diseases of the central nervous system including multiple sclerosis1 (MS) and Alzheimer’s disease2. Thus understanding the mechanisms regulating myelin damage and repair appears to be essential to the successful development of new therapeutic strategies in these diseases areas. To this end, localized proton magnetic resonance spectroscopy (1H-MRS) provides a valuable non-invasive tool to extract metabolic information on various aspects of in-vivo neurochemistry. In combination with the current large number of clinical 1H-MRS studies on patients with MS, preclinical 1H-MRS studies have the potential to provide a deeper understanding on these underlying mechanisms.
The cuprizone mouse model is a well-established model inducing oligodendroglia death and demyelination, most notably in the corpus callosum, but also in the cortex, hippocampus and cerebellum3. After its withdrawal, spontaneous re-myelination occurs making it a very appealing model for the study of de- and re-myelination processes. Past studies involving 1H-MRS in this mouse model have focused solely on the corpus callosum, establishing a biochemical fingerprinting of cuprizone-induced demyelination4. In this study, we used 1H-MRS in the cuprizone mouse model to longitudinally characterize the neurochemical changes associated with de- and re-myelination in a another brain area were strong demyelination similarly occurs: the cerebellum.
Material and Methods
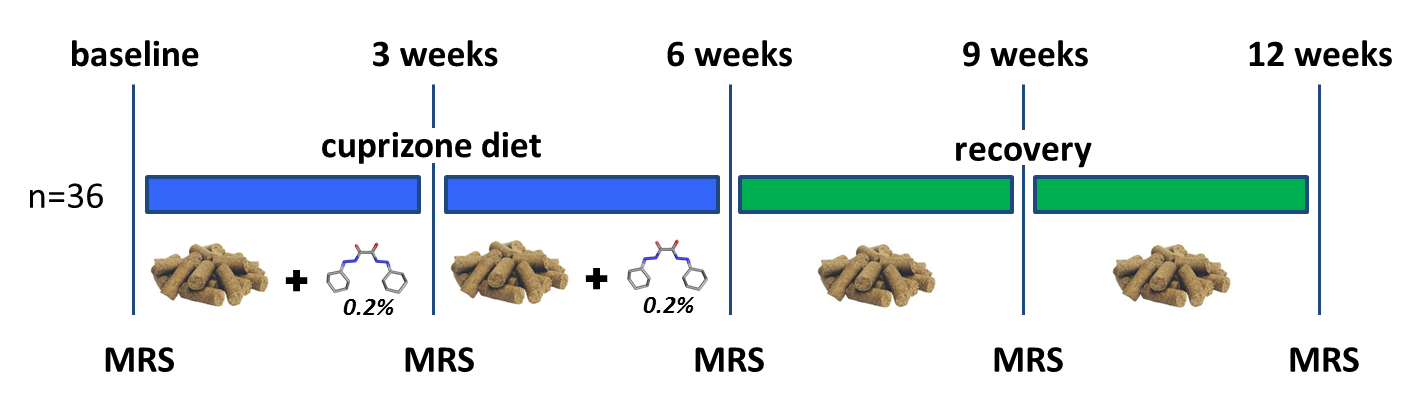
Studies were conducted on 36 male C57BL/6N mice (25g - 3 months old) and were carried out on a BioSpec 94/30 (Bruker BioSpin MRI GmbH, Ettlingen, Germany) small animal MR system equipped with a cryogenic quadrature coil used for transmission and signal reception (Bruker BioSpin AG, Fällanden, Switzerland). All animals were fed for 6 weeks with milled chow (Provimi Kliba AG, Switzerland) containing 0.2% cuprizone (Sigma-Aldrich, Germany) to induce a robust demyelination throughout the brain3. After that, animals were placed on a cuprizone free diet to allow for spontaneous re-myelination (figure.1). All animals underwent a baseline MRI session at the start of the cuprizone diet and were then imaged every 3 weeks for 12 weeks (6 weeks of cuprizone plus 6 weeks of recovery).
Isoflurane 4% (mixed with oxygen enriched) air was used for inducing anesthesia. Once the animal was positioned on the support, Isoflurane was reduced to 1.5% for the rest of the procedure. Mice were intubated, mechanically ventilated and paralyzed via an i.v. injection of pancuronium bromide (Sigma-Aldrich, Germany).
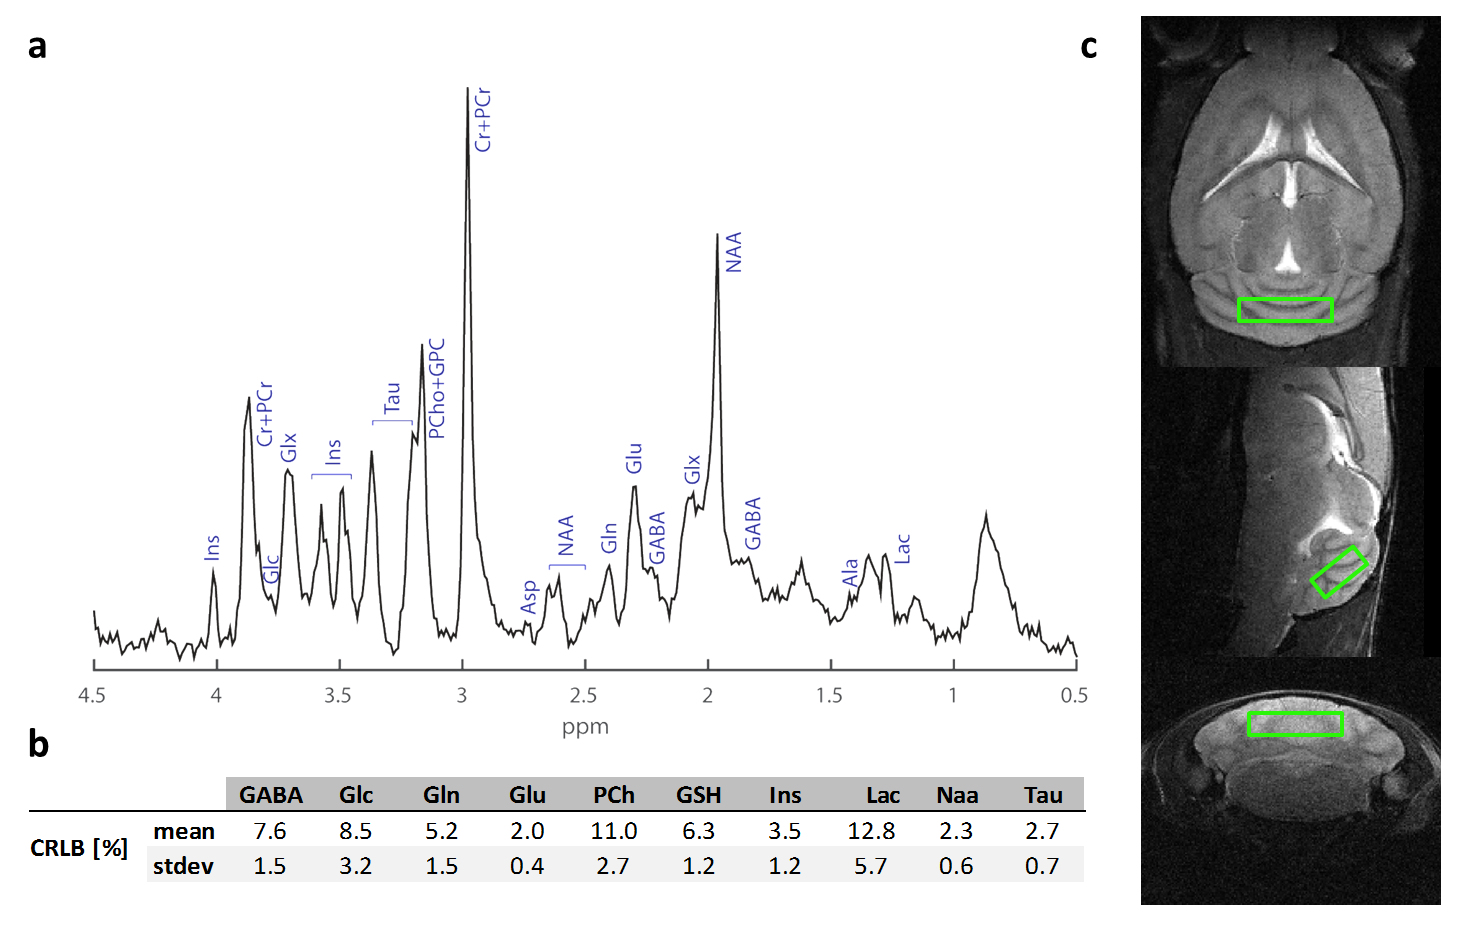
After acquiring axial, coronal and sagittal T2 Turbo RARE anatomical reference scans (TR/TE=3500/13ms, RARE factor=8), a single voxel (6.4µl) was selected in the cerebellum (figure.2c) using a STEAM5 excitation scheme (TE/TR= 4.6/3000ms, Tacq=12min). Scans were performed using VAPOR for water suppression; 1st and 2nd order shimming was performed using Fieldmaps. Absolute quantification was performed using LCModel6 whereas the statistical analysis was carried using a linear mixed model.
Results and discussions
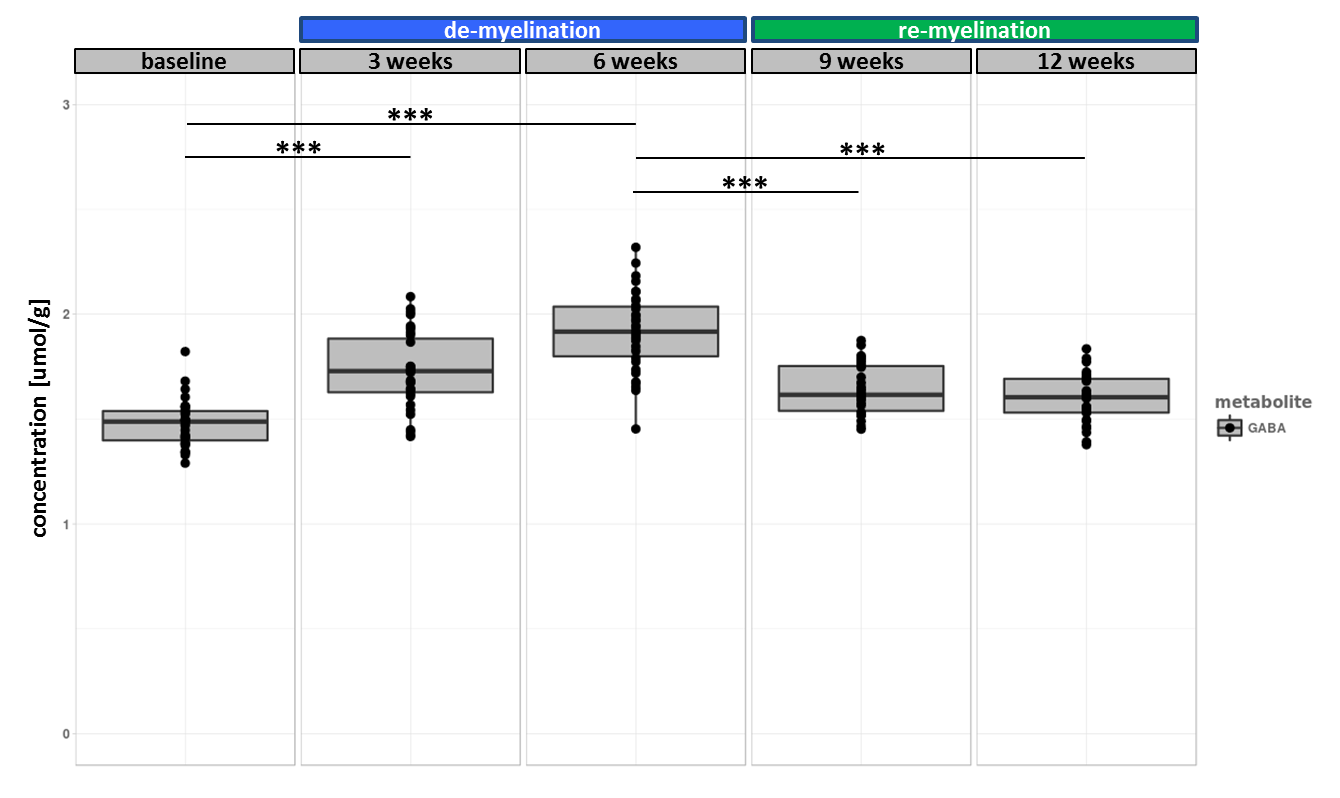
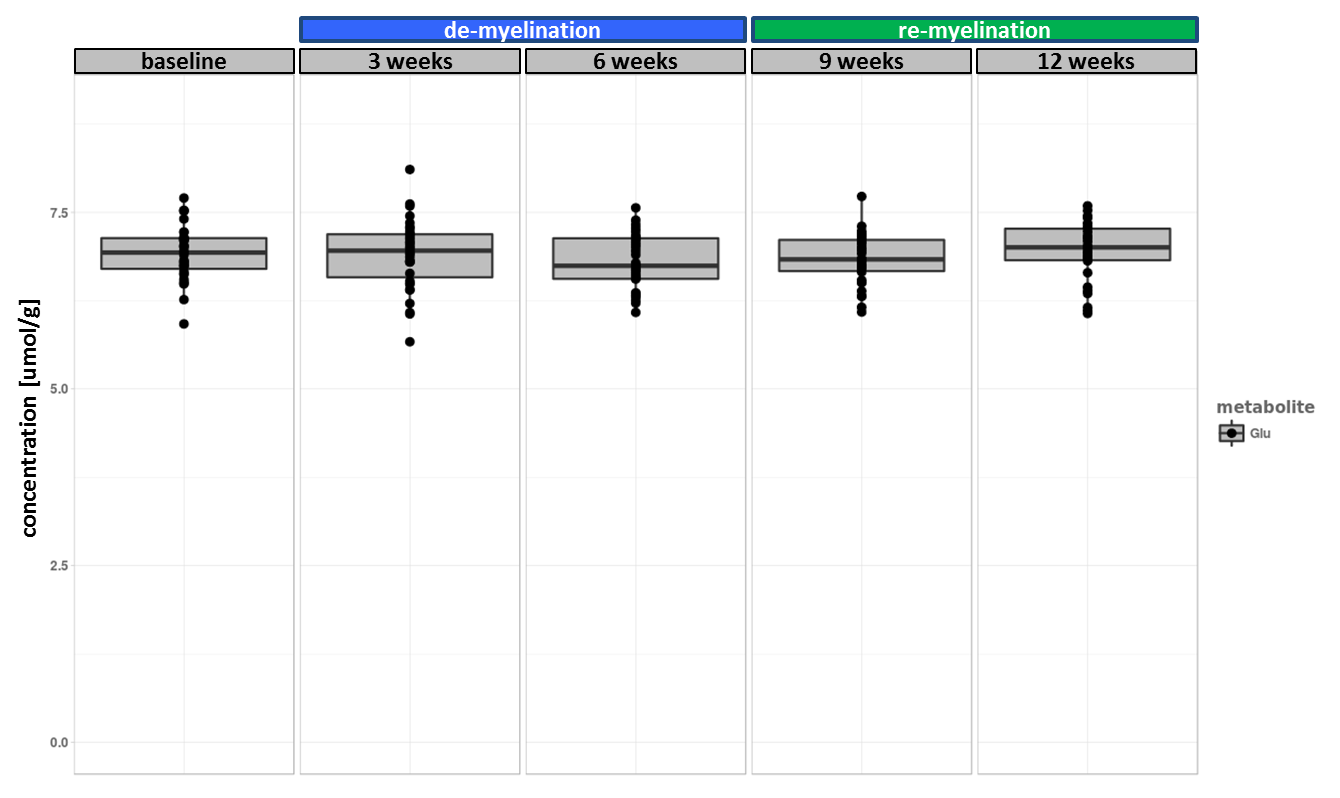
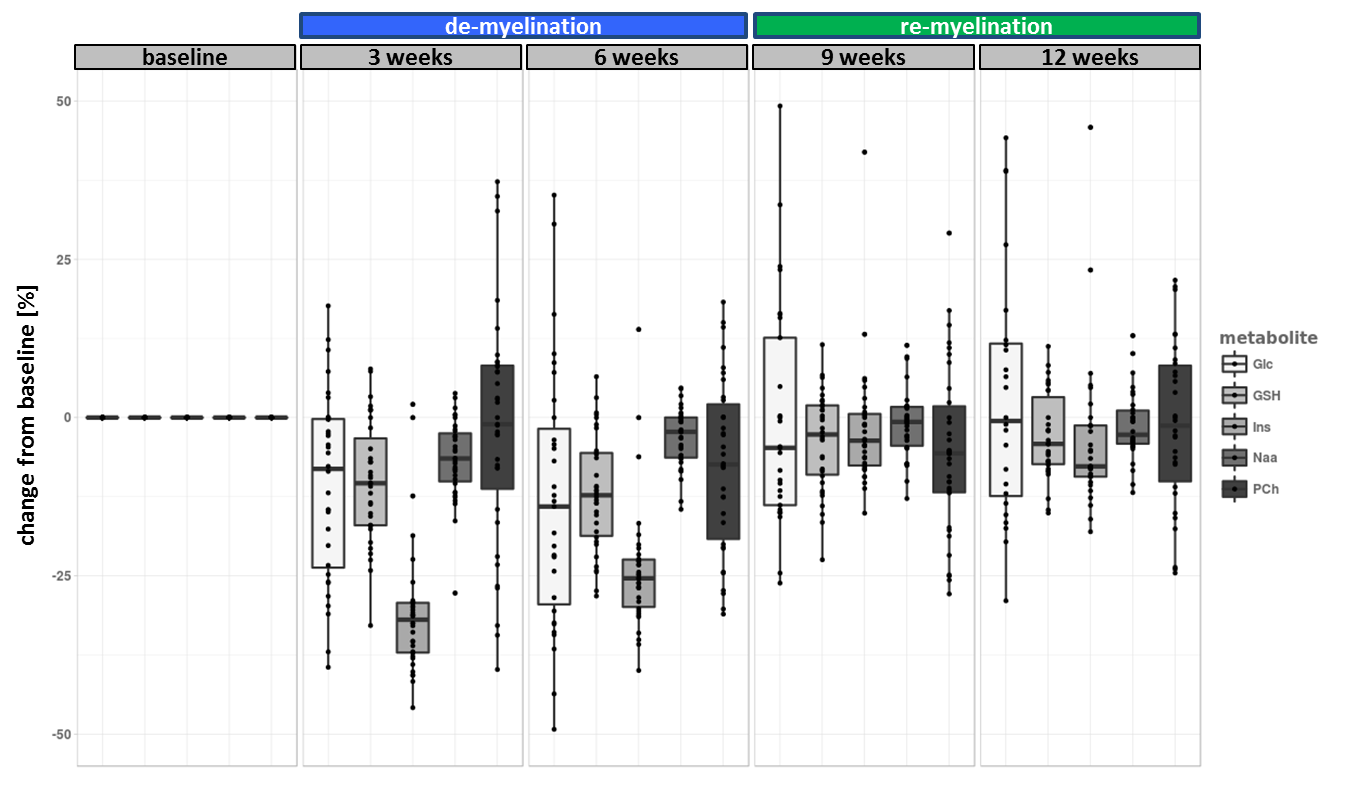
The experiment was well conducted with only very few drop outs (95% of data available at week 9 and 83% available at the last time point). The consistently good spectral quality (figure.2) allowed us to reliably quantify a total of 26 neurochemicals including 3 classes of lipids and 5 macromolecules. During the cuprizone diet, we observed a consistent and significant decrease in glucose (Glc), glutathione (GSH), glycerophosphorylcholine (GPC), inositol (Ins), N-acetylaspartate (NAA), N-acetylaspartylglutmate (NAAG), phosphorylcholine (PCh) concentrations visible at already 3 weeks of cuprizone feeding (figure.3). These observations are in accordance with reports from a similar study in the corpus callosum4 for the exception of glutamate (Glu) levels, which in our study did not significantly deviate from baseline values (figure.4). Elevated levels of glutamate in the corpus callosum of cuprizone fed mice and acute MS lesions have been observed and often linked to glutamate excitotoxicity induced by inflammation7. The lack of glutamate response could hint towards a potentially less severe inflammatory response in the cerebellum. Aside from the lipids and the macromolecules, our data shows a very robust and reversible increase in GABA levels (figure.5) that has not been reported by other animal studies. This even goes in contradiction with recent articles claiming that decreased levels of GABA can be seen in patients with progressive MS8.
Apart from inositol, all metabolite levels returned to their baseline values 6 weeks after discontinuation of the cuprizone.
Conclusion
This study in accordance to previous results of 1H-MRS in the corpus callosum confirms that glucose, glutathione, glycerophosphorylcholine, N-acetylaspartate, inositol and phosphorylcholine are sensitive indicators to monitor the dynamic cuprizone-induced pathological and reversible changes throughout the mouse brain. In addition, these findings open the question on the role of GABA in this mouse model; however further work is needed to answer this question.Acknowledgements
No acknowledgement found.References
1. Bennett JL et al, Update on inflammation, neurodegeneration, and immuno-regulation in multiple sclerosis: Therapeutic implications. Clin Neuropharmacol 2009; 10.1097/WNF.0b013e3181880359
2. Bartzokis G. Alzheimer's disease as homeostatic responses to age-related myelin breakdown. Neurobiol Aging. 2011; 10.1016/j.neurobiolaging.2009.08.007
3. Groebe A. et al. Cuprizone treatment induces distinct demyelination, astrocytosis, and microglia cell invasion or proliferation in the mouse cerebellum. Cerebellum 2009; 10.1007/s12311-009-0099-3
4. Orije J. et al. Longitudinal monitoring of metabolic alterations in cuprizone mouse model of multiple sclerosis using 1H-magnetic resonance spectroscopy, NeuroImage 2015; 10.1016/j.neuroimage.2015.04.012
5. Frahm J. et al, Localized proton spectroscopy using stimulated echoes,J. Magn. Reson. 1987; 9(1):79-93
6. Provencher SW. Estimation of metabolite concentrations from localized in vivo proton NMR spectra. Magn. Reson. Med. 1993; 30(6):672-9.
7. Srinivasan R. et al. Evidence of elevated glutamate in multiple sclerosis using magnetic resonance spectroscopy at 3 T, Brain 2005; 10.1093/brain/awh467
8. Cawley N. et al. Reduced gamma-aminobutyric acid concentration is associated with physical disability in progressive multiple sclerosis, Brain 2015; 10.1093/brain/awv209.
Figures