0923
Correlations between quantiative myelin imaging using macromolecular proton fraction, neurogenesis, and oligodendrogenesis in the murine model of cuprizone-induced demyelination1Research Institute of Biology and Biophysics, Laboratory of Neurobiology, Tomsk State University, Tomsk, Russian Federation, 2Institute of Cytology and Genetics SB RAS, Novosibirsk, Russian Federation, 3Dapartment of Radiology, University of Washington, Seattle, WA, United States
Synopsis
This study aimed to identify associations between neurogenesis in the neurogenic niches, oligodendrogenesis, and myelination in the murine cuprizone demyelination/remyelination model. Myelination was quantified by the recently proposed macromolecular proton fraction (MPF) mapping method. Neurogenesis and oligodendrogenesis were assessed by immunohistology. Negative correlations were found between oligodendrogenesis and neurogenesis in both the subventricular zone and dentate gyrus. Correlation between MPF and oligodendrogenesis was also negative, whereas correlation between MPF and neurogenesis was positive. Associations between MPF and neurogenesis/oligodendrogenesis reveal the feasibility of using MPF as a surrogate marker of reparative processes in demyelinating diseases.
Introduction
The subventricular zone (SVZ) is a germinal zone not only for neural progenitors (NPCs), but also for oligodendrocyte progenitors (OPCs), which subsequently migrate towards the corpus callosum (CC) and cortex1-3. Recent studies showed that SVZ-derived progenitors contribute to myelin repair in various pathological conditions2,3. Cuprizone-induced demyelination is characterized by increased production of OPCs3,4. Since OPCs are partially derived from the neurogenic niche, we hypothesize that neurogenesis and oligodendrogenesis are inversely related and correlated with the extent of myelin loss. A recently developed quantitative MRI method, fast macromolecular proton fraction (MPF)5-7 mapping, was used to quantify myelination. This method showed a promise as a biomarker of myelin in human8 and animal studies9-11.Purpose
To identify associations between neurogenesis, oligodendrogenesis, and myelination in the murine cuprizone model.Methods
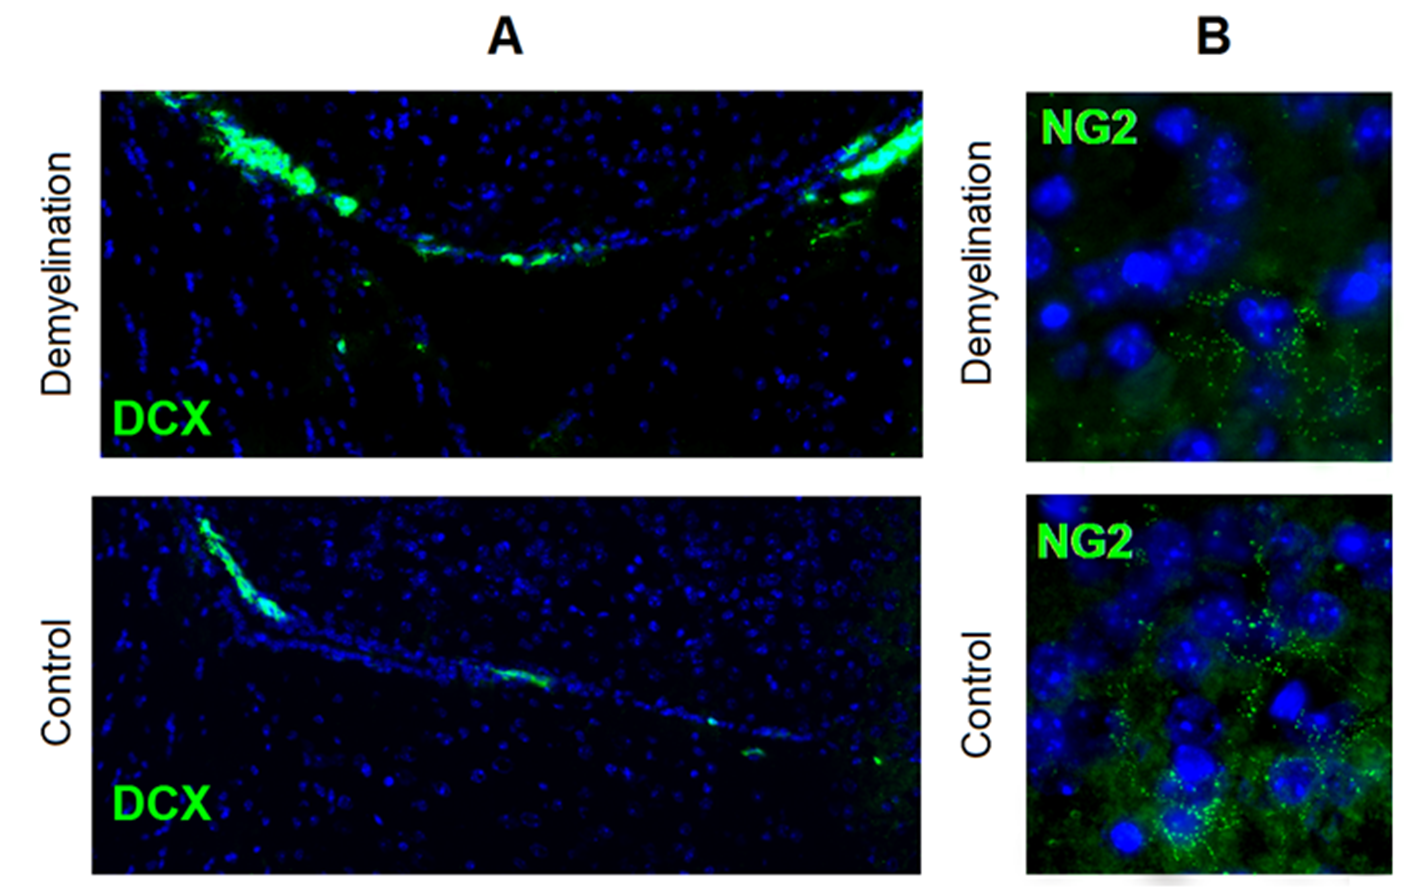
Animal procedures and immunochemistry. Three groups of adult male CD1 mice were used: a control group (n=4), a demyelination group (n=4), and a remyelination group (n=5). Mice in the demyelination group received 0.5% cuprizone with standard chow for 10 weeks. The remyelination group returned to a normal diet after 5 weeks of cuprizone treatment. The controls received standard chow for 10 weeks. After 10 weeks of cuprizone treatment the mice were MRI scanned and then transcardially perfused with 4% phosphate buffer solution; their brains were removed and frozen. Coronal 10 µm sections were received in two brain locations (-1.58 mm and +0.74 mm from bregma) and defined according to a mouse brain atlas12. The sections were stained with doublecortin (DCX) for the detection of NPCs and with neuro-glial antigen (NG2) for the detection of OPCs.
Image Acquisition. The mice were imaged on an 11.7 T small animal MRI scanner (Bruker BioSpec 117/16 USR). A fast high-resolution 3D MPF mapping protocol was implemented according to the previously described single-point method with synthetic reference image normalization5,6.
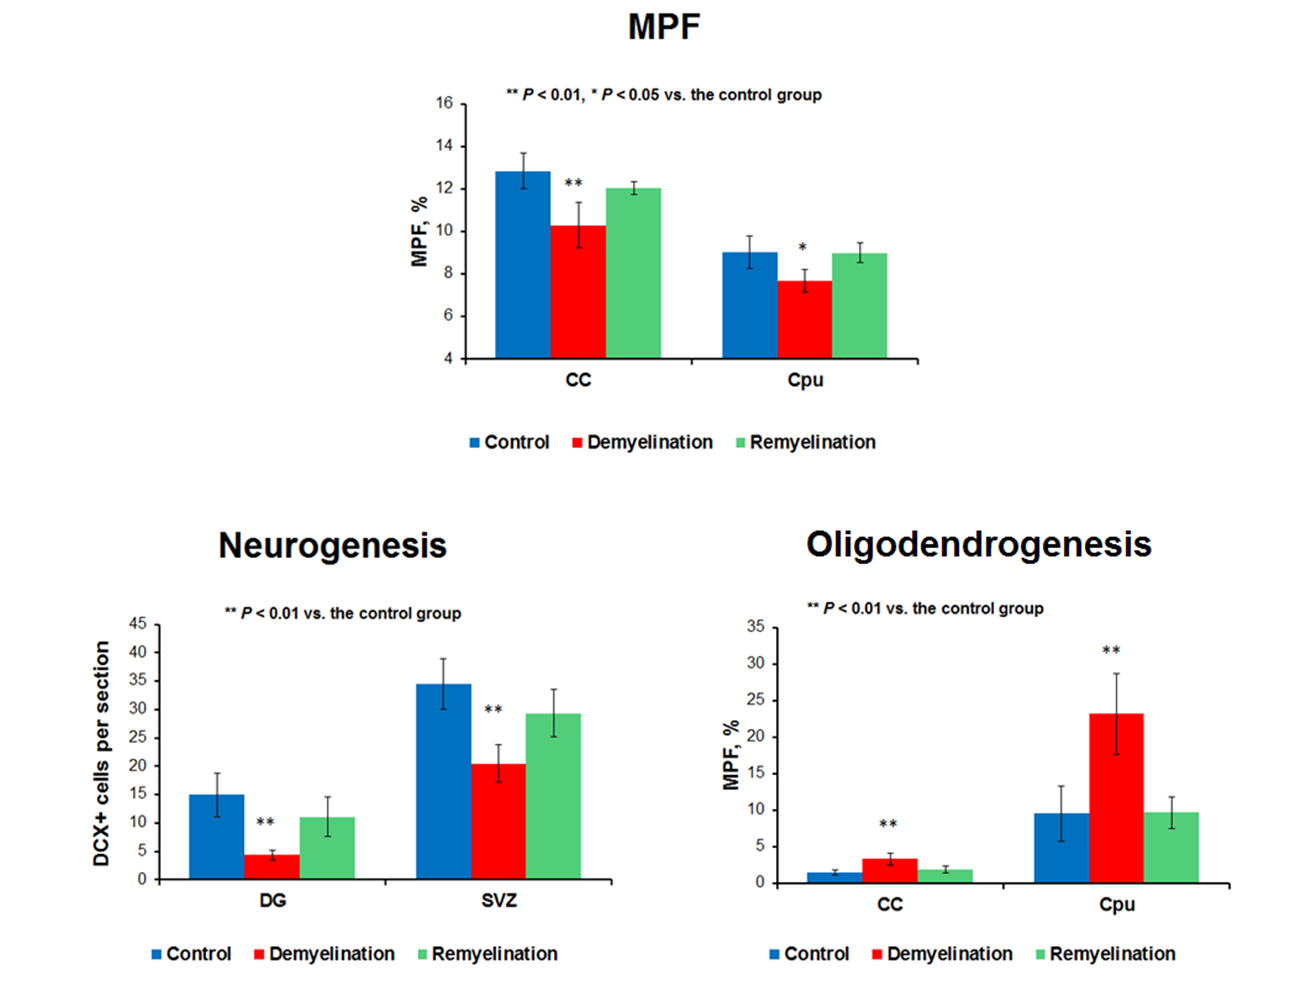
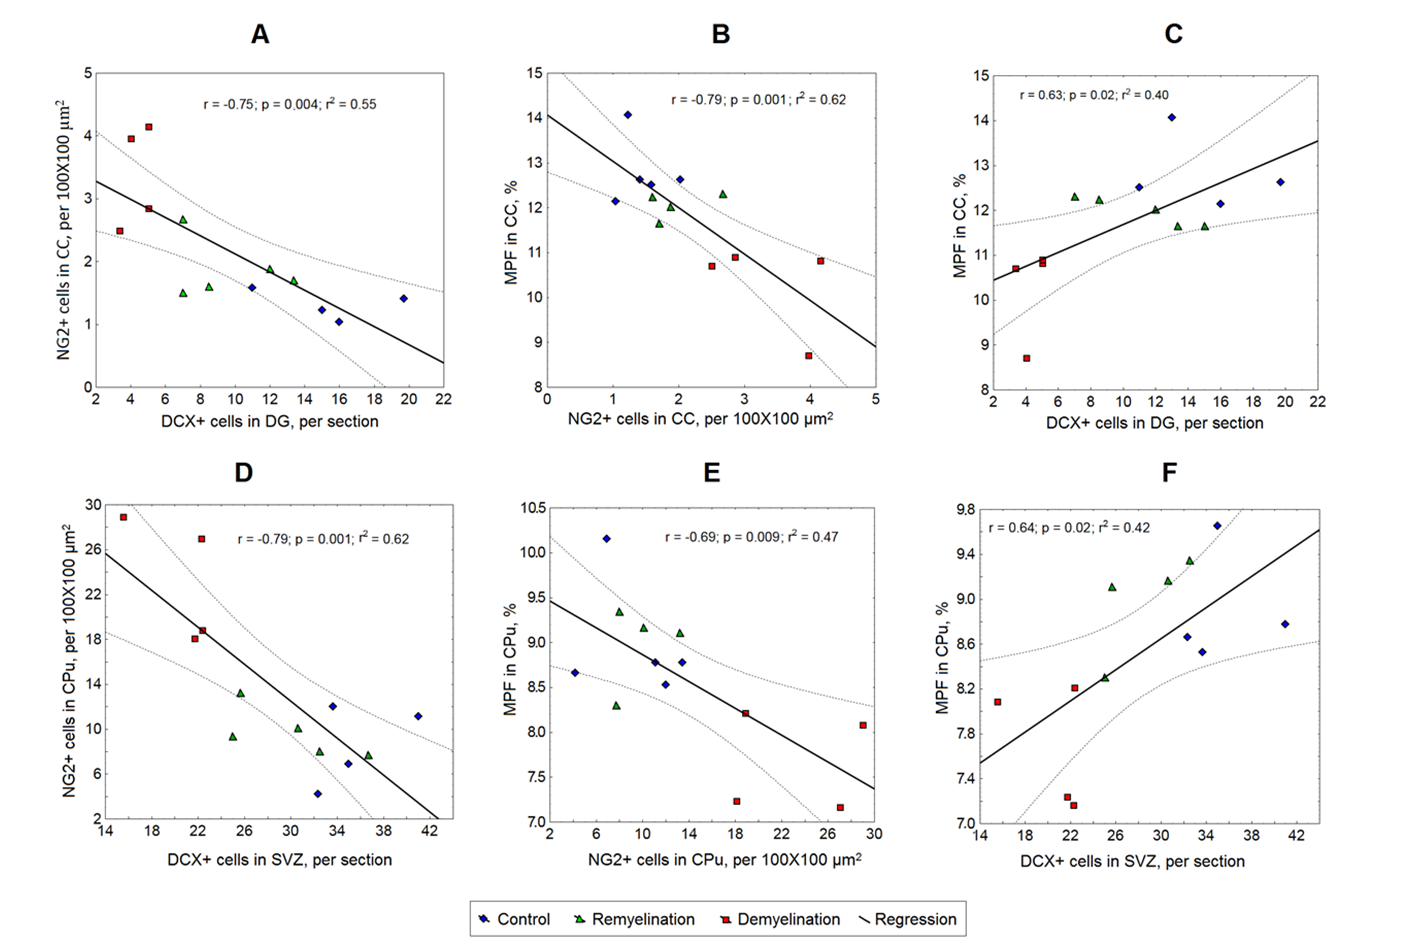
Image Analysis. MPF maps and microphotographs of DCX- or NG2-stained sections were analyzed in two brain locations (-1.58 mm and +0.74 mm from bregma). MPF values were measured for the CC and caudoputamen (CPu). Regions-of-interest (ROIs) of standard size were manually placed on MPF maps within the investigated brain structures and quantified using the procedure described by Khodanovich at al.10. Neurogenesis was evaluated as the number of DCX+ cells in the SVZ and hippocampal dentate gyrus (DG) per section. Oligodendrogenesis was evaluated as the number of NG2+ cells within ROIs of standard size in the CC and CPu adjacent to the neurogenic niches. MPF values, the number of DCX+ cells and the number of NG2+ cells, were compared between animals from the demyelination, remyelination and control groups using an independent-samples t-test. The Pearson correlation coefficient (r) was used to determine associations between MPF values and the number of NPCs and OPCs.
Results
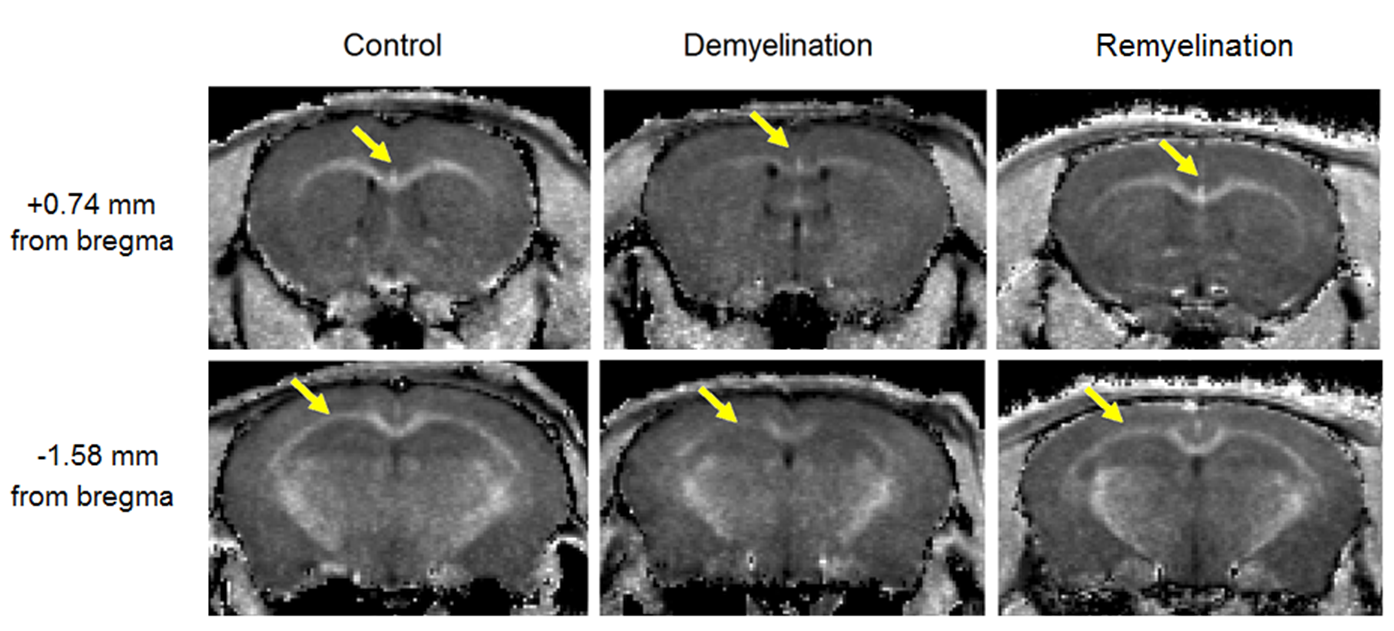
Examples of MPF maps in the two explored brain locations for mice from the control, demyelination, and remyelination group are presented in Fig. 1. The mice from the demyelination group showed visually reduced tissue contrast on MPF maps, especially in the CC (Fig. 1). MPF maps of the mice from the remyelination group did not differ from the controls. In the demyelination group a visible reduction in neurogenesis was observed both in the SVZ (Fig. 2A) and DG neurogenic niches. On the contrary, the number of immature oligodendrocytes (NG2+ cells) was increased both in the CC and CPu (Fig. 2B). Quantitative analysis showed a significant demyelination according to MPF in the cuprizone-treated mice both in the CC and CPu (p < 0.05) (Fig. 3). The number of NPCs in the DG and SVZ was significantly decreased (p < 0.01) in the demyelination group (Fig. 2). The number of OPCs was significantly increased in all studied structures (p < 0.05) (Fig. 2). Cuprizone abolition restored all parameters to the control levels. Significant negative correlations were found between the OPC and NPC numbers in both the SVZ (CC: r=-0.70, CPu: r=-0.67, p<0.05) and DG (CC: r=-0.73, CPu: r=-0.70, p<0.05) (Fig.4). Correlation between MPF and OPCs was also negative (r=-0.50; p<0.05), whereas correlation between MPF and NPCs was positive (SVZ: r=0.61; DG: r=0.69; p<0.05).Conclusion
An inverse relationship between NPCs in the neurogenic zones and OPCs in non-neurogenic demyelinated areas suggests that cuprizone-induced overproduction of OPCs may originate from the shift of stem cell differentiation in both the SVZ and DG towards oligodendrocyte lineage followed by OPCs’ migration to demyelinated areas. Correlation of MPF with neurogenesis and oligodendrogenesis reveals the feasibility of using MPF as a surrogate marker of reparative processes in demyelinating diseases.Acknowledgements
Russian Science Foundation (project #14-45-00040).References
1. Menn B, et al. Origin of oligodendrocytes in the subventricular zone of the adult brain. J Neurosci. 2006;26:7907–7918.
2. Cayre M, et al. Migrating and myelinating potential of subventricular zone neural progenitor cells in white matter tracts of the adult rodent brain. Mol Cell Neurosci. 2006; 31: 748–758.
3. Waly B El, Macchi M, Cayre M, Durbec P. Oligodendrogenesis in the normal and pathological central nervous system. Front Neurosci. 2014; 8: 145.
4. Matsushima GK, Morell P. The neurotoxicant cuprizone, as a model to study demyelination and remyelination in the central nervous system. Brain Pathol. 2001; 11: 107–116.
5. Yarnykh VL. Fast macromolecular proton fraction mapping from a single off-resonance magnetization transfer measurement. Magn Reson Med. 2012; 68: 166–178.
6. Yarnykh VL. Time-efficient, high-resolution, whole brain three-dimensional macromolecular proton fraction mapping. Magn Reson Med. 2016; 75: 2100–2106.
7. Naumova AV, et al. High-resolution three-dimensional macromolecular proton fraction mapping for quantitative neuroanatomical imaging of the rodent brain in ultra-high magnetic fields. Neuroimage. 2016; 10.1016/j.neuroimage.2016.09.036.
8. Yarnykh, V. L., et al. Fast whole-brain three-dimensional macromolecular proton fraction mapping in multiple sclerosis. Radiology. 2015; 274: 210–220.
9. Underhill HR, Rostomily RC, Mikheev AM, Yuan C, Yarnykh VL. Fast bound pool fraction imaging of the in vivo rat brain: Association with myelin content and validation in the C6 glioma model. Neuroimage 2011; 54: 2052–2065.
10. Khodanovich MYu, et al. Histological validation of fast macromolecular proton fraction mapping as a quantitative myelin imaging method in the cuprizone demyelination model. Sci Rep. 2017; 7: 46686.
11. Samsonov A, et al. Quantitative MR imaging of two-pool magnetization transfer model parameters in myelin mutant shaking pup. Neuroimage. 2012; 62: 1390–1398.
12. Paxinos G, Franklin K. The mouse brain in stereotactic coordinates. London: 2nd ed. Academic Press; 2001.
Figures