0922
An optimised subtraction approach for subtractive NCE-MRA techniques based on principal component analysis1Department of Radiology, University of Cambridge, Cambridge, United Kingdom
Synopsis
An optimised subtraction approach is developed to improve the background signal suppression in subtractive Non-Contrast-Enhanced MR Angiography (NCE-MRA) and Venography (NCE-MRV) techniques. Principal component analysis (PCA) is used to correct the intensity difference of background tissue in dark-blood images (DBIs) and bright-blood images (BBIs). Compared with the direct subtraction operation, the proposed approach significantly improved the background signal suppression in all the evaluated cases including femoral Fresh Blood Imaging (FBI)-MRA, iliac Flow-Sensitive Dephasing (FSD)-MRV and FSD-MRA for the thoracic central veins.
Introduction
Conventional subtractive Non-Contrast-Enhanced MR Angiography (NCE-MRA) methods, such as Flow-Sensitive Dephasing (FSD)1 and Fresh Blood Imaging (FBI)2, generate angiography by subtracting dark-blood images (DBIs) from bright-blood images (BBIs). However, the veins and other tissues appear with a different intensity level in BBIs and DBIs, normally higher in BBIs for FSD and FBI, which results in residual signal in the subtracted images. Also, residual artery signal exists in NCE-MR Venography (NCE-MRV) images, which could potentially affect clinical diagnosis. In this study, a PCA-based model was developed to correct the intensity difference of veins and other tissues between the BBIs and DBIs and improve the background suppression effect.Methods
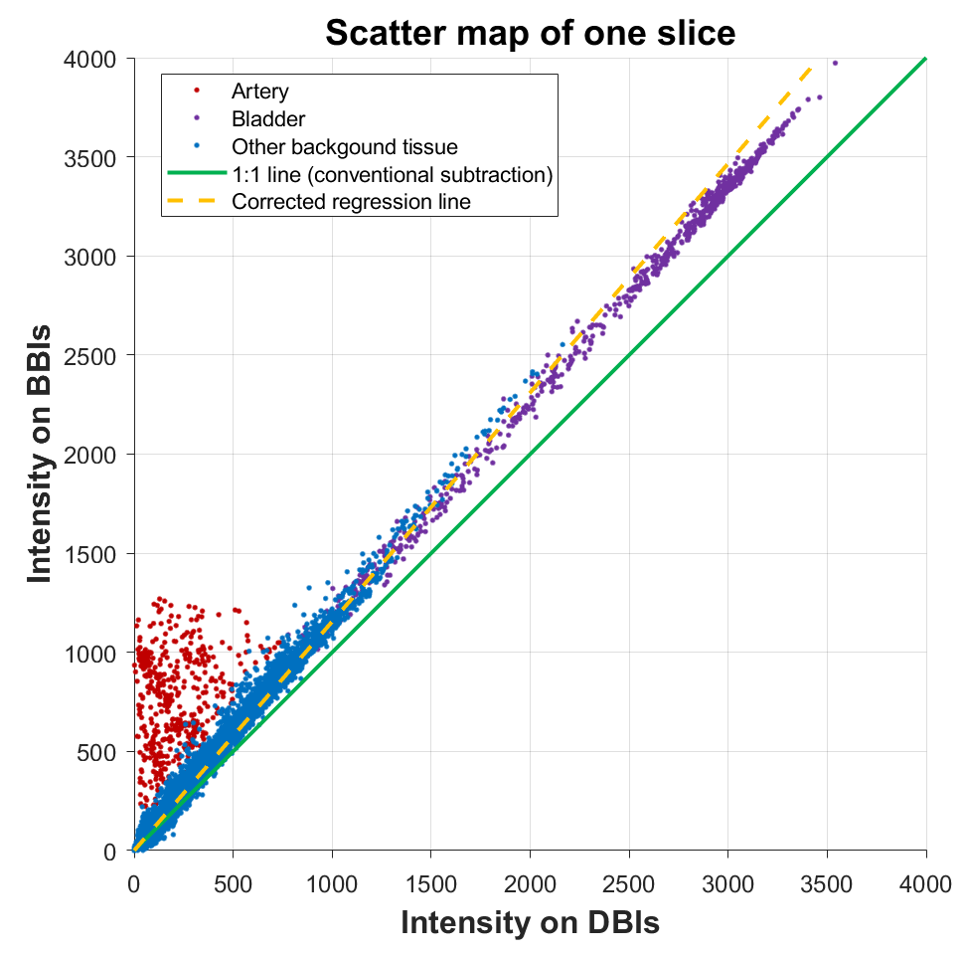
Fig. 1 is the scatter map of the intensities of each pixel on DBIs and BBIs for one single slice (femoral FBI-MRA). It can be observed that the artery signal pixels mainly locate at the top left of the scatter map, whereas the background tissue signal pixels distribute along a determined regression line. In conventional NCE-MRA/MRV techniques, the intensity value for a pixel P(x, y) is obtained by subtracting its intensity on DBIs (ID) from its intensity on BBIs (IB) , which is proportional to the distance between the pixels and the line y=x (green line) on the scatter map (d1). Then, only the positive values are kept for the angiogram. However, for most FBI and FSD cases, the intensity of background tissue appears higher on BBIs than DBIs. Therefore, the direct subtraction will lead to residual background signal because there is still a considerable distance between the tissue and the 1:1 line (d3). This is especially obvious for the tissue with high signal intensity, such as the bladder (purple points). Therefore, a corrected regression line with a slope larger than one (yellow line) is desirable for suppressing signal of background tissue. In this study, the slope k of the expected regression line is estimated by the PCA model. PCA converts the coordinates of the pixels on the scatter map into a set of values of linearly uncorrelated variables called principal components. The slope of the expected regression line is then determined from the first principal component, which describes the direction of maximum variance of the data. Then, the intensity for the pixel P(x, y) on the angiogram is defined as the shortest distance between P and the PCA-based regression line (d2).
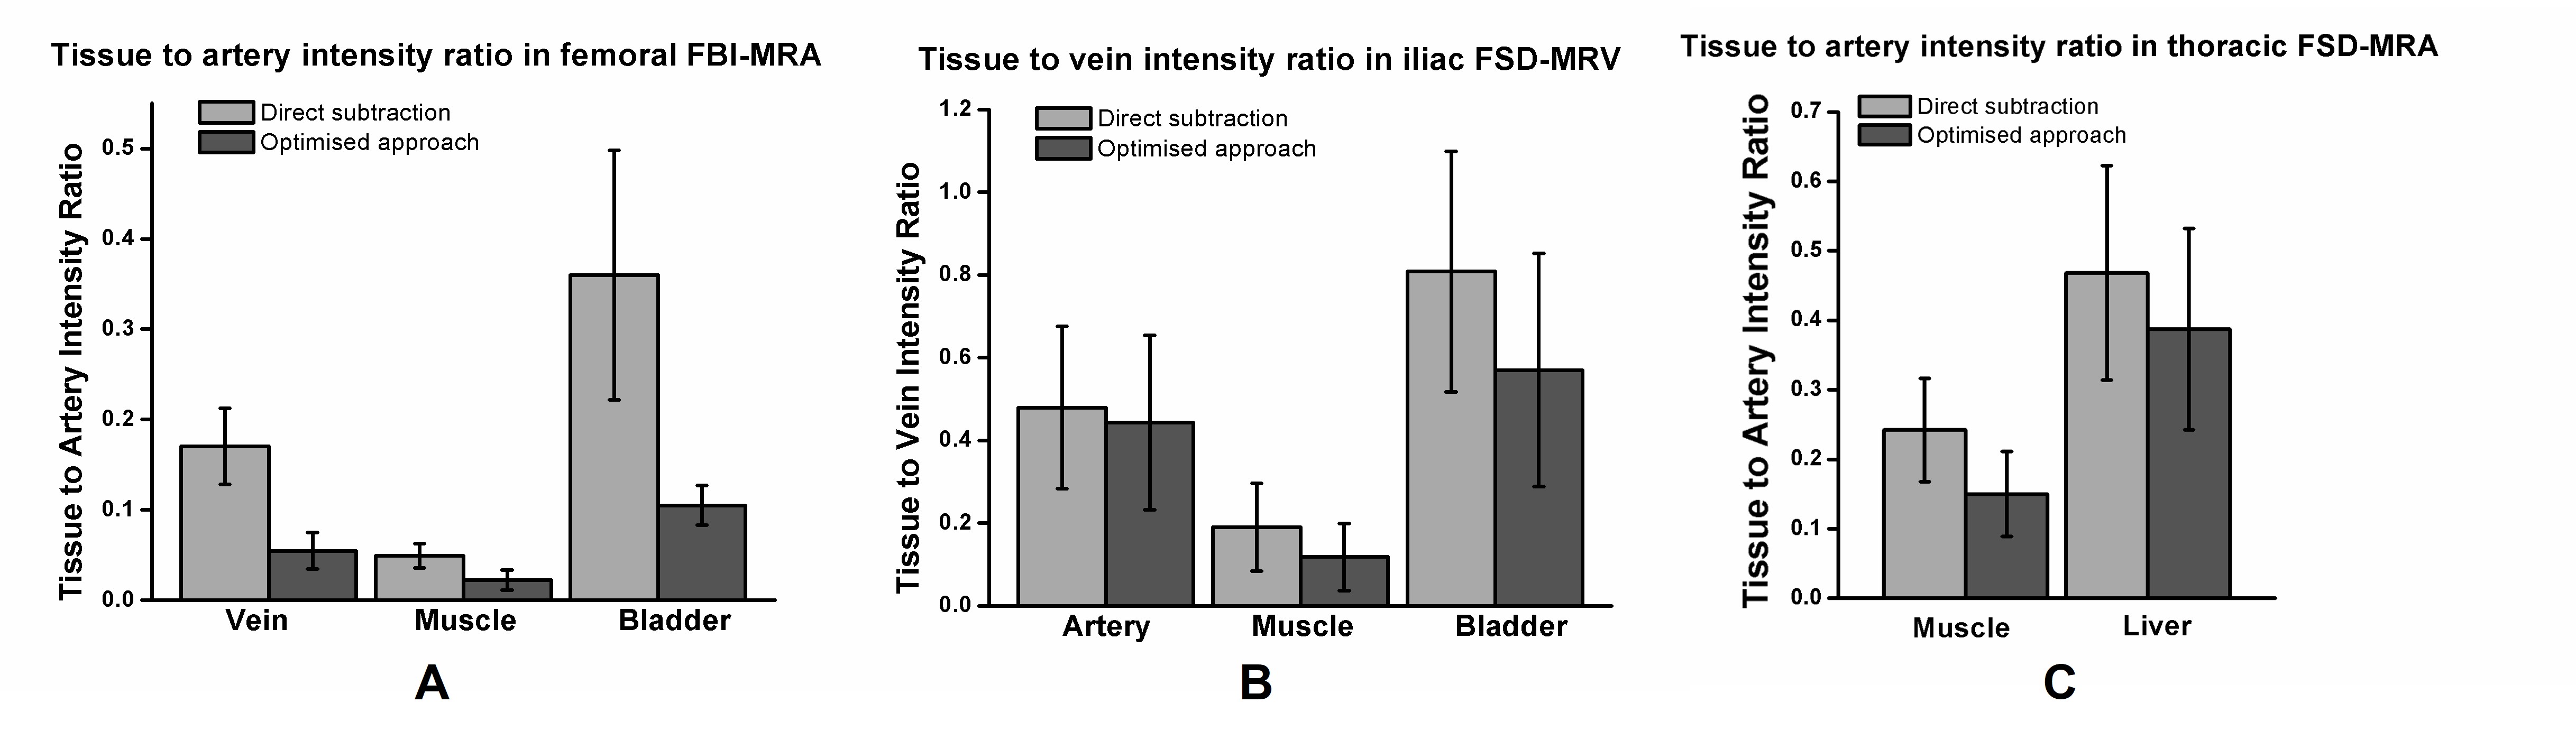
The datasets include 10 coronal femoral FBI-MRA datasets (TR 3 RR interval, TE 60ms, ETL 60-90, matrix 224×224, 48-80 slices of 2 mm, FOV 40 cm) from 5 healthy volunteers, 24 coronal thoracic FSD-MRA datasets (DANTE-bSSFP, flip angle 65°, TE/TR=1.0/2.7 ms, matrix 256×256, FoV 40 cm, 32 slices of 4 mm) from 24 healthy volunteers and 10 coronal iliac FSD-MRV datasets (iMSDE-bSSFP, flip angle 65°, TE/TR=1.2/3.0 ms, matrix 256×256, FoV 40 cm, 52 slices of 2.4 mm) from 7 healthy volunteers. All the images were acquired using a 1.5 T MRI system (GE Healthcare, Waukesha, WI). For FBI-MRA images aiming to show only arteries, the intensity ratios of vein to artery, muscle to artery and bladder to artery were calculated, whereas the intensity ratios of artery to vein, muscle to vein and bladder to vein were calculated for iliac FSD-MRV images. The thoracic DANTE-FSD-MRA images contain both arteries and veins, therefore only muscle to artery and liver to artery intensity ratios were calculated. Signal was measured from ROIs drawn in representative locations in the target regions. The quantitative results of the new approach were compared with the results of the direct subtraction over different subjects using a paired, two-sided Student t-test.
Results and Discussion
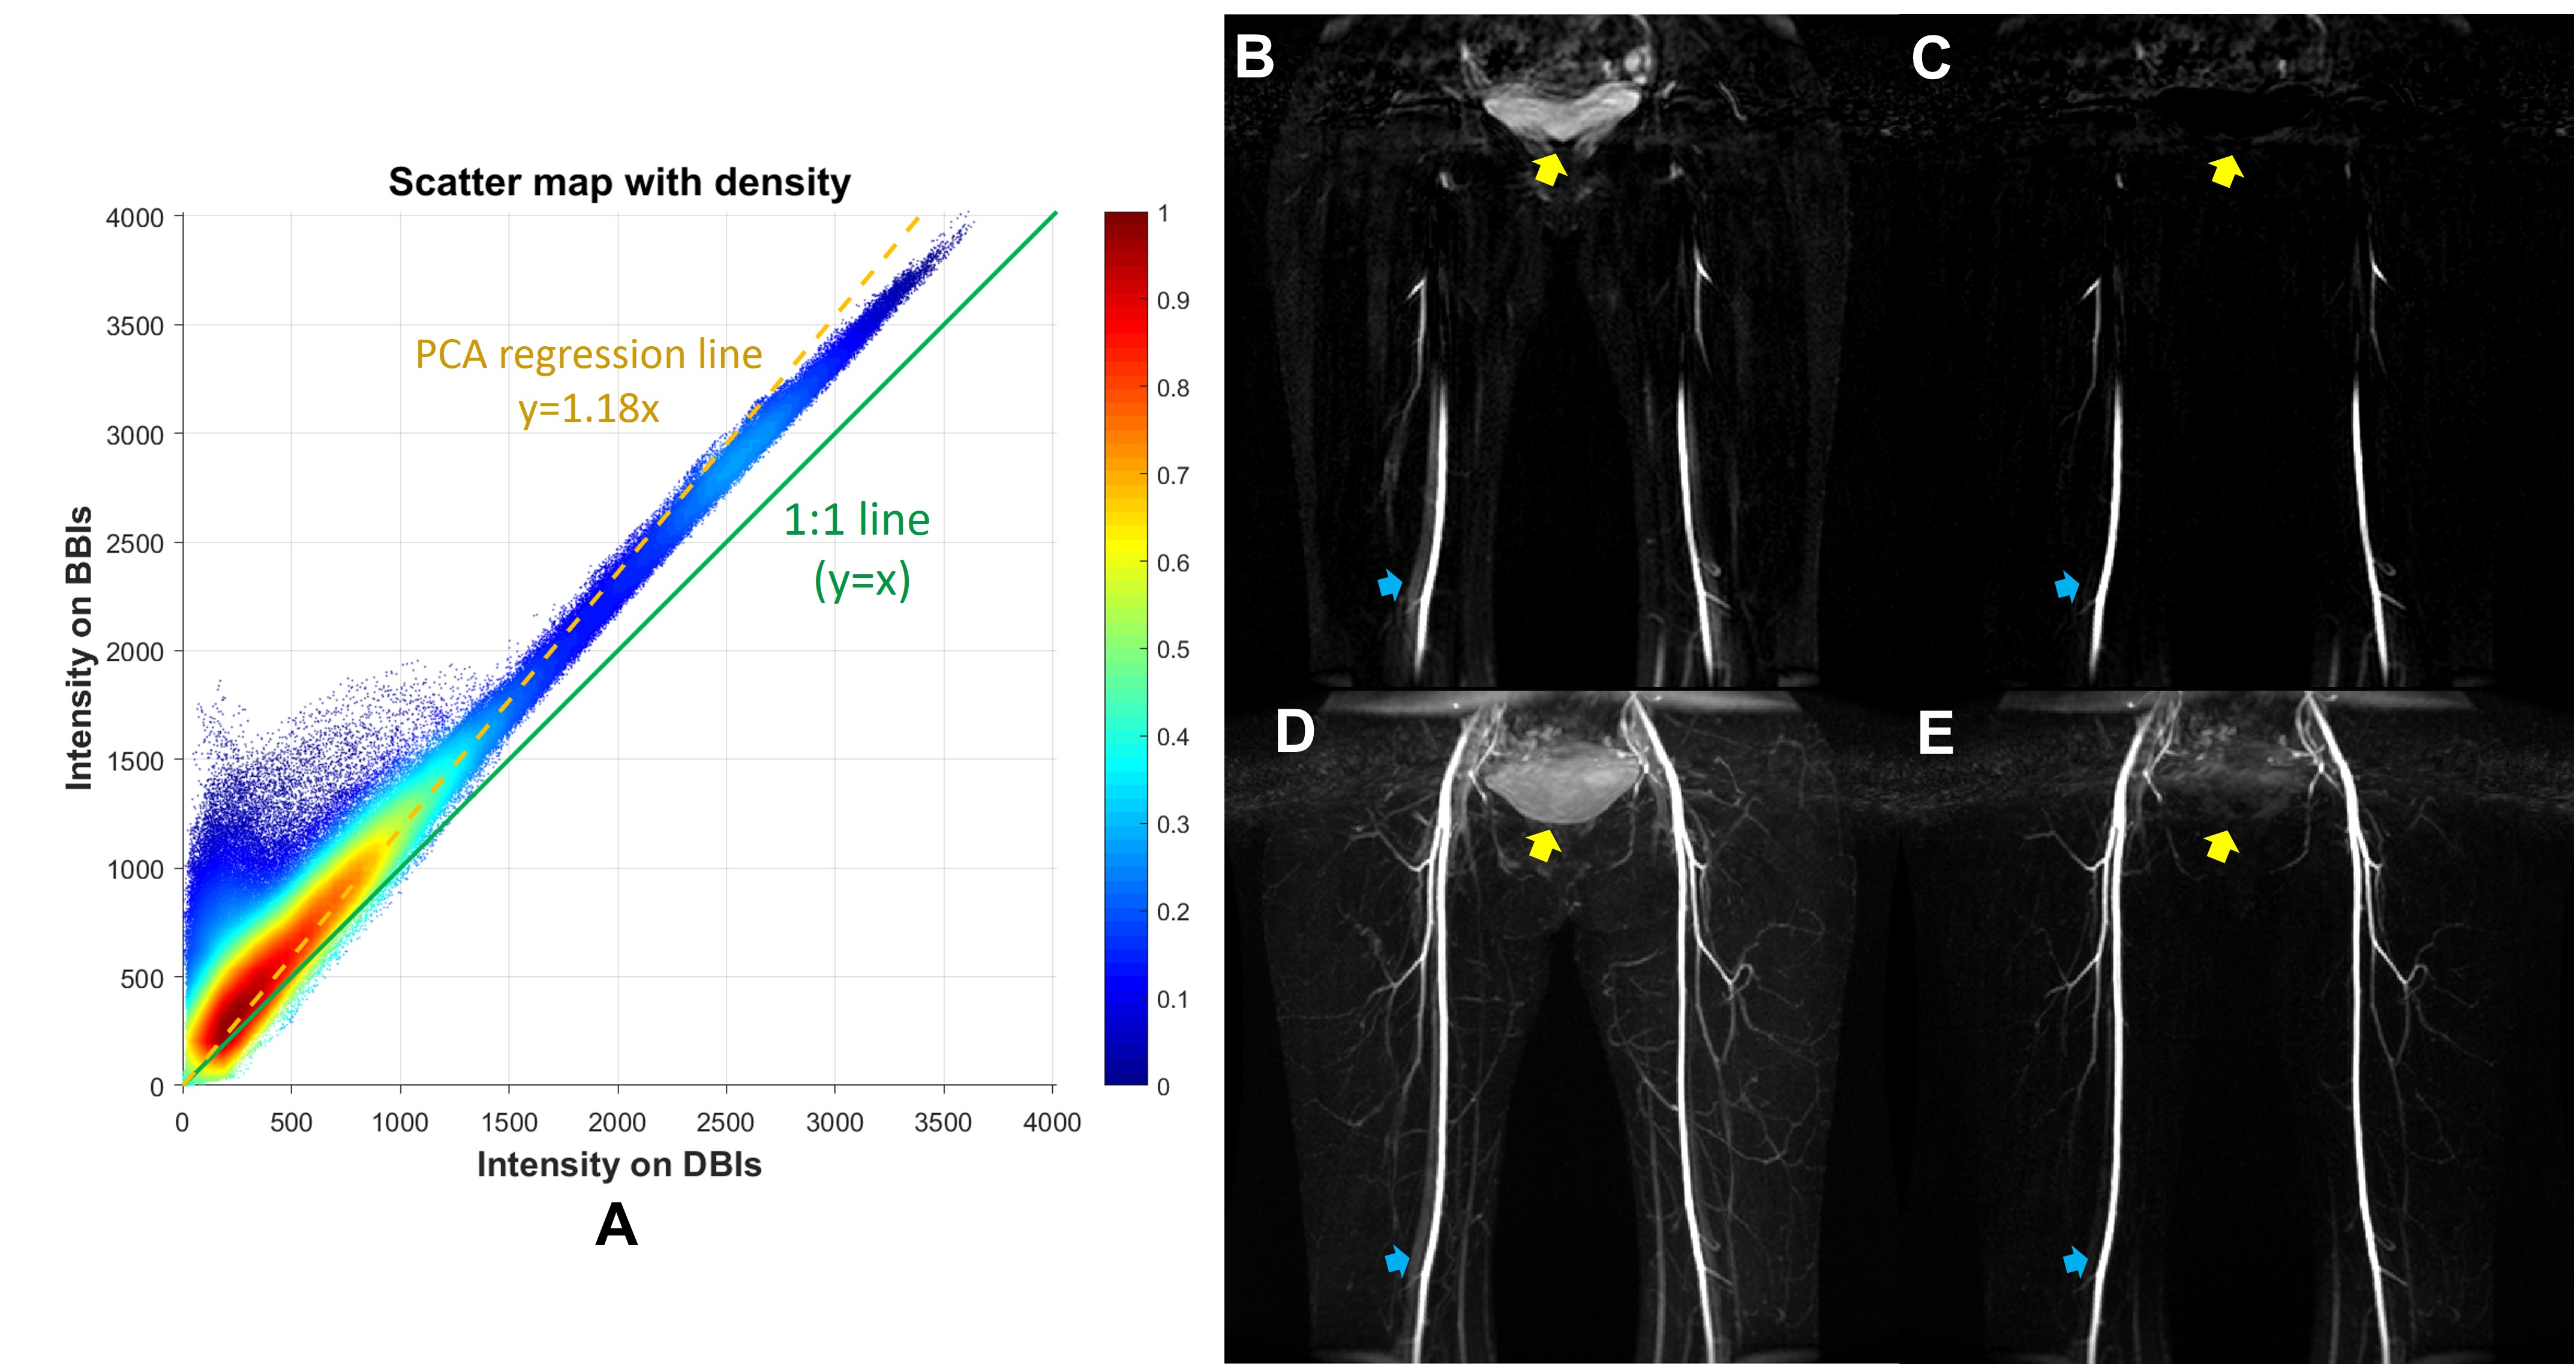
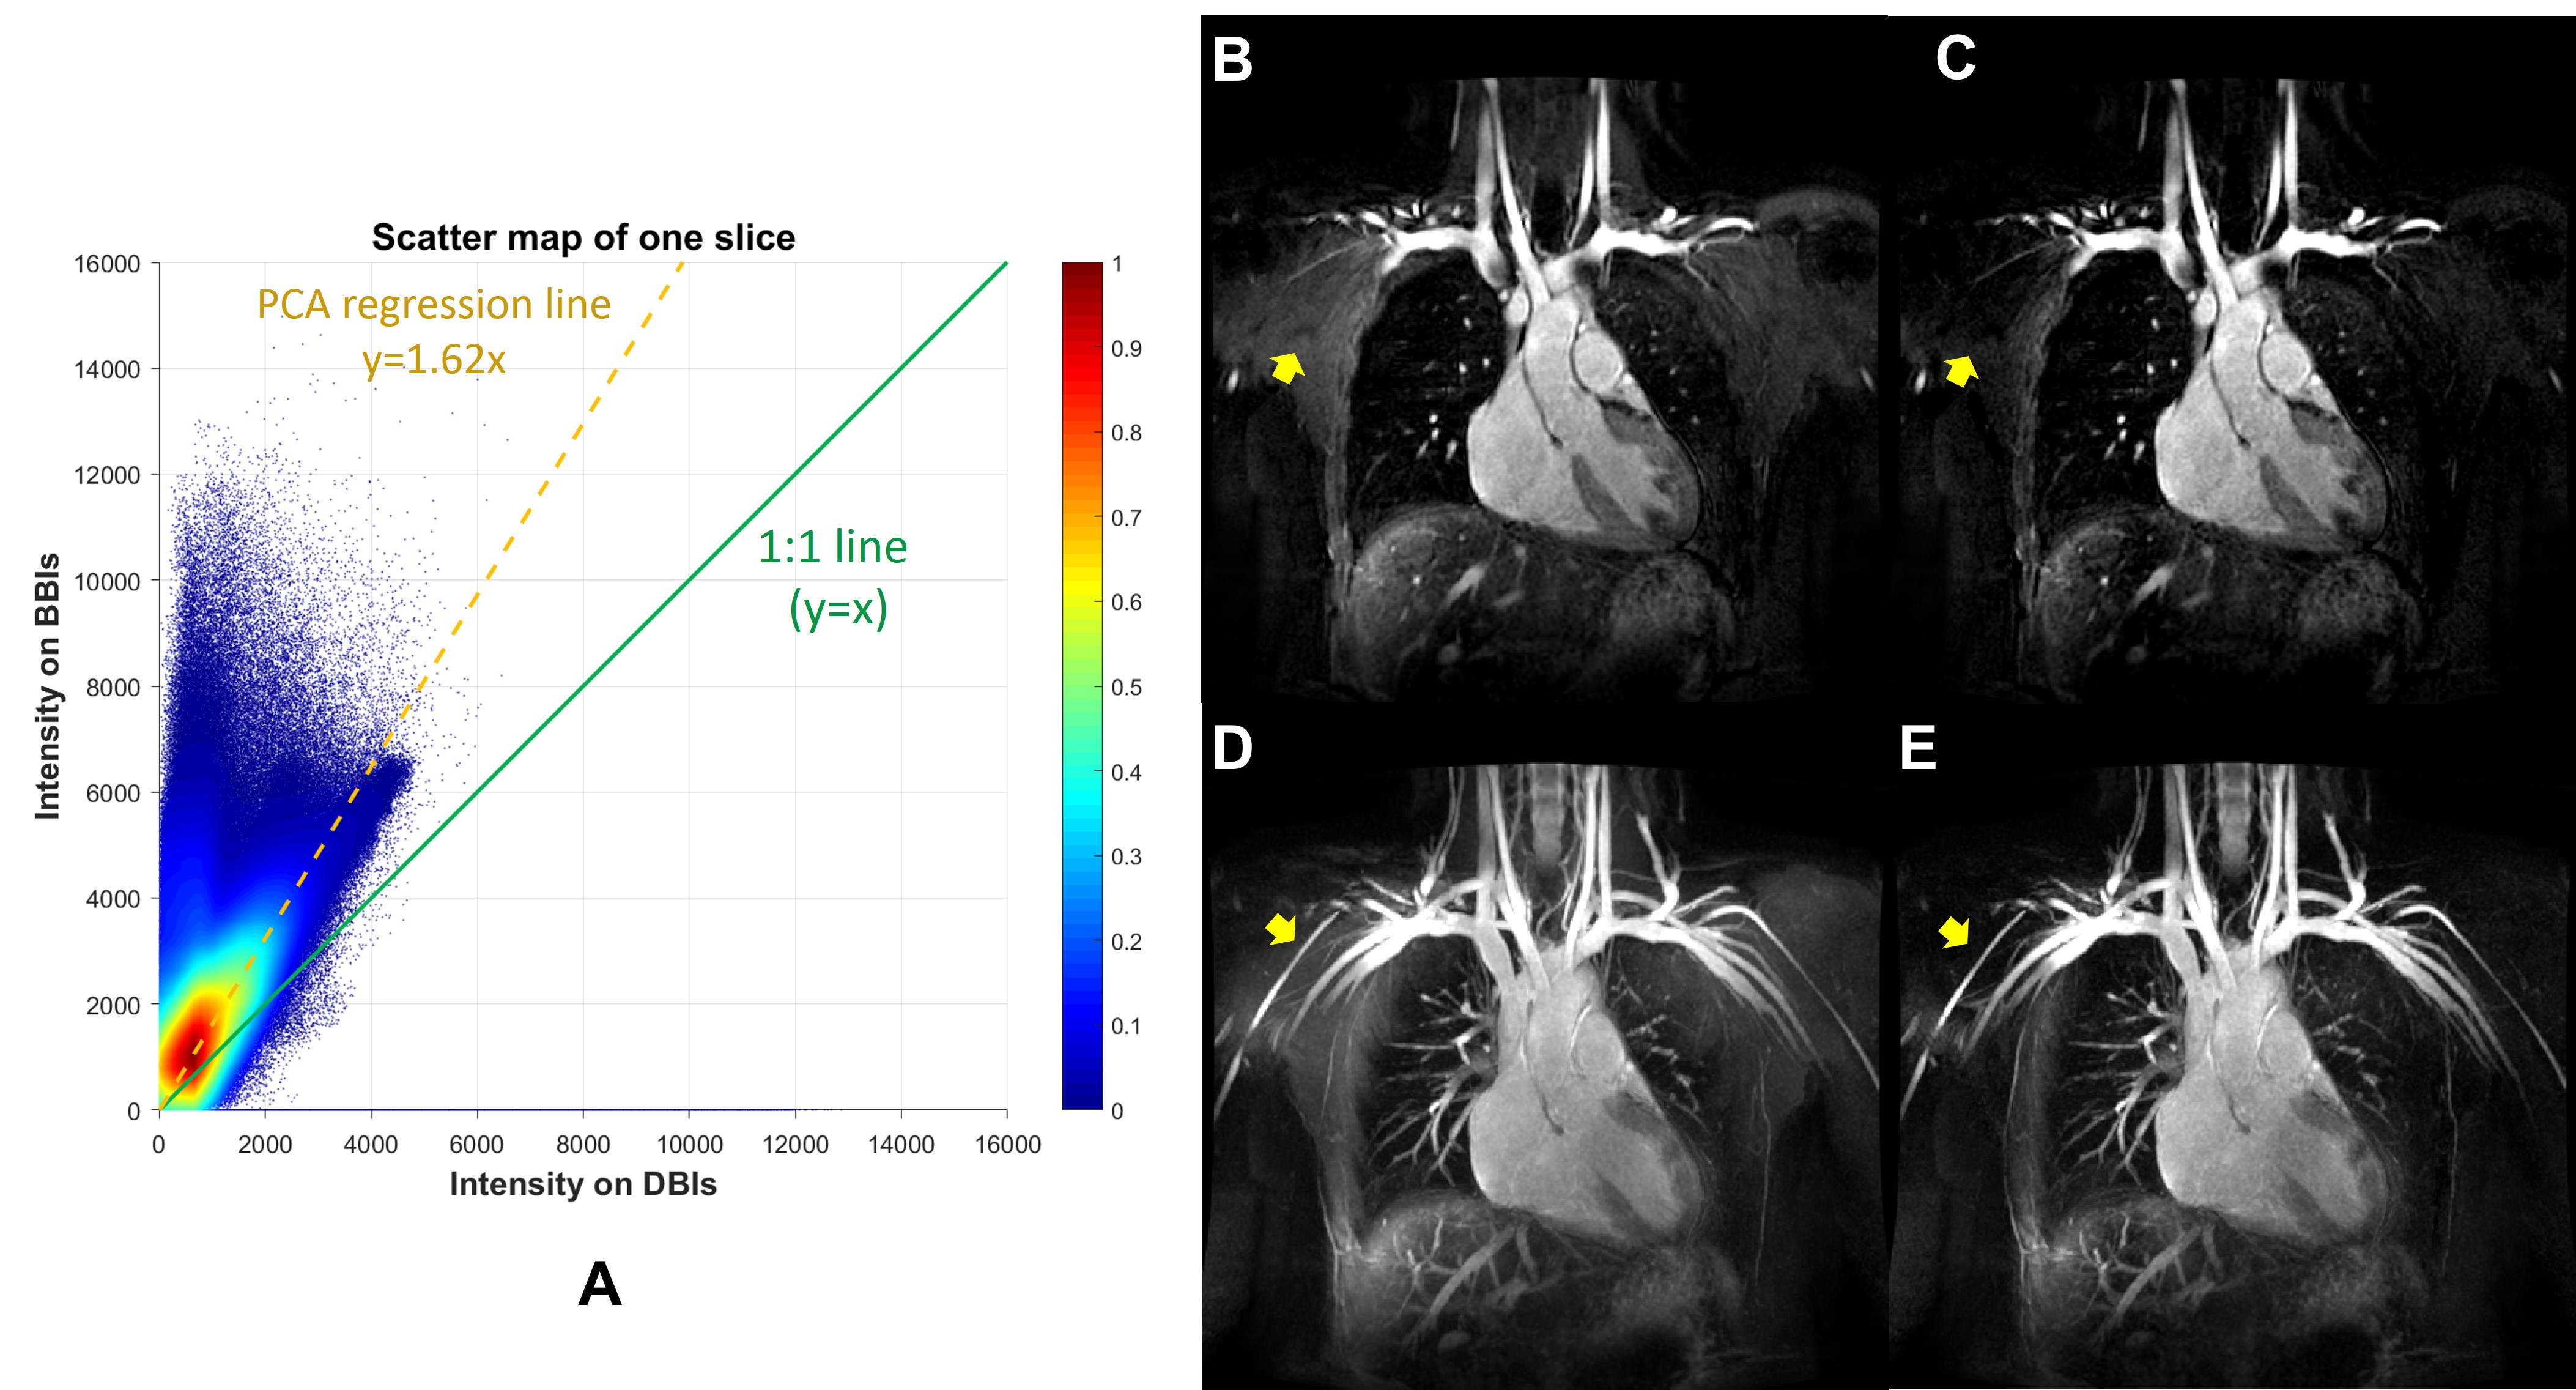
The mean slope of the regression lines in femoral FBI-MRA, iliac FSD-MRV and thoracic FSD-MRA are 1.19±0.09, 1.37±0.20 and 1.49±0.23 respectively, indicating that the intensity difference in BBIs and DBIs commonly exists in subtractive NCE-MRA techniques. Fig. 2 shows an example of femoral FBI-MRA. A is the scatter map with normalised density. It can be observed from B-E that the residual signal of veins (blue arrows) and other background tissue such as the bladder (yellow arrows) shown in the direct subtracted images (B and D) is suppressed more thoroughly in the angiogram obtained by the optimised approach (C and E). Similar results can be found in an example of thoracic FSD-MRA shown in Fig. 3. The quantitative analysis results in Fig. 4 show that the optimised approach achieved significant improvement of background signal suppression in all the evaluated cases (P<0.05).Conclusion
The optimised subtraction approach can correct the intensity difference between background tissues in BBIs and DBIs and thus improve the background suppression. The method has potential to replace the direct subtraction operation in subtractive NCE-MRA/MRV techniques such as FSD and FBI.Acknowledgements
No acknowledgement found.References
1. Priest AN, Graves MJ, Lomas DJ: Non-contrast-enhanced vascular magnetic resonance imaging using flow-dependent preparation with subtraction. Magn Reson Med 2012; 67:628–637.
2. Miyazaki M, Sugiura S, Tateishi F, Wada H, Kassai Y, Abe H: Non-contrast-enhanced MR angiography using 3D ECG-synchronized half-Fourier fast spin echo. J Magn Reson Imaging 2000; 12:776–783.
Figures