0916
Iterative Reconstruction for Dynamic Contrast-Enhanced MR Angiography of the Thoracic Aorta: Quantitative Assessment of SI Parameters and Impact on Quantitative Vessel CharacteristicsLuigia D'Errico1, Jens Wetzl2, Michaela Schmidt2, Aurelien F. Stalder2, Christoph Forman2, and Bernd J. Wintersperger1
1Department of Medical Imaging, University of Toronto, Toronto, ON, Canada, 2Siemens Healthcare, Erlangen, Germany
Synopsis
Iterative reconstruction methods can improve vessel depiction in thoracic contrast-enhanced MR angiography, particularly in small vasculature. This improvement can be ascribed to the reduced temporal footprint for iterative reconstruction compared to view sharing for standard reconstruction. An investigation of the effects of this new reconstruction on quantitative vessel characteristics found no bias in vessel diameter measurements compared to the reference.
Introduction:
Dynamic contrast-enhanced MR angiography (CE-MRA) allows for assessment of vascular dynamics and tissue perfusion. However, common techniques for dynamic CE-MRA such as TWIST1 or TRICKS2 employ view sharing to increase temporal resolution, but with a temporal footprint that is considerably longer than the temporal resolution. This may introduce temporal blurring, particularly in small vasculature. Recent iterative reconstruction techniques3 have enabled improved temporal footprints in dynamic MRA, demonstrating improved signal characteristics and visual image quality. However, changes in signal characteristics may affect quantitative parameters such as vessel diameter measurements. This study aims to assess the impact of iterative reconstruction in dynamic CE-MRA of the thorax with respect to signal and quantitative vessel characteristics.Methods:
34 patients referred for cardiovascular MR with known/suspicion of thoracic aortic abnormalities were prospectively enrolled. Examinations were performed at 3T (MAGNETOM Skyrafit, Siemens Healthcare, Erlangen, Germany) employing a standard parasagittal dynamic MRA (TWIST; R=4x2 GRAPPA) with injection of 2mL Gadobutrol diluted with 6mL NaCl (3mL/s). The 3D slab covered 105.6mm with a 1.2x1.0x1.2mm3 voxel size. TWIST sampling included a central k-space region (A=15%) and differently sampled peripheral k-space regions (B=20%, B1-B5) with an acquisition time of 1.2s per individual k-space part (A/B1-B5). In addition to standard product TWIST reconstruction, a prototype iterative reconstruction (IT-TWIST) was employed on identical k-space raw data sets for reconstructions on the scanner. Detailed reconstruction parameters including the regularization were based on previous empirical testing3. Signal intensity (SI) analysis in matching ROIs of both reconstructions at various aortic levels (ascending, isthmus, hiatus) and within the pulmonary artery (PA) tree (large/mid/small vessels) was performed using ImageJ4. Automated centerline segmentation of the proximal descending aorta with identical centerlines for TWIST and IT-TWIST data was performed using a dedicated tool5 (Figure 1). Subsequently, quantitative assessment of the aortic diameter was performed on time frames with maximal signal intensity at 3 predefined levels with 1cm intervals starting distally to the last aortic arch branch. Wall sharpness was defined as the inverse of the distance of the 20% to 80% points between minimum background SI and maximum vessel SI averaged over 10 profile lines perpendicular to the centerline segmentation6 and the vessel diameter was found by averaging the full width at half maximum (FWHM) values of these profile lines (Figure 1). Statistical comparisons were performed using a Wilcoxon rank-sum test and ANOVA.Results:
IT-TWIST data sets consistently demonstrated significantly higher SI compared to TWIST at all evaluated vascular levels and territories (Figure 2, 3). Differences were most pronounced in mid- to small-sized pulmonary vessels. Along the pulmonary artery tree, the signal ratio from large to small branches increased with IT-TWIST from 0.24 [0.17, 0.39] to 0.67 [0.57, 0.77] (P<0.0001), while the ratio of large pulmonary artery signal to ascending aortic signal did not change (1.00 [0.90, 1.20] vs. 0.96 [0.90, 1.08]; P=ns). The respective average vessel wall sharpness demonstrated only minimal differences with 0.126mm-1 for TWIST and 0.119mm-1 for IT-TWIST reconstructions (Figure 4). The vessel diameters for TWIST and IT-TWIST data (1cm: 22.35 [20.28, 26.41]mm vs. 22.30 [20.41, 26.61]mm; 2cm: 23.52 [21.92, 27.18]mm vs. 22.76 [22.13, 27.54]mm; 3cm: 23.77 [21.07, 26.71]mm vs. 23.84 [22.17, 27.10]mm) only showed differences in the range of 0.24-0.43mm, well below the image resolution, and can thus be considered equivalent.Discussion:
The results of this study demonstrate that the application of iterative reconstruction in dynamic CE-MRA benefits respective signal parameters. Signal characteristic improvements are most prominent in mid- to small vessels (Figure 5). Respiratory motion and fast contrast agent transit times are two possible explanations why blurring can occur for longer temporal footprints, and so explain the improved depiction when the temporal footprint is shortened. Results for vessel sharpness and vessel diameter measurements for both reconstruction techniques were on par with each other. While this evaluation could only be reliably performed in larger vessels due to the poor depiction of smaller vessels in the standard reconstruction, we expect that iterative reconstruction does not induce bias on vessel diameter measurements of smaller vessels either.Conclusion:
The use of iterative reconstruction in dynamic CE-MRA of the thoracic aorta improves the overall image quality in terms of improved signal characteristics in large- and small-sized vessels. It specifically improves the signal characteristics in peripheral small pulmonary vessels making them better visualized and assessable to the eye. Furthermore, quantitative vessel characteristics can be considered identical between both types of reconstruction for clinical aspects.Acknowledgements
JW, MS, AFS and CF are employees of Siemens HealthcareReferences
- Lim RP, Shapiro M, Wang EY et al. 3D time-resolved MR angiography (MRA) of the carotid arteries with time-resolved imaging with stochastic trajectories: comparison with 3D contrast-enhanced Bolus-Chase MRA and 3D time-of-flight MRA. Am J Neuroradiol. 2008;29:1847–54.
- Korosec FR, Frayne R, Grist TM et al. Time-resolved contrast-enhanced 3D MR angiography. Magn Reson Med. 1996;36:345–51.
- Wetzl J, Forman C, Wintersperger BJ et al. High-resolution dynamic CE-MRA of the thorax enabled by iterative TWIST reconstruction. Magn Reson Med. 2017;77(2):833–840.
- Schindelin J, Rueden CT, Hiner MC et al. The ImageJ ecosystem: An open platform for biomedical image analysis. Mol Reprod Dev. 2015;82(7-8):518–529.
- Schwemmer C, Forman C, Wetzl J et al. CoroEval: a multi-platform, multi-modality tool for the evaluation of 3D coronary vessel reconstructions. Phys Med Biol. 2014;59(17):5163-74.
- Li D, Carr J, Shea S et al. Coronary arteries: magnetization-prepared contrast-enhanced 3D volume-targeted breath-hold MR angiography. Radiology 2001;219:270–7.
Figures
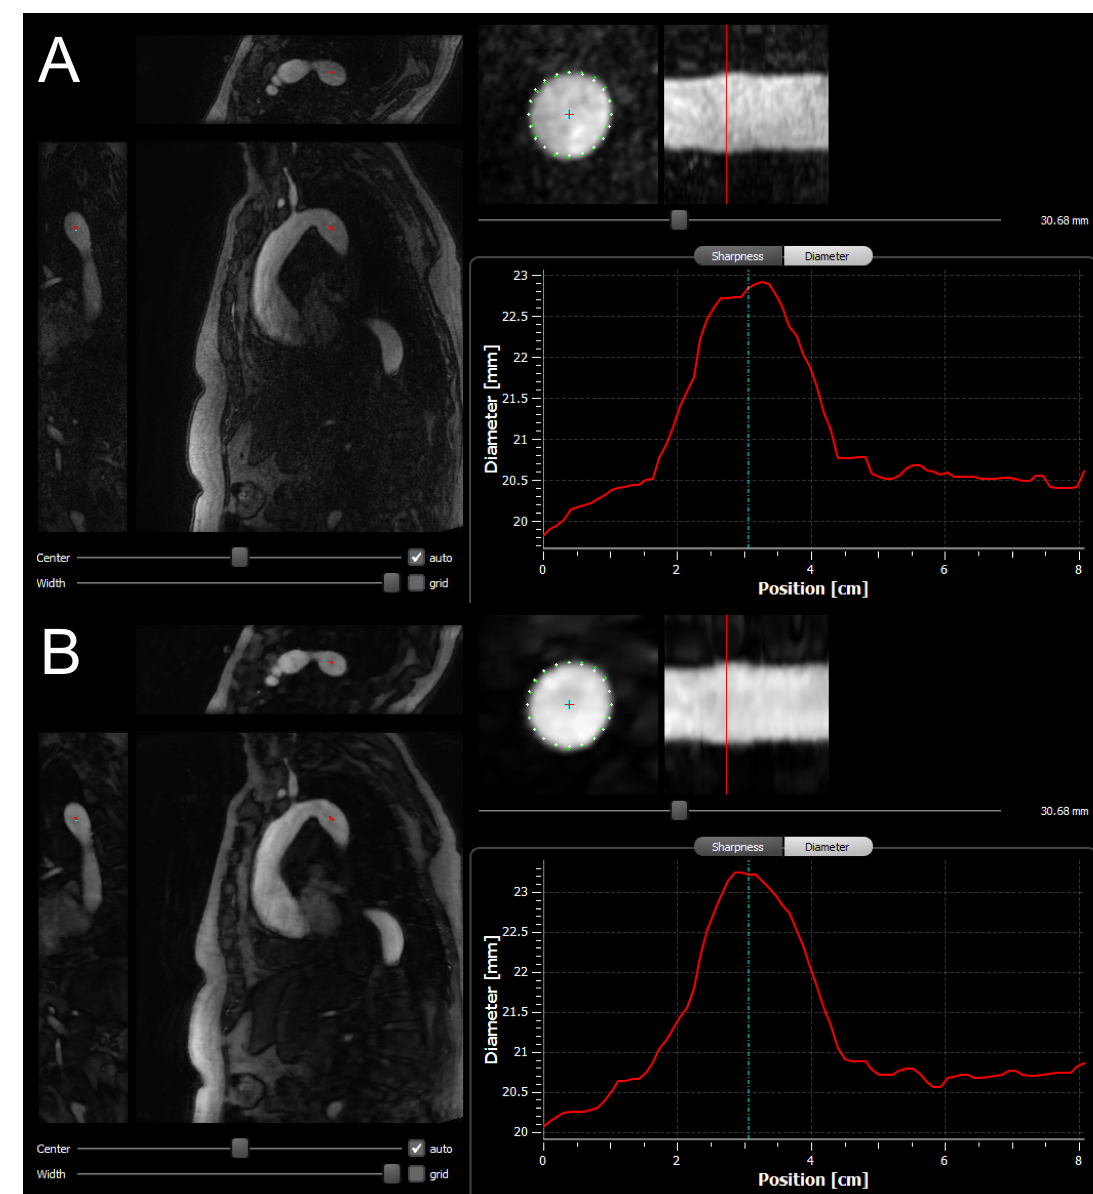
Figure 1: Display
of the used CoroEval tool5 for segmentation of the proximal
descending thoracic aorta. In both, the (A) TWIST and (B) IT-TWIST
reconstruction, a 3-orientation view is shown on the left with the identical perpendicular
vessel recon with segmentation points for vessel sharpness assessment shown in
the center and the resulting centerline of the aorta on the right.
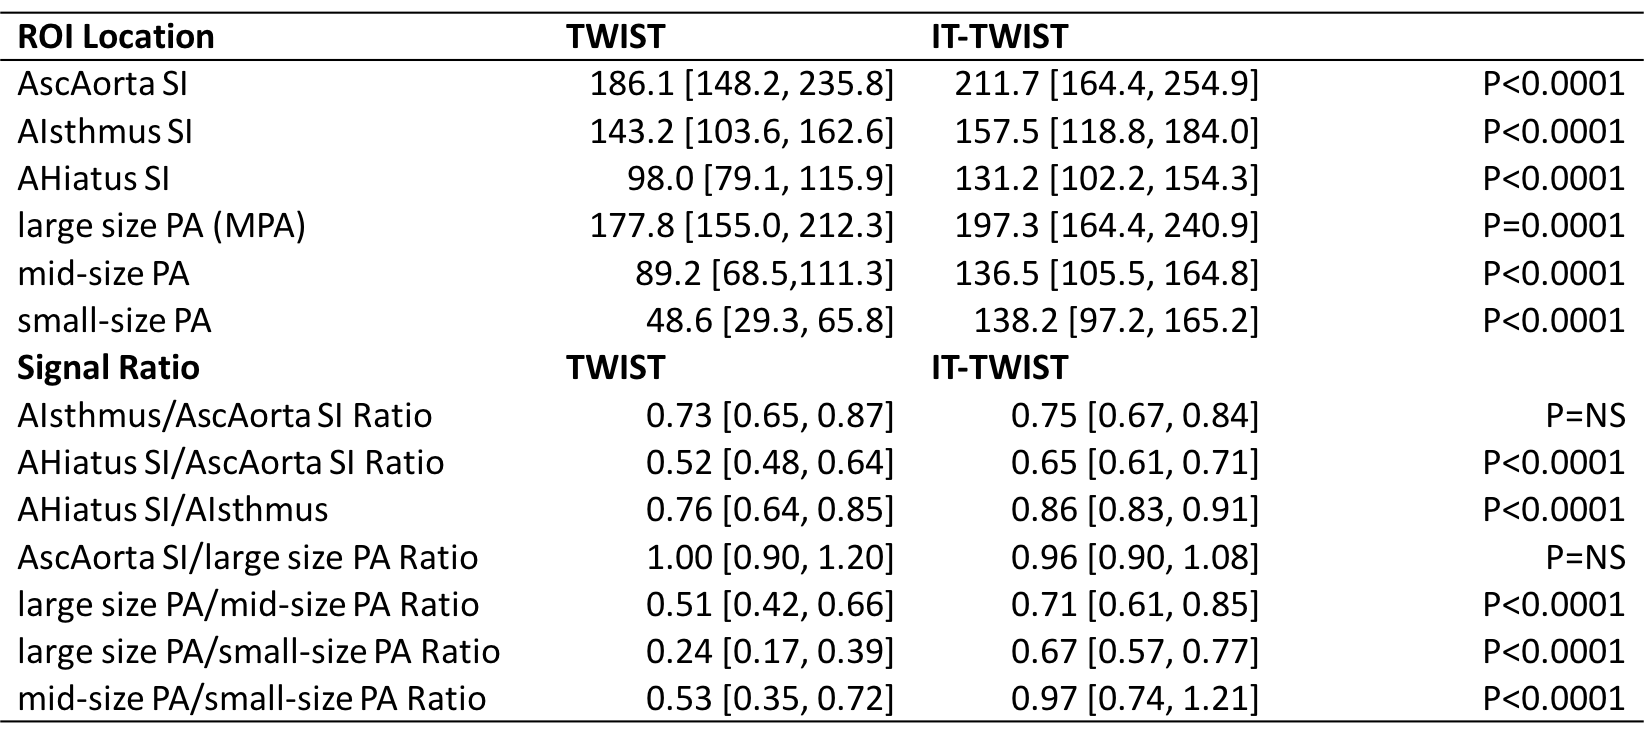
Figure 2: Overview
table of the evaluated signal characteristics (median [IQR]) for TWIST and
IT-TWIST data sets including respective ratios.
ROI=region
of interest, SI=signal intensity [a.u.], AscAorta=ascending aorta,
AIsthmus=aortic isthmus, AHiatus=aortic hiatus (diaphragm), PA=pulmonary
artery, MPA=main pulmonary artery
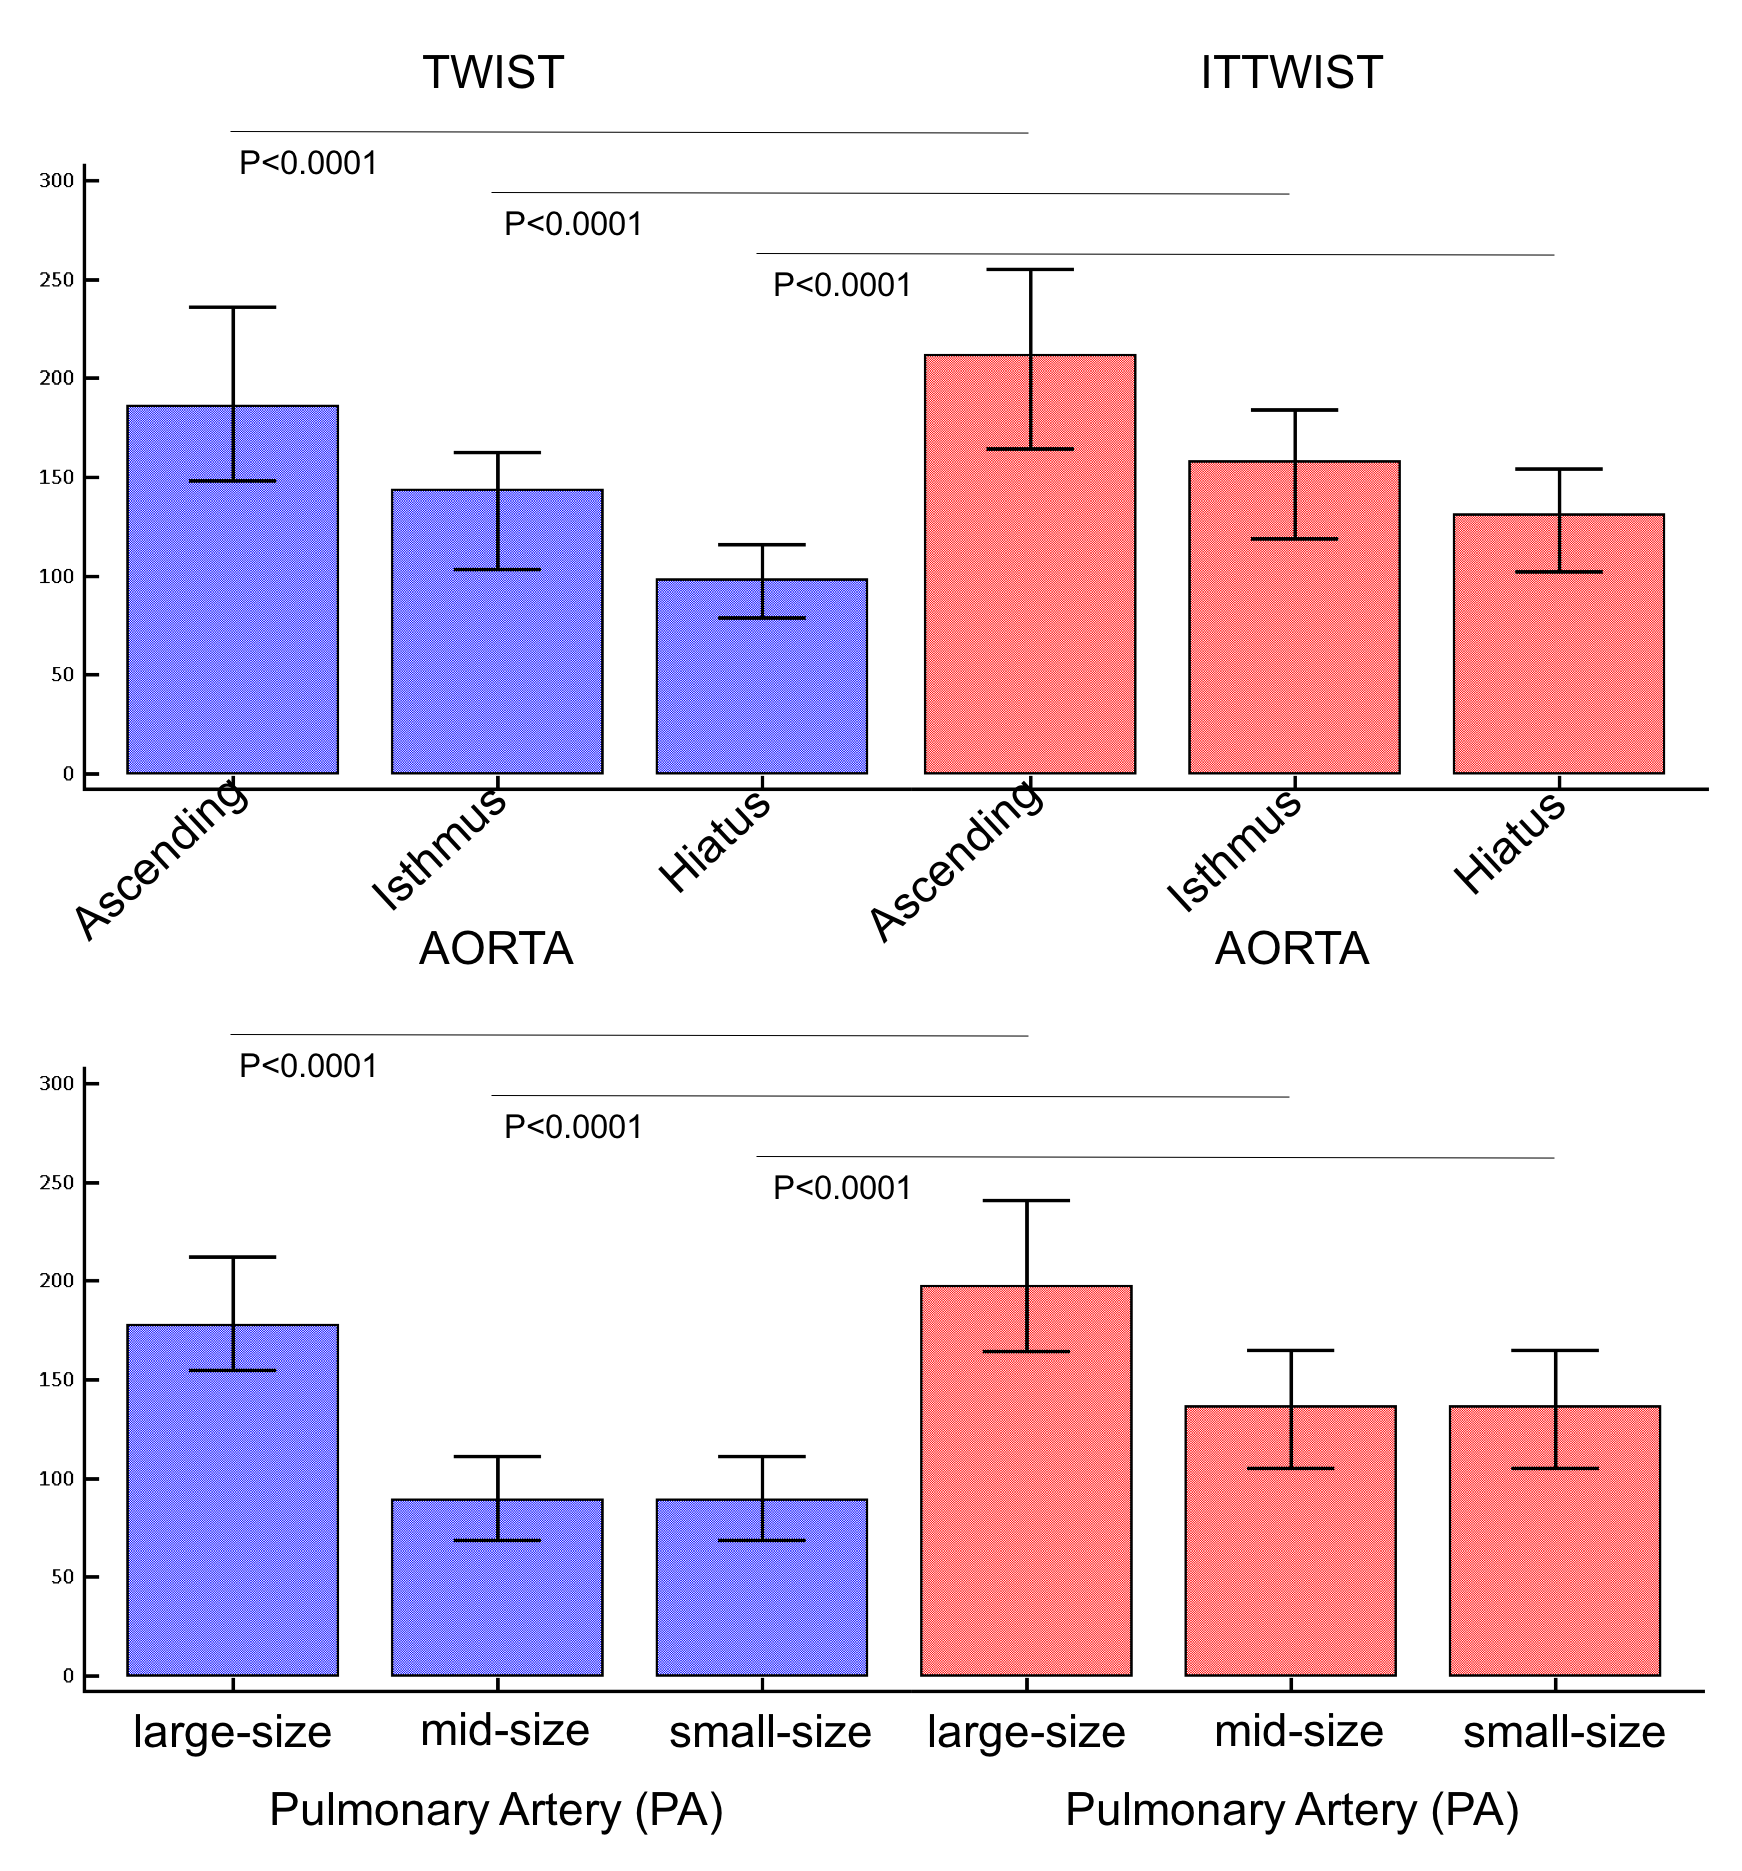
Figure 3: Bar
chart (median [IQR]) of TWIST and IT-TWIST based SI measurement results.
Results for the aortic segments are displayed in the upper row and results for
the different size pulmonary artery vessel segments in the lower row.
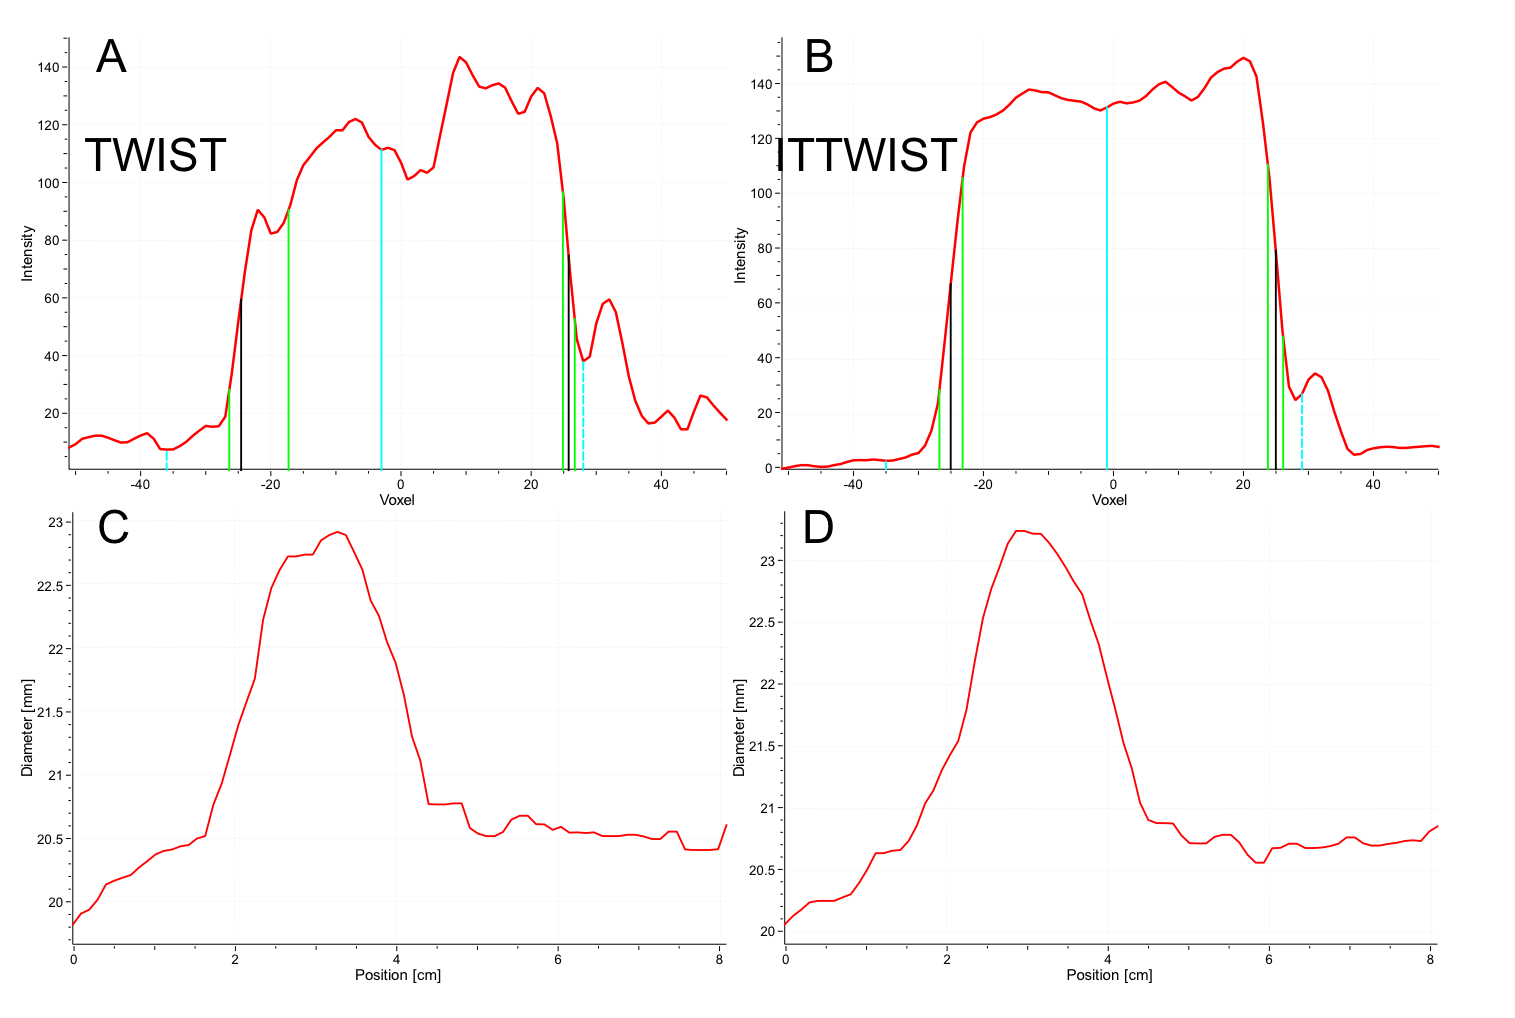
Figure 4: (A,C)
TWIST based and (B,D) IT-TWIST based respective vessel cross-section profiles
(A, B) for vessel sharpness assessment (A,B) and vessel dimensions along the
centerline reconstruction (C,D).
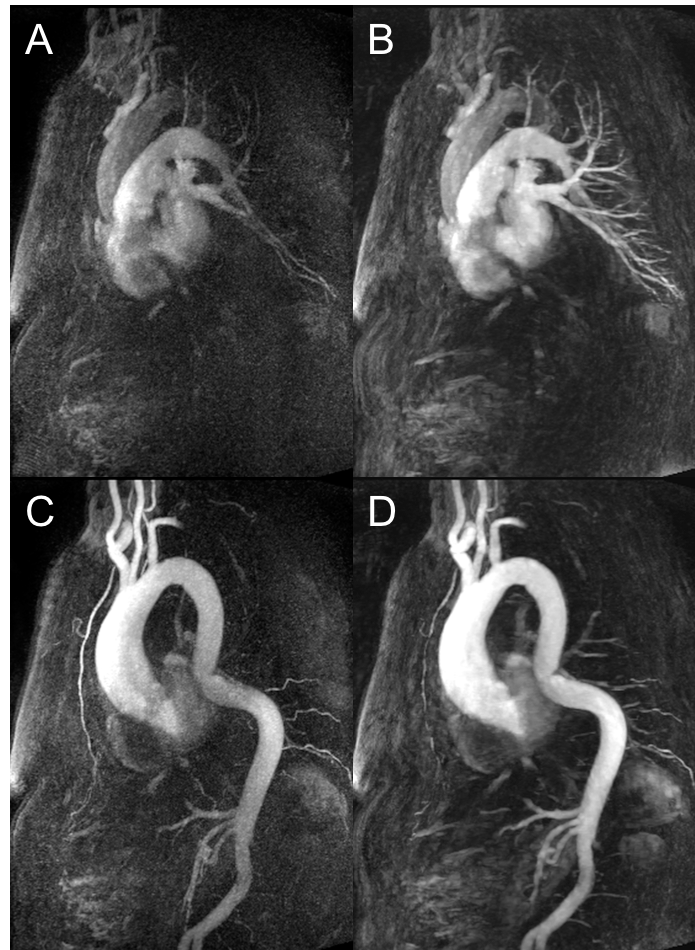
Figure 5: Case
example of ascending aortic dilatation and descending aortic kinking as reconstructed
with (A,C) standard TWIST algorithm and (B,D) IT-TWIST. (A,B) demonstrate the respective
pulmonary artery contrast phases and (C,D) the respective aortic contrast phases.
A clear improvement of the aortic signal as well as the small pulmonary vessel
delineation can be observed.