0910
Mapping of Creatine Kinase Reaction Rate in Rat Hindlimb by 31P Magnetic Resonance Fingerprinting1Biomedical Engineering, Case Western Reserve University, Cleveland, OH, United States, 2Radiology, Case Western Reserve University, Cleveland, OH, United States
Synopsis
Magnetic Resonance Fingerprinting (MRF) allows the quantification of multiple tissue parameters with high efficiency. Previously, we developed an MRF based 31P spectroscopic method for fast and robust measurement of ATP synthesis via creatine kinase (CK). In the current study, we explored the potential of combining the CK-MRF method with fast imaging for metabolic mapping of the CK reaction rate in small laboratory animals. CK-MRF imaging was performed in the hindlimb of four rats. CK rates of different muscle compartments were compared.
Background/Purpose
Creatine kinase (CK) plays an important role in tissue metabolism by maintaining a stable ATP concentration, particularly in the brain and muscles. 31P MRS methods provide the opportunity for noninvasive assessment of the CK reaction rate (kfCK) in vivo. However, imaging of kfCK remains challenging due to the inherently low sensitivity of 31P MRS methods. Previously, we developed a Magnetic Resonance Fingerprinting (MRF) based method, the CK-MRF method, for fast and accurate quantification of kfCK. In this study, we explored the potential of high resolution in vivo mapping of CK metabolism in small laboratory animals using the CK-MRF method.Methods
The CK-MRF imaging sequence is shown in Figure 1. The details of the CK-MRF sequence have been described previously1. Briefly, the sequence comprised of the alternating acquisition of phosphocreatine (PCr) and γATP with varied flip angle. The acquisition blocks were interlaced with γATP saturation for enhanced encoding of magnetization transfer via CK. 2D spatial encoding was achieved by implementing a balanced single-shot spiral readout. Imaging parameters were: FOV, 40x40 mm2; slice thickness, 10 mm; matrix size, 16x16; resolution, 2.5x2.5 mm2. Total acquisition time for one signal average was 20 s. A dictionary was constructed by solving the modified Bloch-McConnell equation. This dictionary included four matching parameters: kfCK, T1 of PCr (T1PCr), PCr-to-ATP ratio (MRPCr), and chemical shift of PCr (ωPCr). Dictionary resolution for kfCK, T1PCr, MRPCr, and ωPCr was 0.005 s-1, 0.1 s, 0.05, and 3 Hz respectively. A total of 549,780 dictionary entries were simulated. The inner product metric was used to select the best dictionary match2. Animal studies were performed on the hindlimb of Sprague-Dawley rats (n=4) at 9.4T using a custom-built 31P saddle coil. Proton reference images were acquired and used to select ROIs corresponding to the anterior, deep, and posterior muscle compartments of the leg. CK-MRF acquisition comprised of a total of 480 signal averages (160 min acquisition). CK reaction rates between muscle compartments were compared.Results
Figure 2 shows a representative fingerprint from a pixel with its corresponding dictionary match. Interpolated CK-MRF maps from one animal superimposed on proton reference image are shown in Figure 3. Results of ROI analysis are summarized in Table 1. Significant differences were found in CK rate constants between the anterior vs the deep, as well as the posterior vs the deep muscle compartments (p<0.05). PCr-to-ATP ratio also differed between the deep and the posterior muscle compartments (p< 0.05). These results correlate with the percent predominance of glycolytic vs oxidative muscle type described in literature3.Discussion/Conclusion
Localized CK-MRF shows promising potential to perform localized CK metabolism mapping. Due to the small size of the rat anatomy, high spatial resolution (62.5 μL voxel volume) was necessary in the current study. This resulted in the relatively long acquisition time (160 min) used. The current method was able to detect differences in CK metabolism between different muscle compartments. While these differences may have a physiological basis, further evaluation is required.Acknowledgements
This work made use of the High Performance Computing Resource in the Core Facility for Advanced Research Computing at Case Western Reserve University. The authors would like to acknowledge funding from NIH TL1-TR000441, T32-EB007509, F30-HL124894, R01-EB023704, R21-HL126215.
References
1. Wang, CY. et al., NMR Biomed. 2017;(July):e3786.
2. Ma, D. et al., Nature 2013;495:187–92.
3. Xiong, Q. et al., Circulation Research 2011;108:653–663.
4. Armstrong, RB. et al., Am J Anat. 1984;171(3):259-272.
Figures
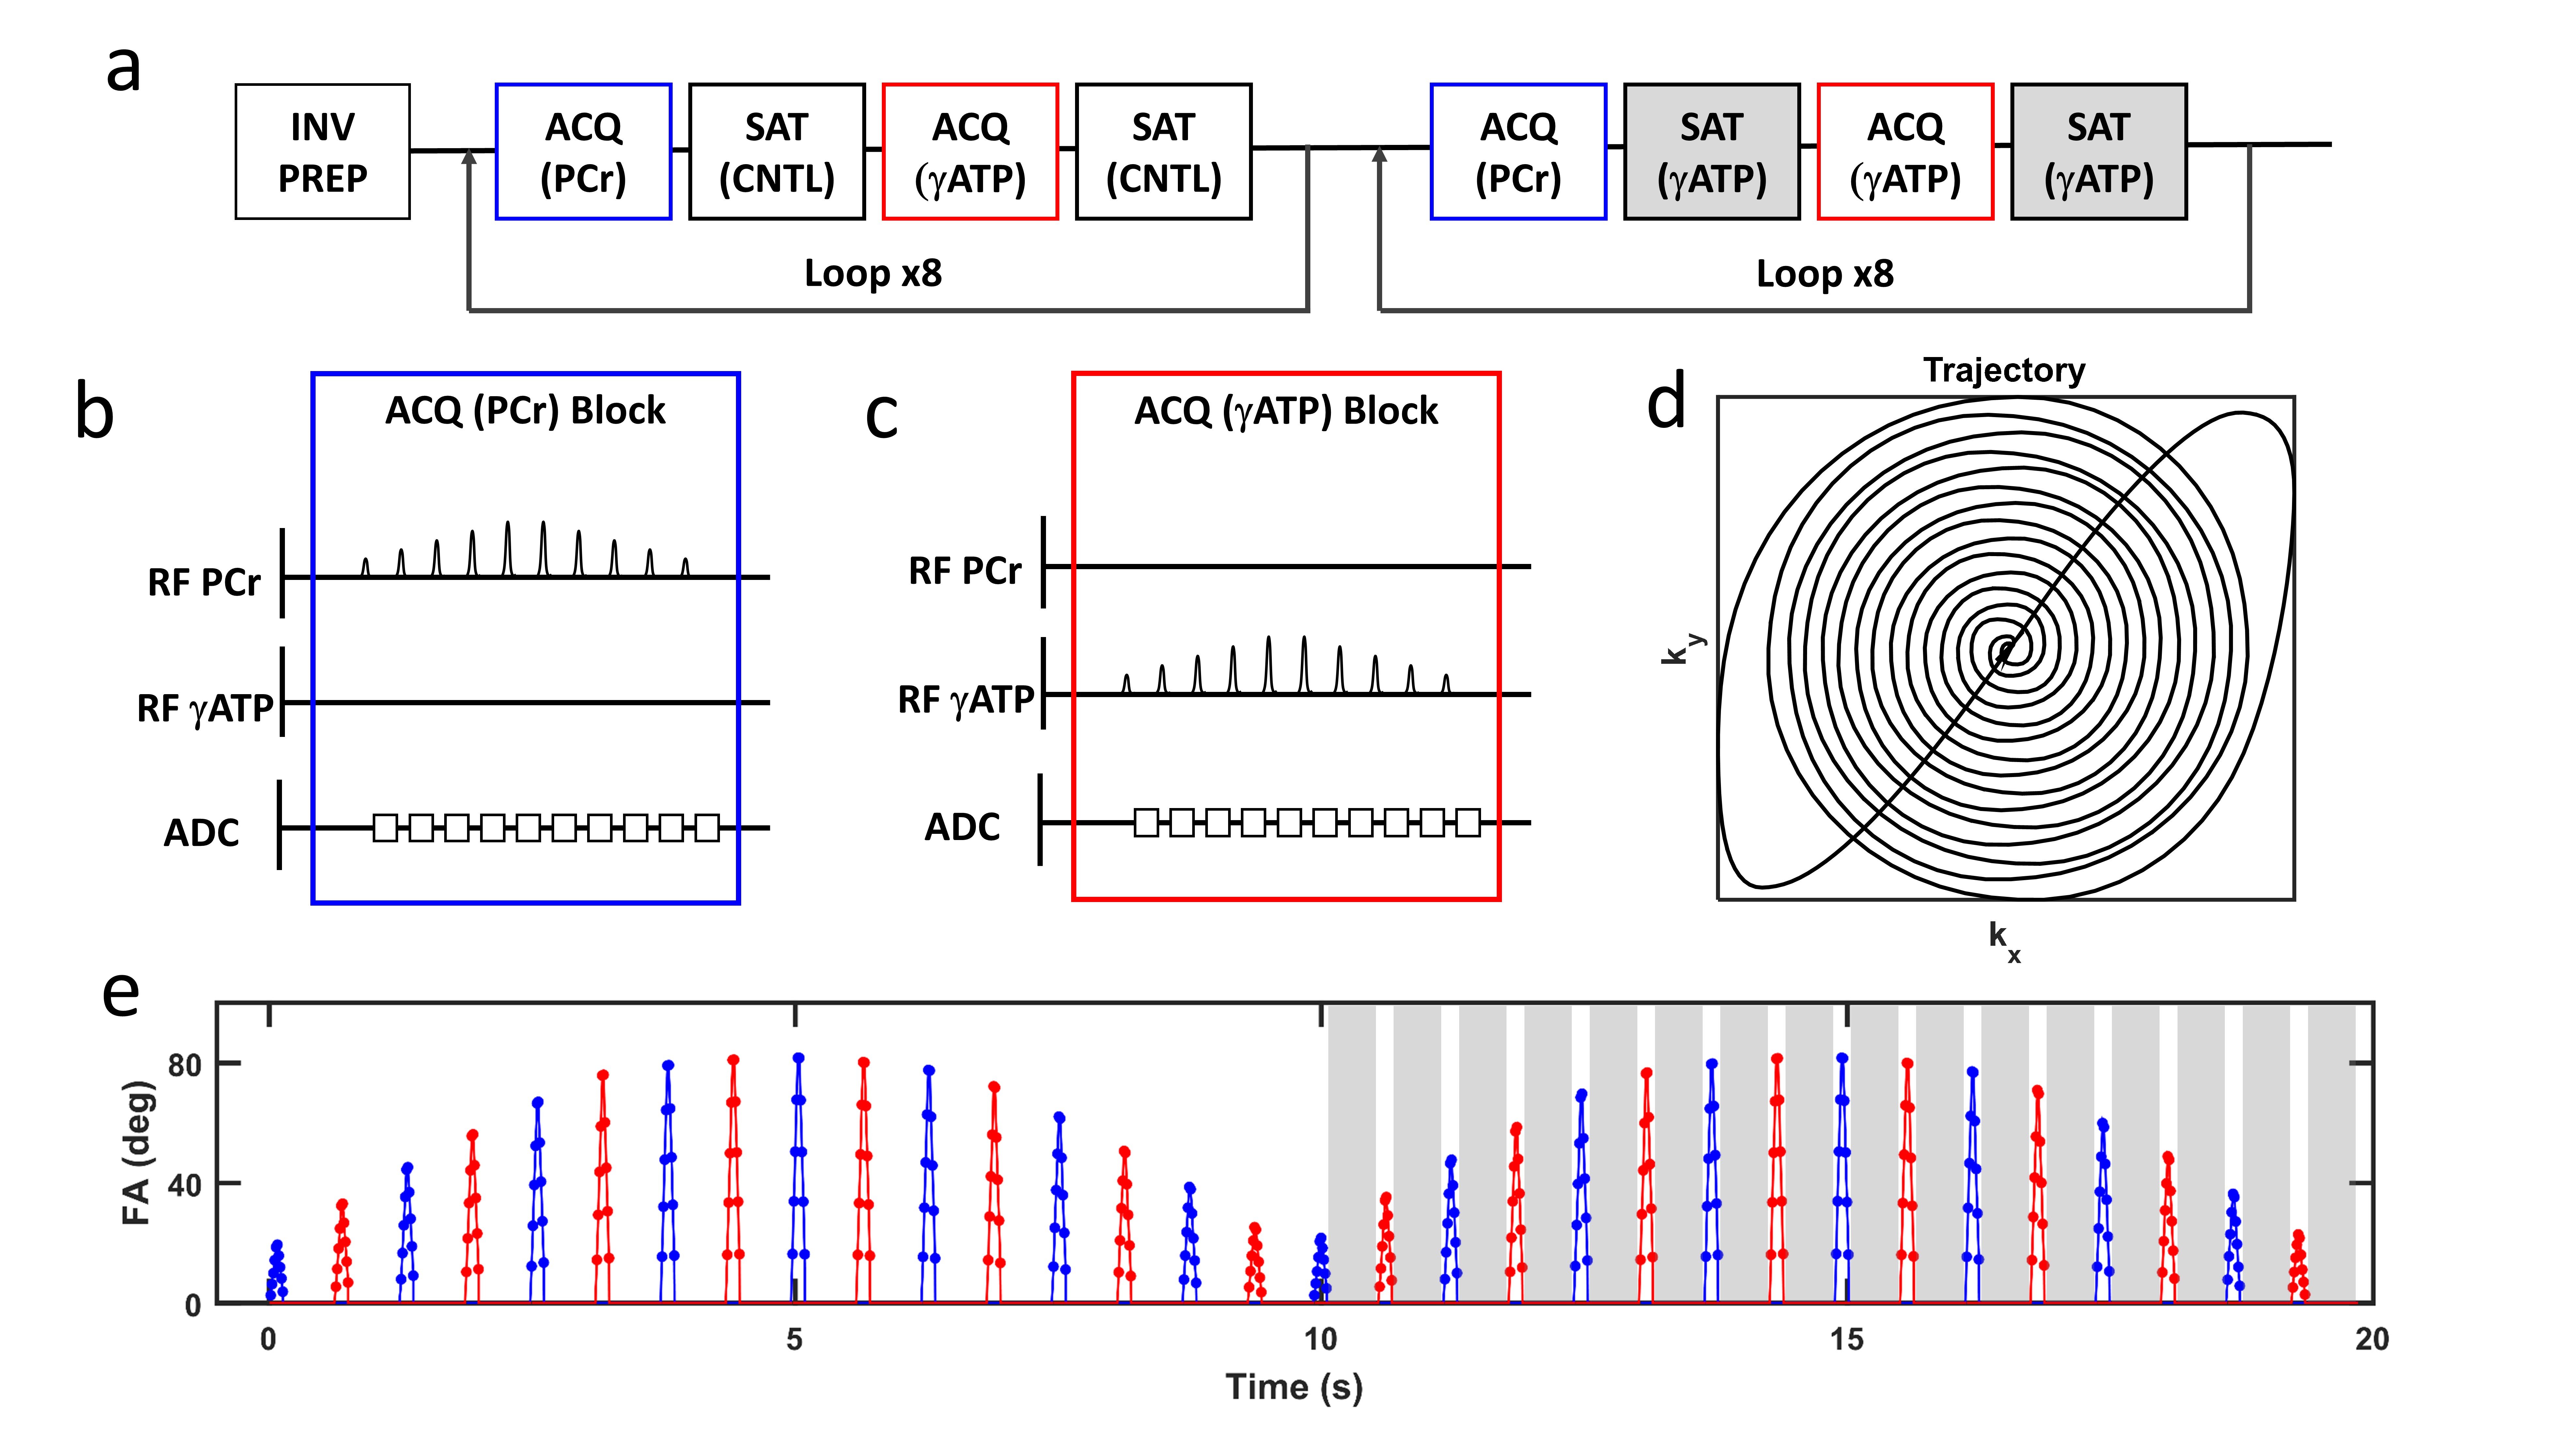
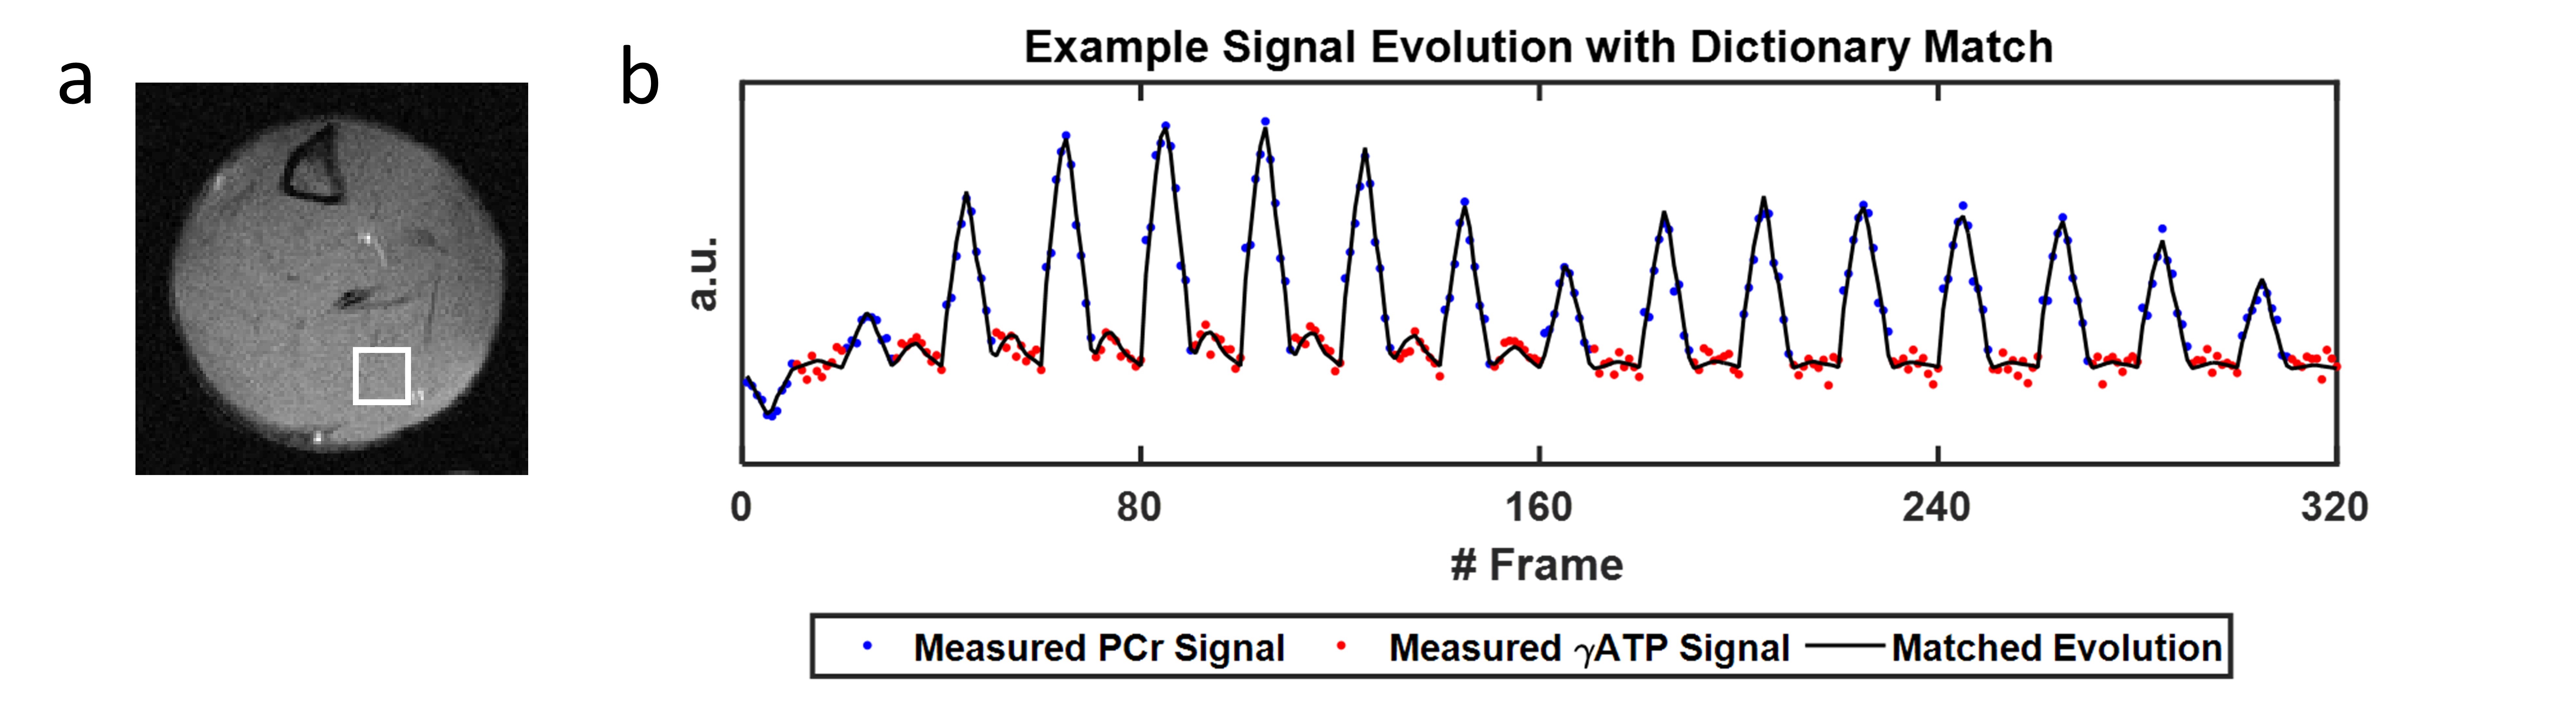
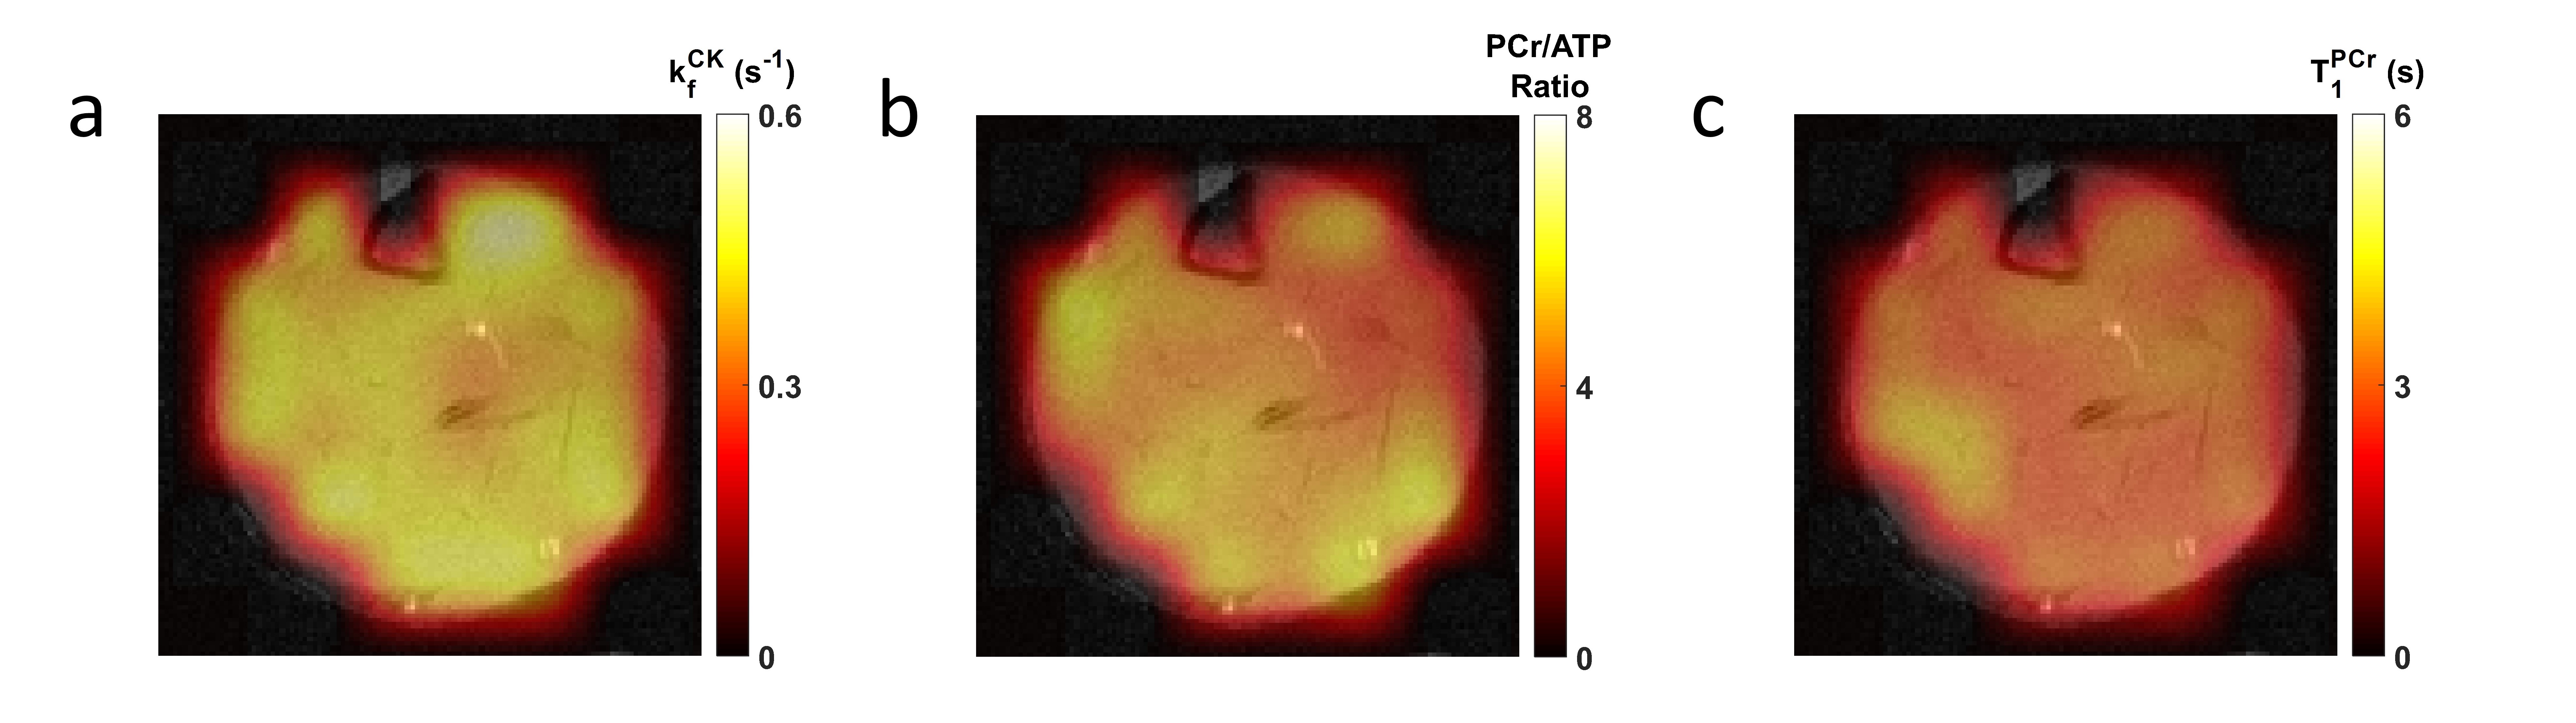
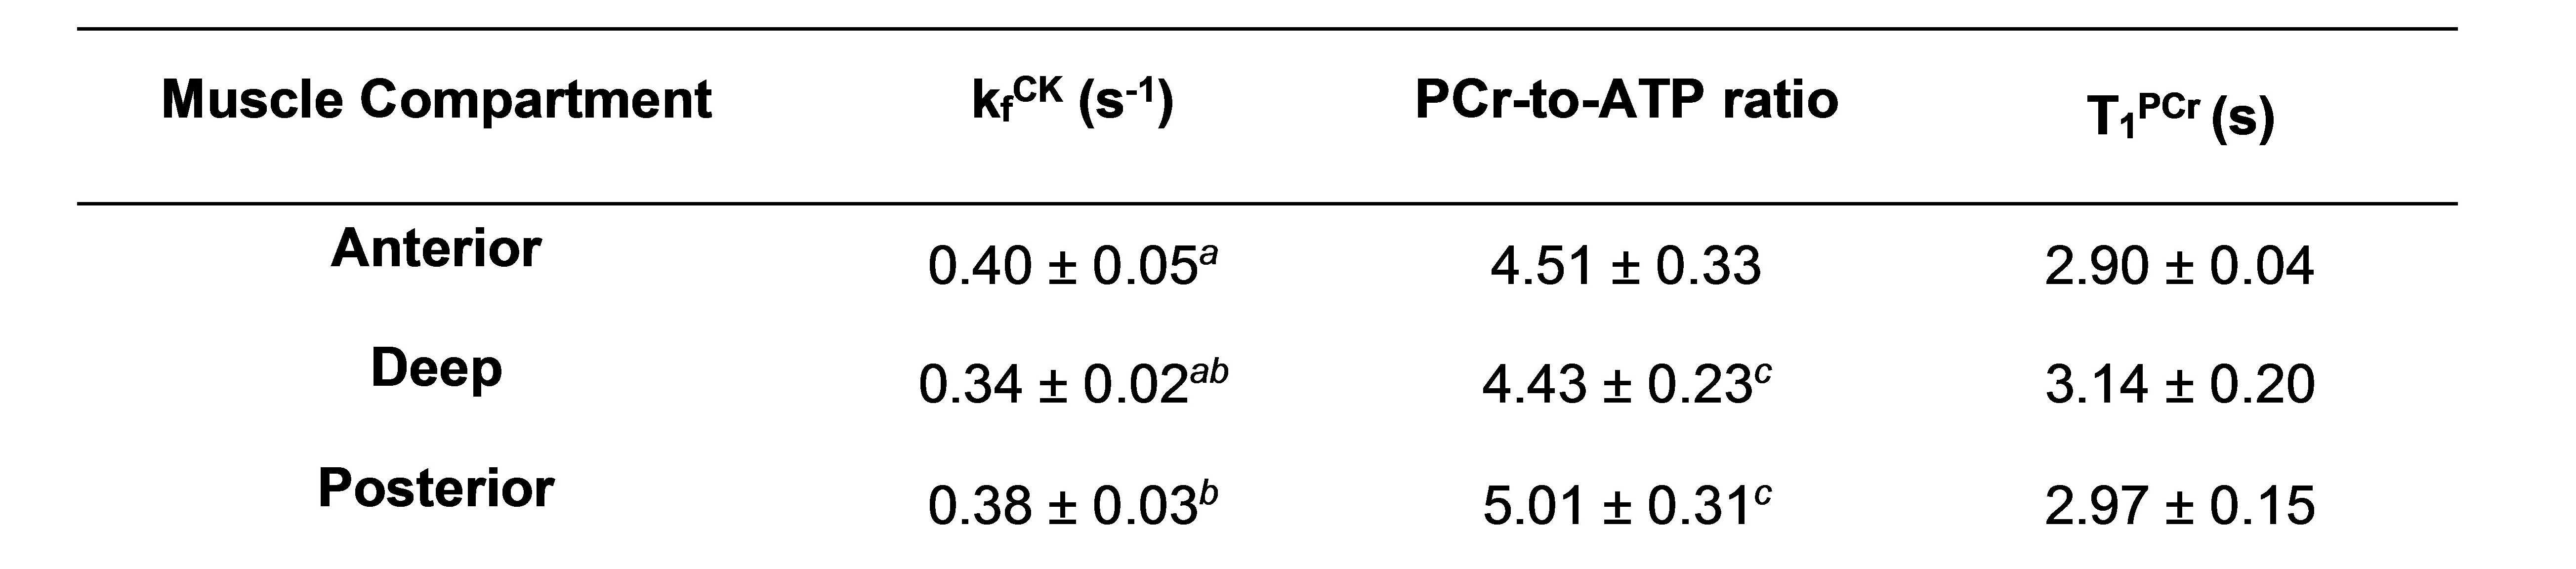
Table 1. Summary of the measurements of kfCK, PCr-to-ATP ratio, and T1PCr obtained from different muscle compartments.
a,b,c denote a significant difference observed between compartments (p<0.05)