0908
Compressed Sensing Improves Detection of Fluorine-19 Nanoparticles in a Mouse Model of Neuroinflammation1Berlin Ultrahigh Field Facility (B.U.F.F.), Max Delbrueck Center for Molecular Medicine in the Helmholtz Association, Berlin, Germany, 2Experimental and Clinical Research Center (ECRC), Charité Campus Buch, Berlin, Germany
Synopsis
Low sensitivity remains a major challenge on the way to utilizing the full potential of 19F-MRI, despite its unique detection specificity for imaging inflammation. Compressed sensing allows the reconstruction of high quality images from severely undersampled data by relying on prior statistical knowledge. We show that investing the gained acquisition speed into increased averaging improves the detection of 19F-nanoparticles in an EAE mouse model. Thus compressed sensing helps to improve the sensitivity of 19F-MRI. This paves the way to enhanced spatial and temporal resolution for future in vivo studies.
Introduction
Low sensitivity remains a major challenge on the way to utilizing the full potential of 19F-MRI, despite its unique detection specificity for imaging inflammation. Compressed sensing (CS) allows the reconstruction of high quality images from severely undersampled data by relying on prior statistical knowledge1. In case of 19F-MRI this prior knowledge is straightforward: the image will mainly consist of background with only a few voxels containing 19F signal.
Zhong et al.2 demonstrated that the application of CS to 19F-MRI yields reliable results. If the gained acquisition speed is invested into increased averaging, CS could enhance sensitivity. Recognizing this gain and opportunity we examined the applicability of CS for the monitoring of neuroinflammation in experimental autoimmune encephalomyelitis (EAE). For this purpose, we administered 19F-nanoparticles in vivo and studied 19F-labeled immune cell migration into the mouse brain with fluorine-MRI. For the evaluation of the CS reconstruction quality, a broad range of undersampling factors and simulated measurement times were applied to retrospectively undersampled data.
Methods
EAE was induced in SJL/J mice and perfluoro-15-crown-5-ether (PFCE) rich nanoparticles were administered 5 days following EAE induction3. 3D ex-vivo 19F-MRI data was acquired from one symptomatic and one pre-symptomatic mouse on a 9.4T animal MR system (BioSpec, Bruker, Germany) using a cryogenically cooled quadrature RF surface probe3. A 3D-RARE protocol was employed (TR=800ms, TE=5.1ms, ETL=33, FOV=(30×20×20)mm³, matrix size=195×65×65, 23 repetitions with 17 averages each, 1 repetition ≈ 30min).
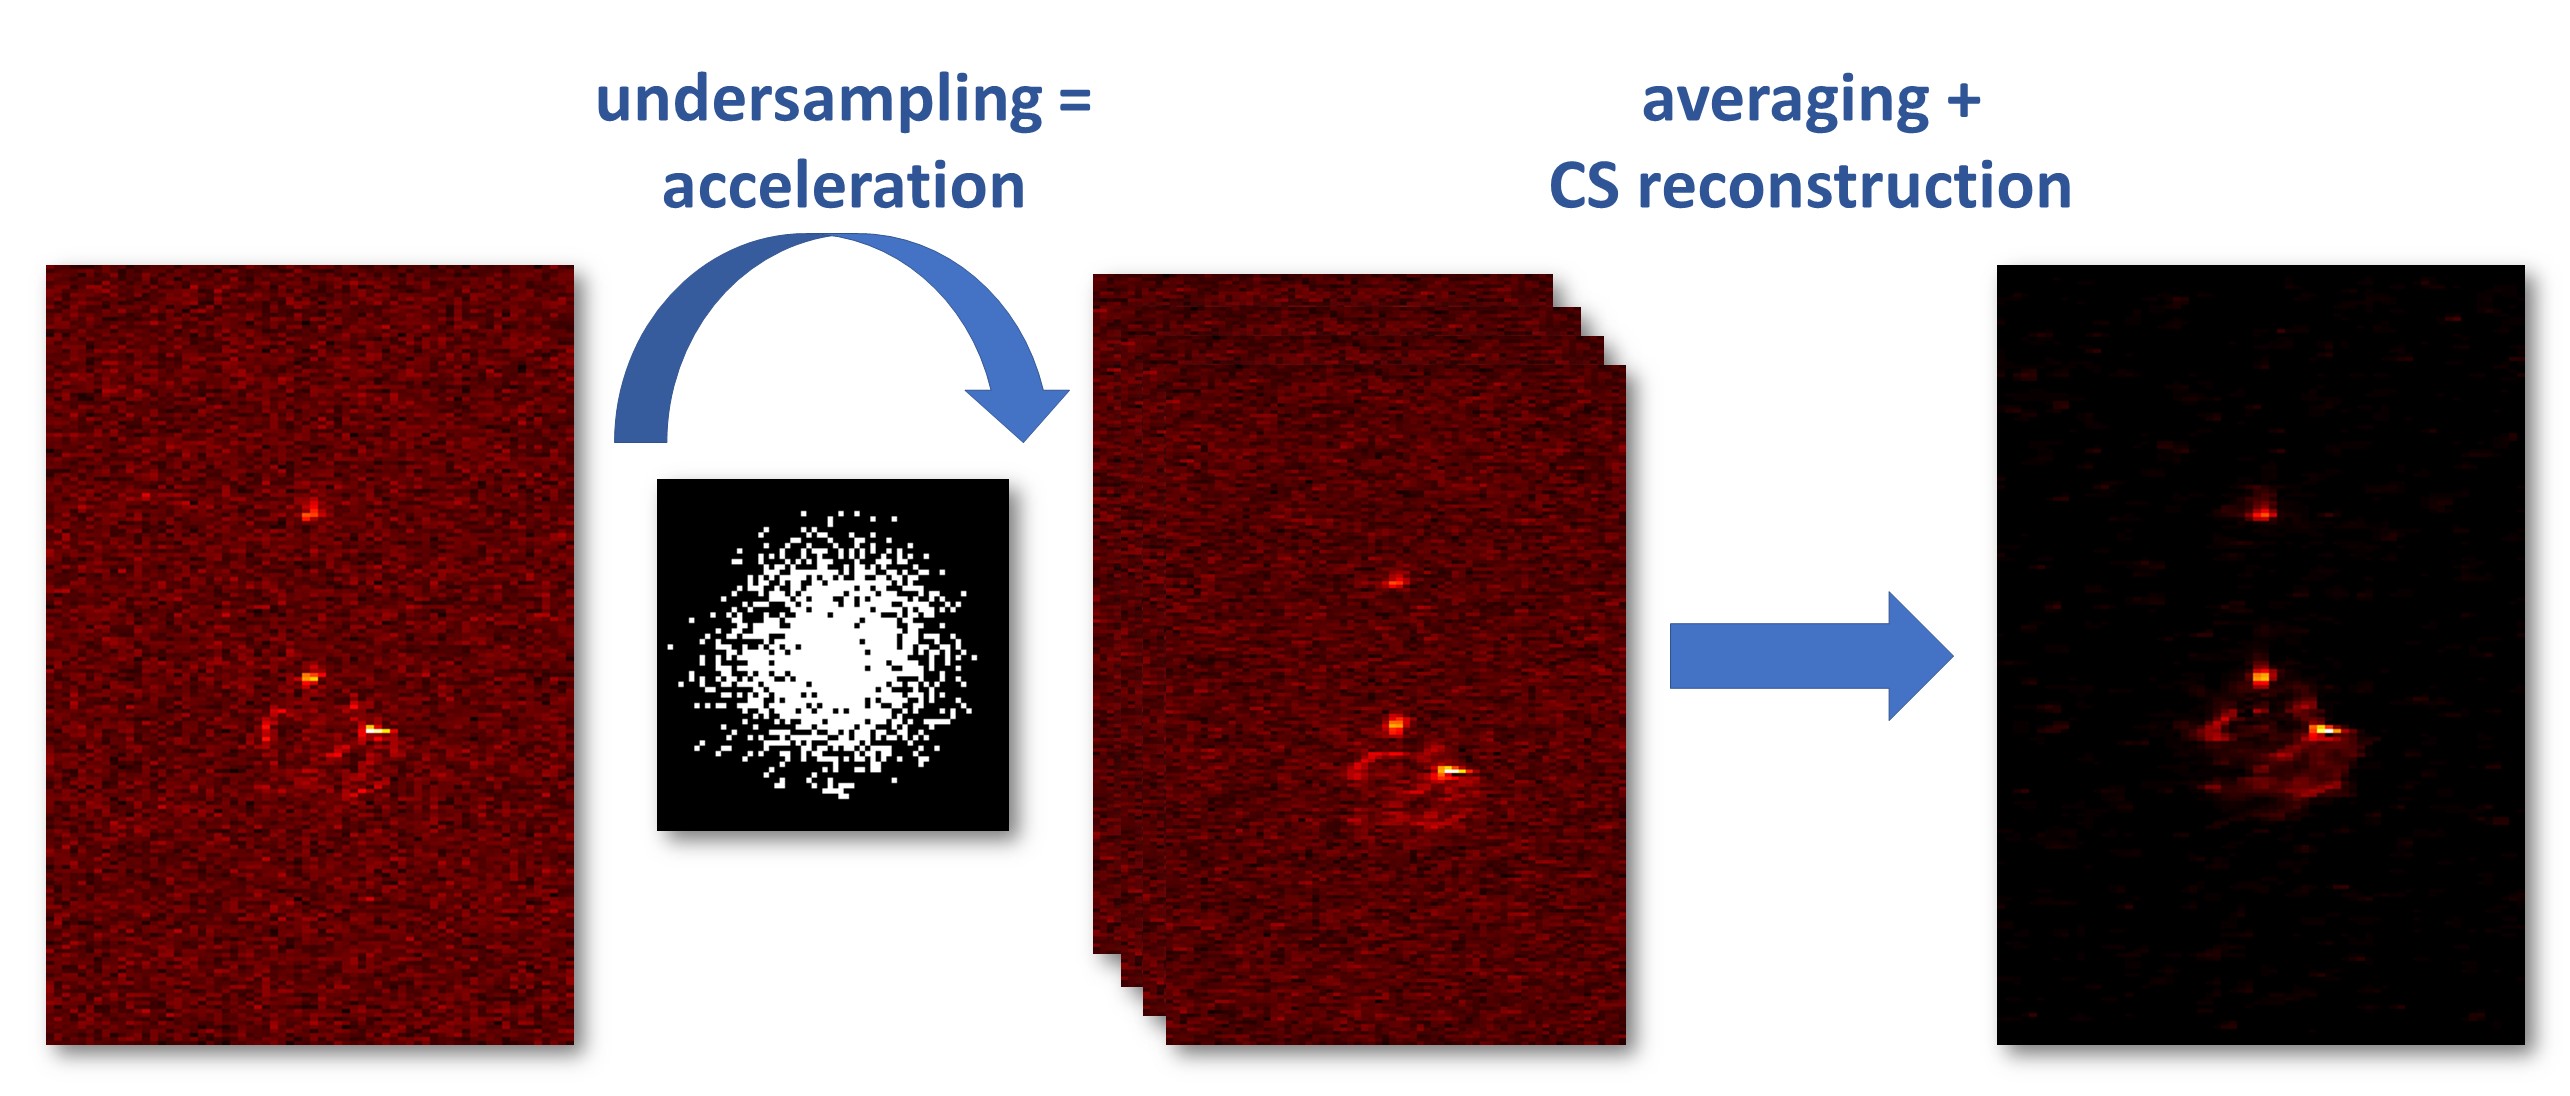
The data was undersampled using a Cartesian variable density sampling mask in the phase encoding directions. For the CS reconstructions we adapted the accelerated alternating direction method of multipliers4 and used the l1-norm of the image itself and its isotropic total variation as regularization terms (Fig. 1). CS reconstructions were compared to data that were denoised using the same algorithm. Only groups of three or more connected voxels above 2 times the standard deviation of noise of the underlying data were counted as signal. The denoised average of all 23 repetitions (11.5h scan time) was used as a reference to assess the reconstruction quality. For this purpose the normalized root-mean-square deviation (NRMSD) approach was applied. For data analysis the signal voxels of the reference were classified into bins according to their signal level followed by computation of the respective true positive rates. Similarly the voxels obtained from CS reconstructions were sorted into bins for assessment of the corresponding false detection rates. All CS reconstructions and all analyses were programmed in MATLAB 2017a (The MathWorks, USA).
Results
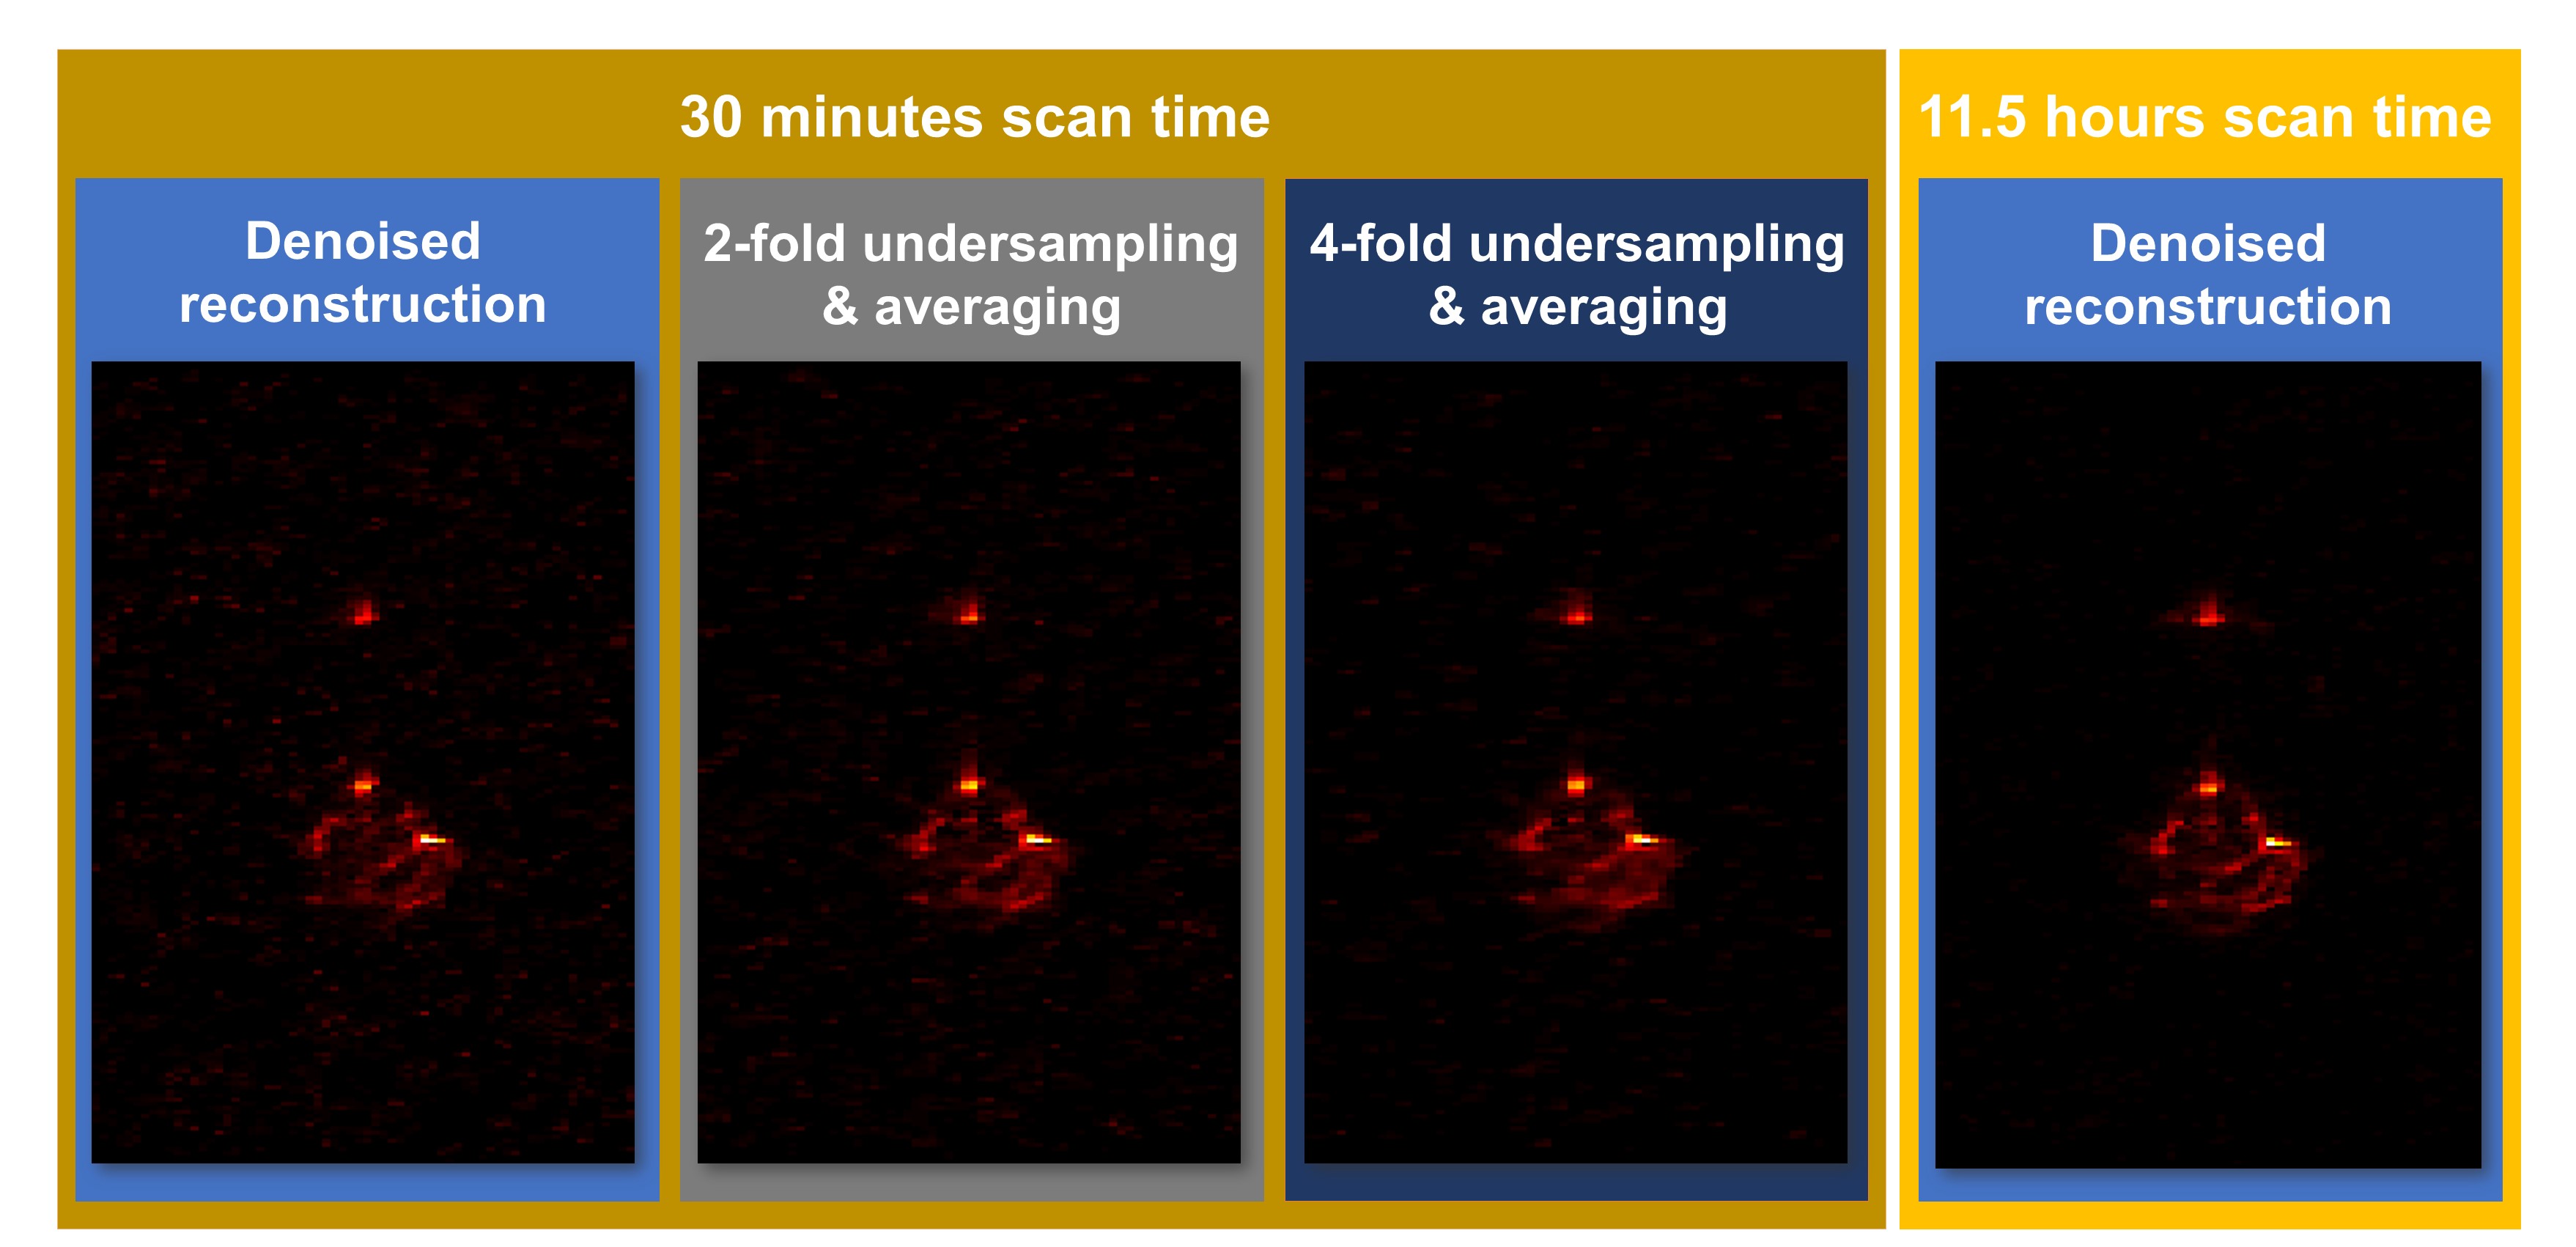
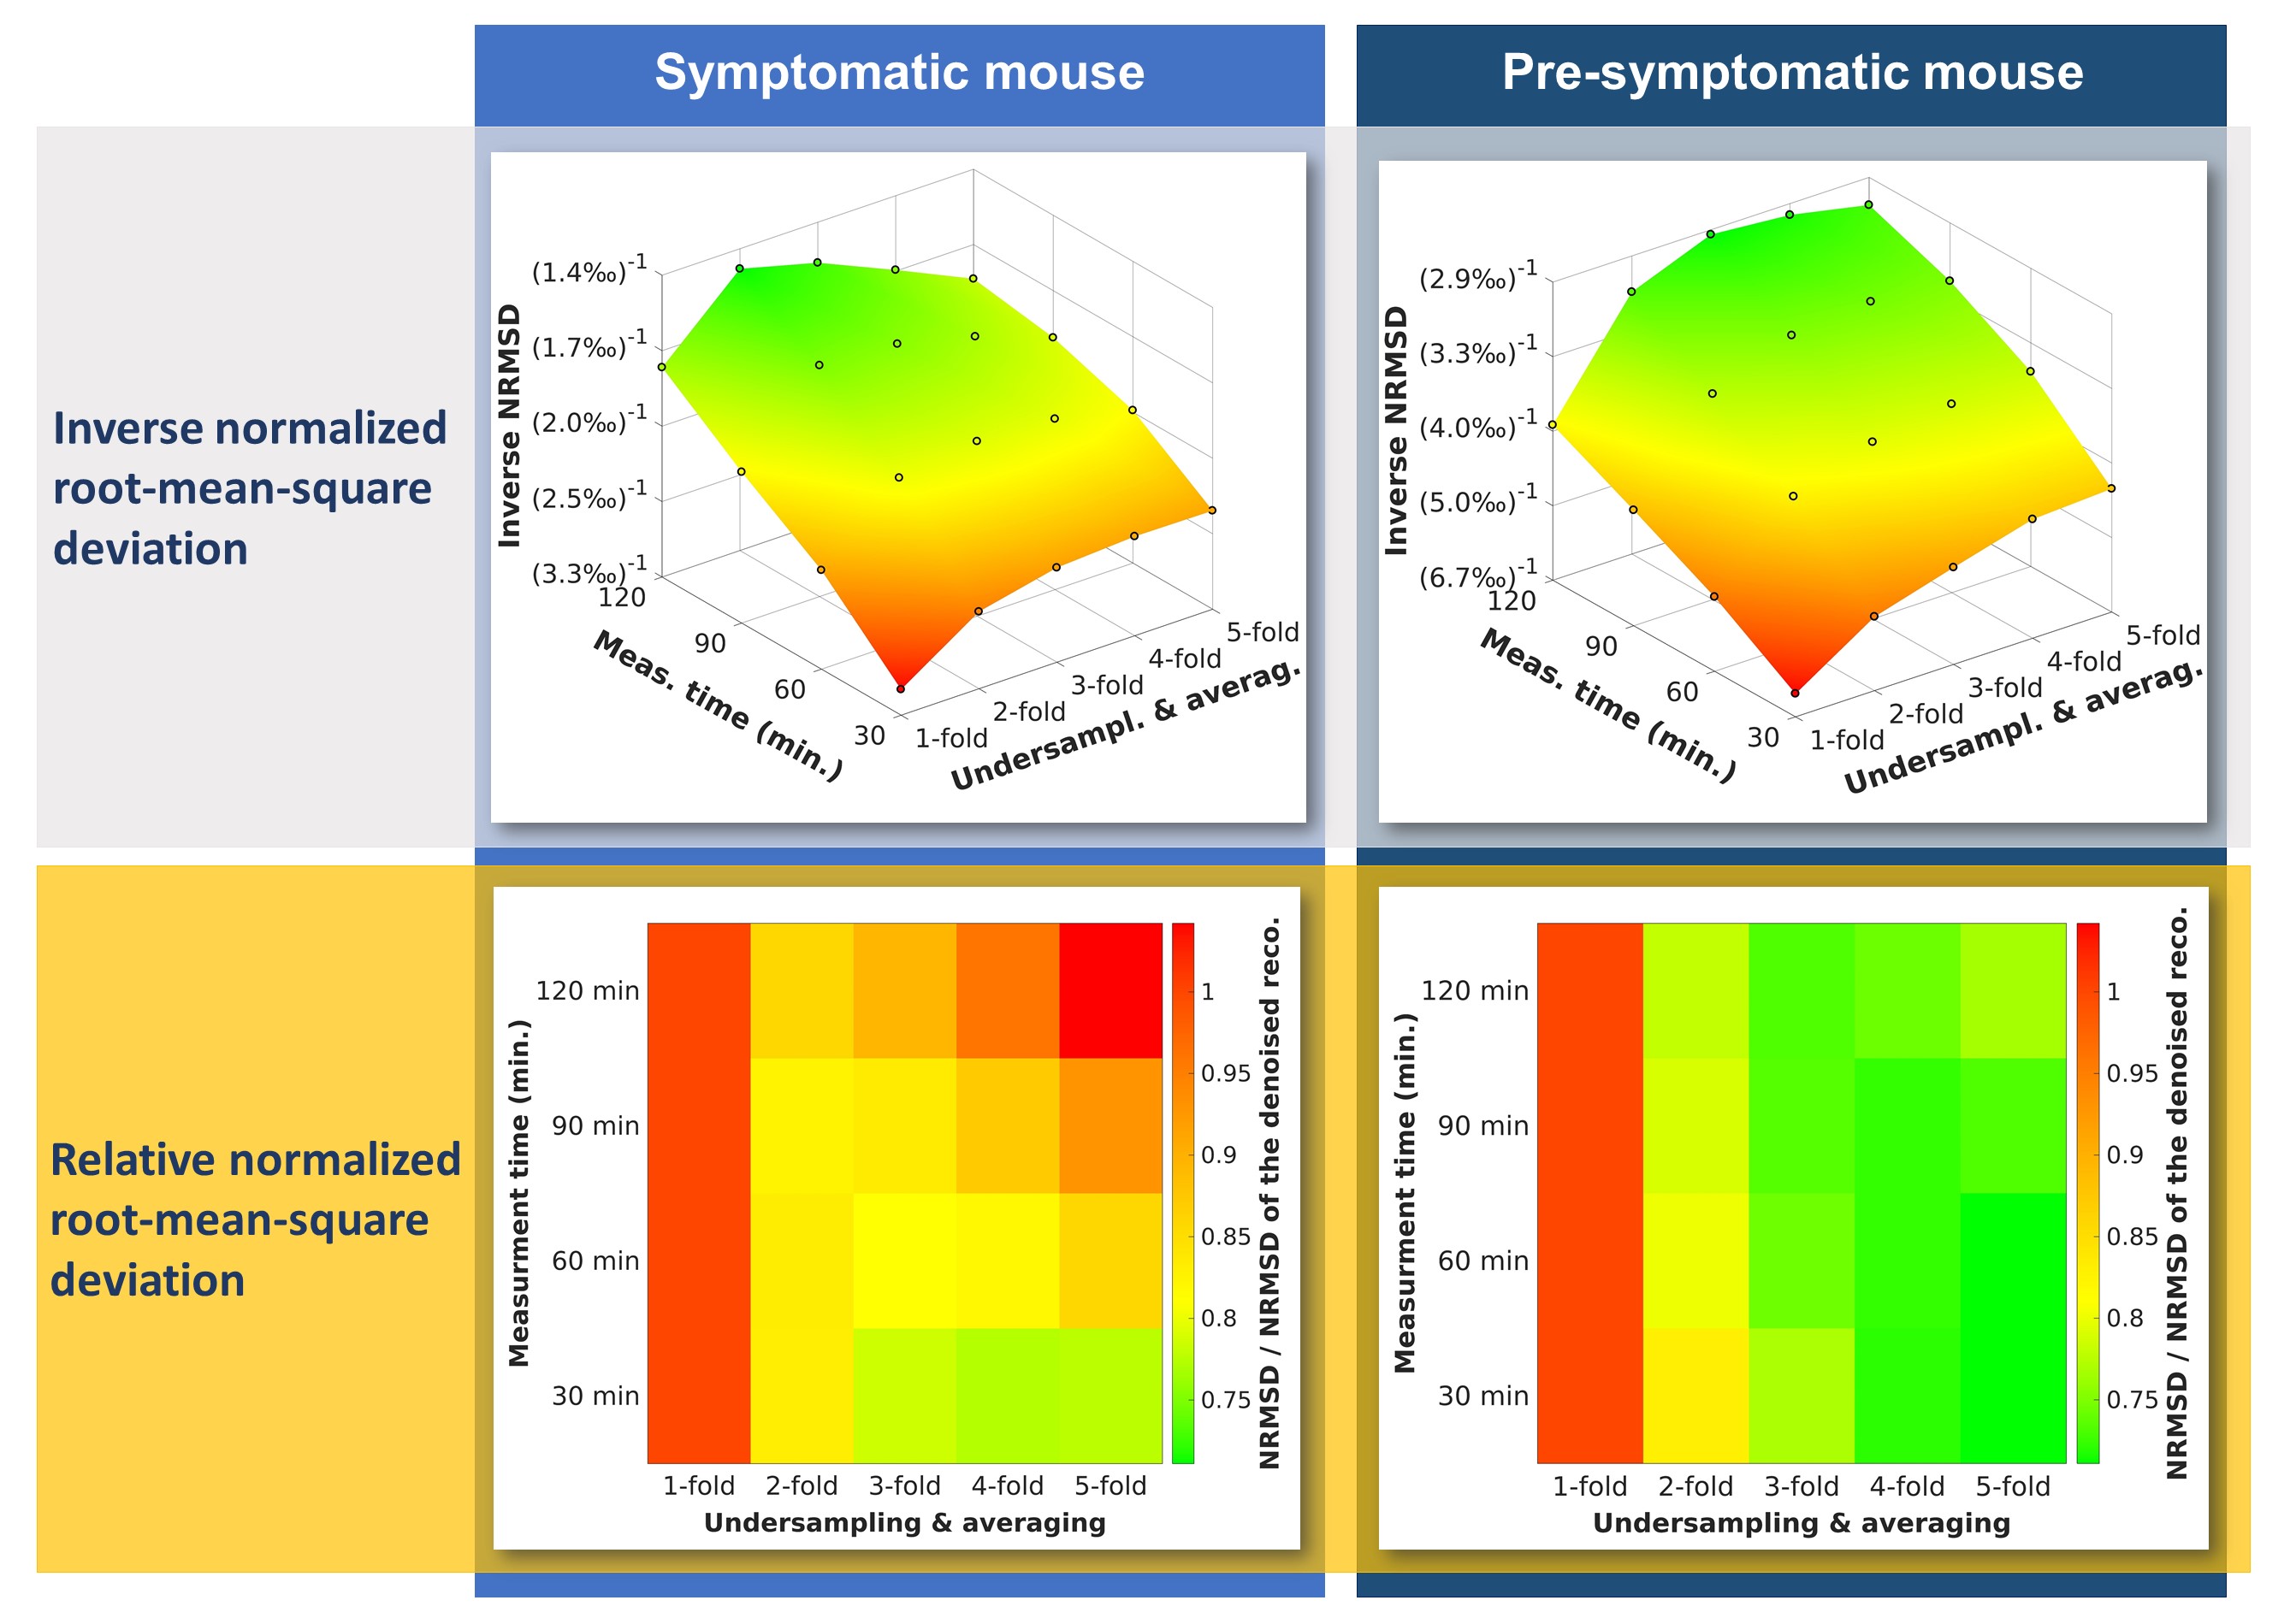
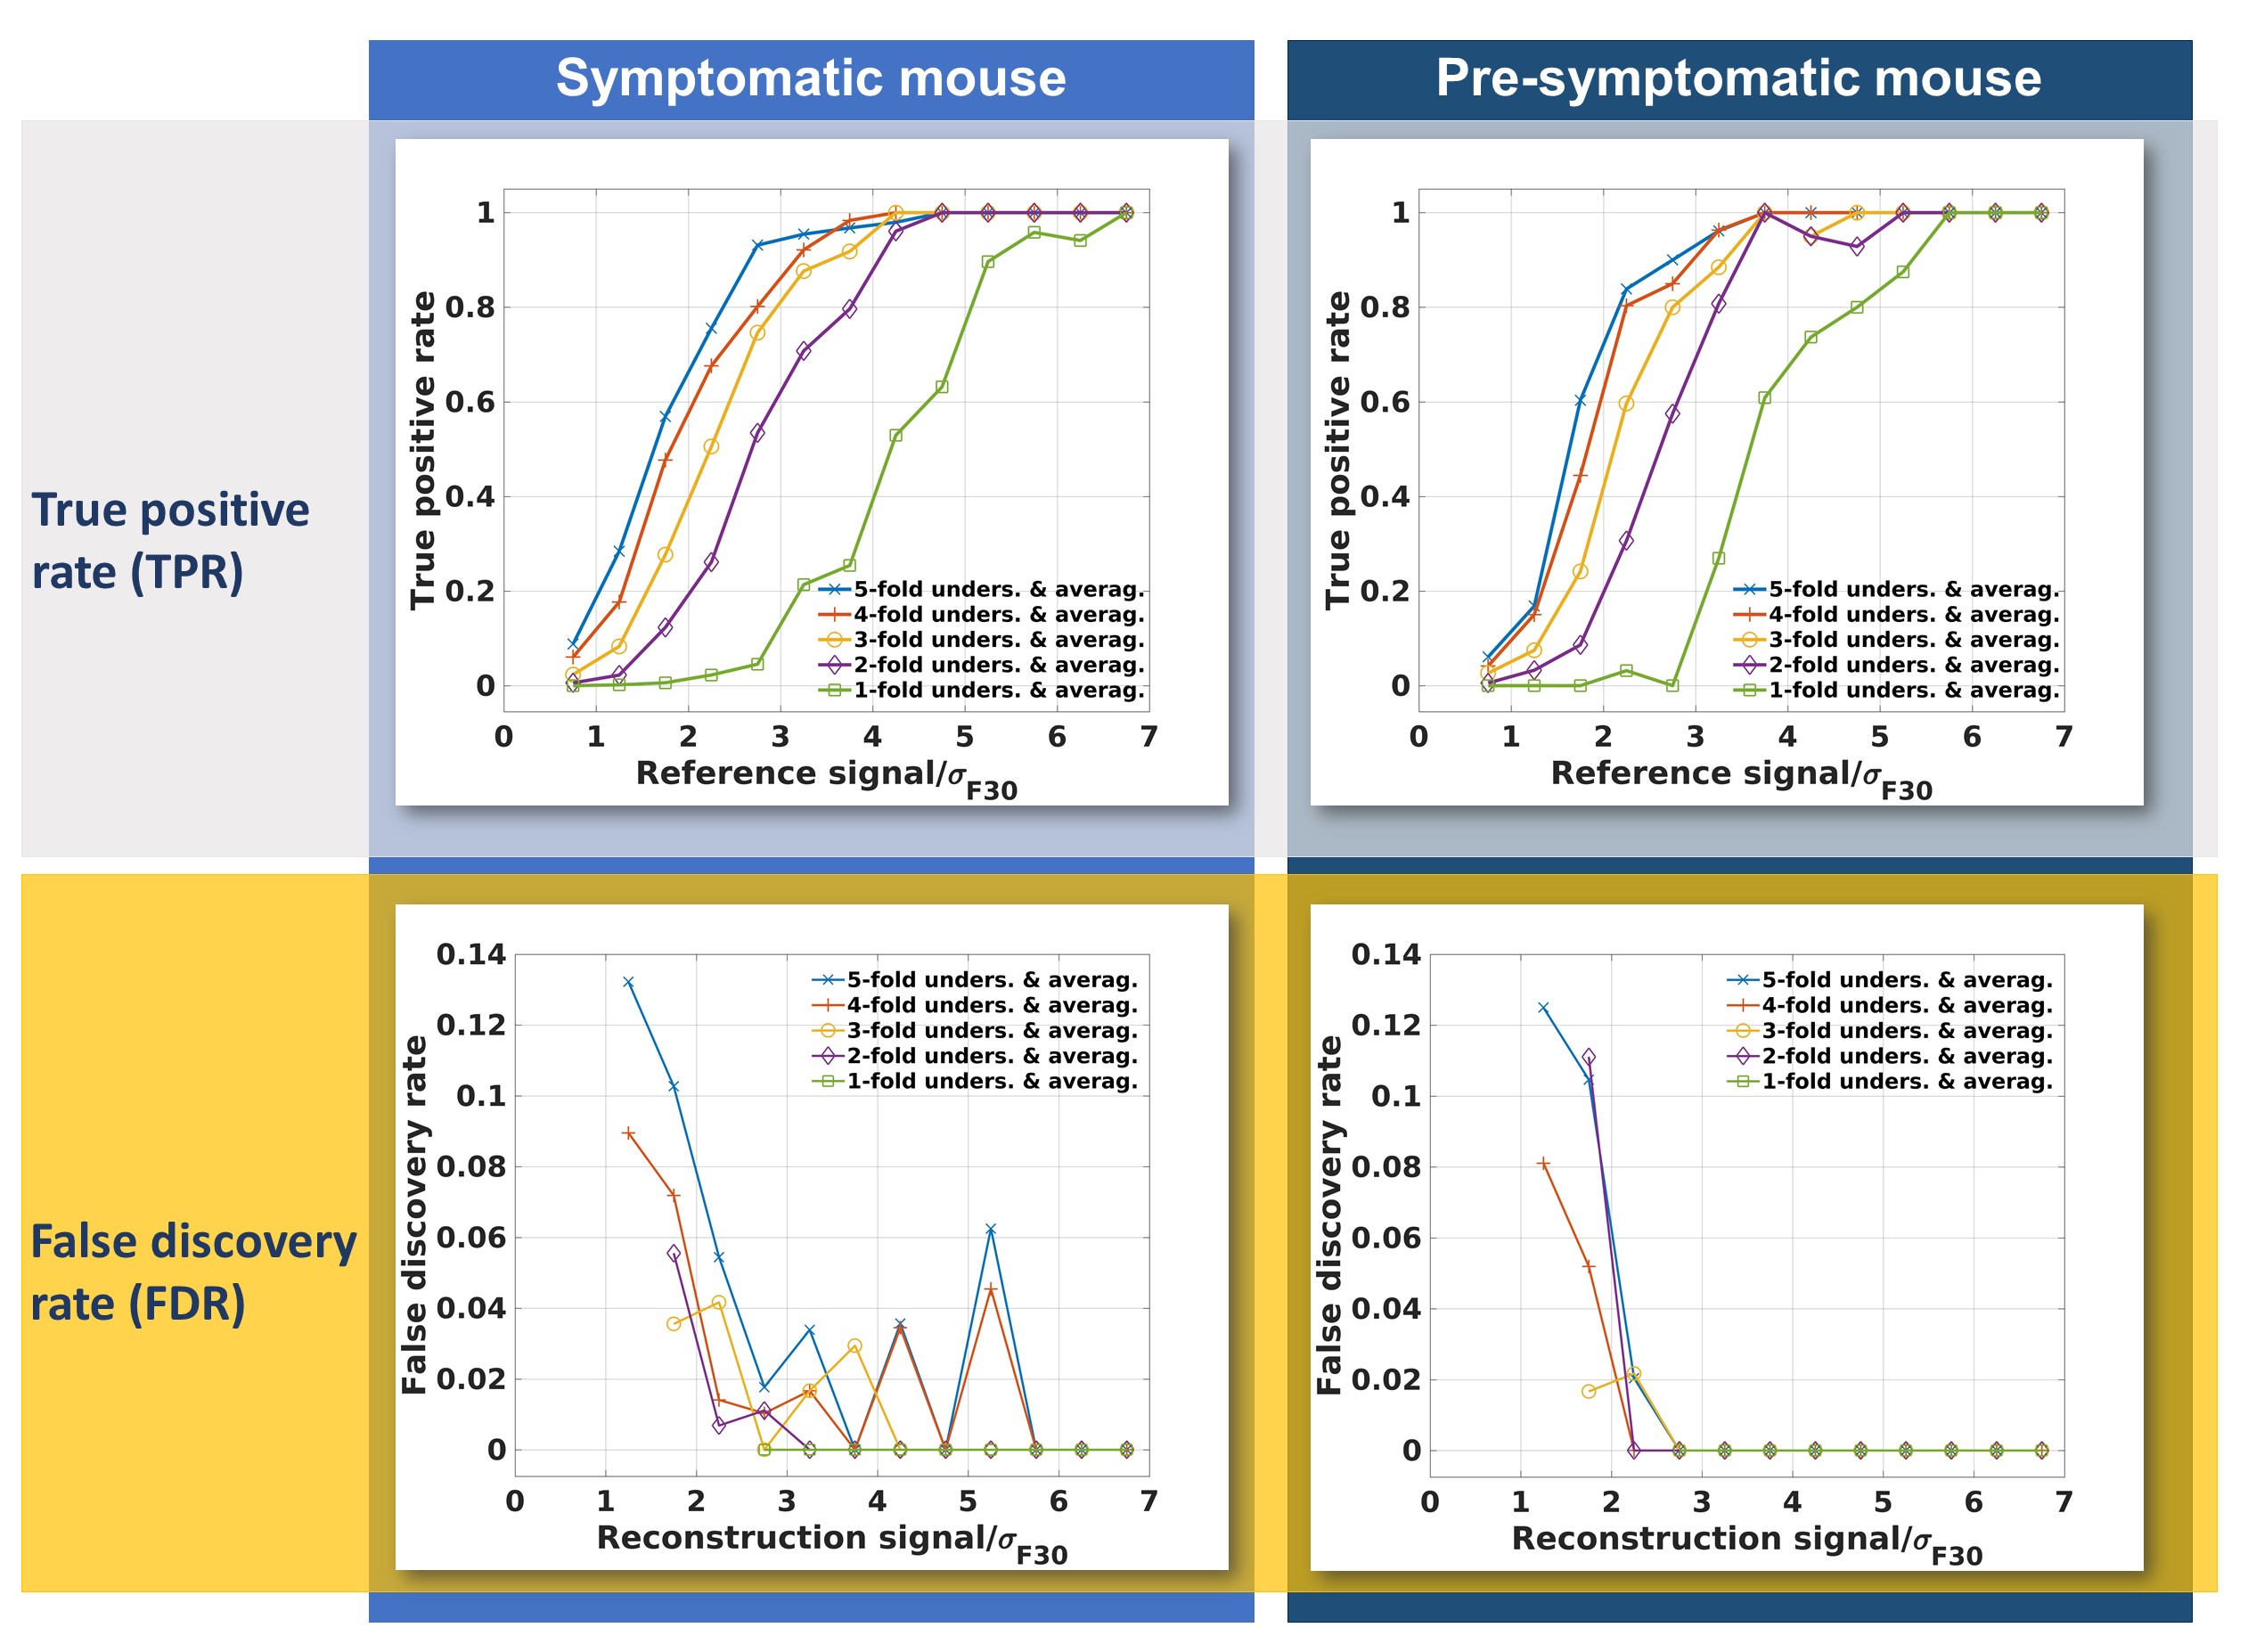
Fig. 2 surveys a comparison of the applied CS reconstruction strategies for the symptomatic mouse dataset and 30 minutes scan time. The reconstruction from 2-fold undersampled and averaged data clearly shows more signal than the purely denoised data, while being in good accordance with the 11.5 hours reference. The 4-fold variation still shows some benefits but exhibits blurring of fine details. The NRMSD (Fig. 3) also demonstrates an enhanced image quality for reconstructions that use undersampling and CS. In the case of the symptomatic mouse data this advantage is reduced for longer scan times and can even be reversed for high undersampling factors. For the pre-symptomatic mouse data (lower SNR due to lesser inflammation), using high undersampling factors is more advantageous. The true positive rate (Fig. 4, upper row) shows that CS allows the detection of more than 80% of the signal voxels at signal levels which would be well below the noise threshold in a conventional Fourier reconstruction data set. This comes at the cost of a higher false discovery rate especially for the higher undersampling factors (Fig. 4, lower row). The erroneously detected voxels were found to be usually located adjacent to true signal voxels.Discussion
Our evaluation of a range of undersampling factors and noise levels revealed that CS can increase the quality of 19F-MR data per unit scan time. This effect is most pronounced at low noise levels and high undersampling factors, which is very much beneficial for 19F-MR in vivo applications. High undersampling factors lead to increased blurring, which reverses any quality gains when the SNR of the underlying data is already high. Lower undersampling factors offer a significant increase in the true positive rate while not introducing major blurring to the images.Conclusion
Compressed sensing improves detection of 19F-nanoparticles in a mouse model of neuroinflammation. The sensitivity gain demonstrated in this work helps to lower detection levels in in vivo 19F-MRI, to enhance spatial resolution and to boost temporal resolution: these are all beneficial for tracking the migration of 19F-labeled cells in models of neuroinflammation.Acknowledgements
This work was supported by a grant of the Deutsche Forschungsgemeinschaft (DFG) to Sonia Waiczies and Andreas Pohlmann.References
1. Lustig, M., Donoho, D., Pauly, J. M. (2007). Sparse MRI: The application of compressed sensing for rapid MR imaging. Magnetic resonance in medicine, 58(6), 1182-1195.
2. Zhong, J., Mills, P. H., Hitchens, T. K., Ahrens, E. T. (2013). Accelerated fluorine‐19 MRI cell tracking using compressed sensing. Magnetic resonance in medicine, 69(6), 1683-1690.
3. Waiczies, S., Millward, J. M., Starke, L., Delgado, P. R., et al. (2017). Enhanced fluorine-19 MRI sensitivity using a cryogenic radiofrequency probe: technical developments and ex vivo demonstration in a mouse model of neuroinflammation. Scientific Reports, 7(1), 9808.
4. Goldstein, T., O'Donoghue, B., Setzer, S., Baraniuk, R. (2014). Fast alternating direction optimization methods. SIAM Journal on Imaging Sciences, 7(3), 1588-1623.
Figures