0906
Deuterium Metabolic Imaging (DMI) of Human Brain Glucose Metabolism1Department of Radiology and Biomedical Imaging, Yale University, New Haven, CT, United States, 2Department of Psychiatry, Yale University, New Haven, CT, United States, 3Department of Biomedical Engineering, Yale University, New Haven, CT, United States
Synopsis
Deuterium Metabolic Imaging (DMI) is a novel approach providing high 3D spatial resolution metabolic data from both animal models and human subjects. DMI relies on 2H MRSI in combination with administration of 2H-labeled substrates. We show how DMI combined with administration of [6,6’-2H2]-glucose can image glucose uptake and metabolism at high spatial resolution in human brain at 4T. We provide longitudinal and transverse relaxation times of 2H-labeled brain metabolites at 4T and 11.7T to support further development and optimization of DMI applications.
Introduction
13C MRS combined with infusion of 13C-labeled substrates has provided great insight into metabolism of healthy and diseased human brain (1). However, 13C MRS can currently not be performed as a 3D imaging modality due to limitations in sensitivity, magnetic field homogeneity and radiofrequency (RF) heating. Recently, Lu et al. have shown in rodent brain at 16.4T that similar metabolic information as from 13C MRS can be obtained using 2H MRS (2). Here we introduce Deuterium Metabolic Imaging (DMI), and show that 2H-labeling in brain metabolites after administration of [6,6’-2H2]-glucose can be observed in human brain using spectroscopic imaging at 4T. The data quality and feasibility of DMI strongly indicate that DMI can be established as an imaging and research tool that is easily translatable to clinical MRI systems.Methods
Human (n=2) and rat studies (n=3) were performed on 4T and 11.7T magnets, respectively, both interfaced to Bruker Avance III HD spectrometers. Human brain studies were performed with a proton transverse electromagnetic volume coil for MRI and shimming. 2H RF reception at 26.2MHz was achieved with a four-coil phased-array (8x10cm), driven as a single RF coil during RF transmission. In rats, proton MRI and shimming was performed with two orthogonal, quadrature-driven 20mm surface coils, and 2H MRS relied on a 14mm diameter surface coil. Human subjects took an oral dose (0.75g/kg) of [6,6’-2H2]-glucose dissolved in 200mL of water, while in Fischer 344 rats labeled glucose was infused intravenously (1M, 1.5g/kg). 2H MRSI signal acquisition was achieved with a pulse-acquire sequence extended with 3D phase-encoding gradients and spherical k-space encoding. In human subjects dynamic DMI data were acquired at a nominal 20x20x35mm3=14mL spatial resolution in ~9 min (TR=333ms, 4 averages) during the first 80 min after glucose intake. Steady state DMI was performed at a nominal 20x20x20mm3=8mL spatial resolution from 80 to 110 min (8 averages), followed by whole brain T1 and T2 measurements (110 to 140 min) using inversion recovery and spin-echo sequences, respectively. All 1H MRI and 2H DMI data were processed in NMRWizard, a home-written graphical user interface in Matlab 8.3. DMI processing included linear prediction of missing time domain points due to the phase encoding gradients and 5 Hz line broadening followed by 4D Fourier transformation. The resulting 2H MR spectra were quantified with linear least-squares fitting of up to four Lorentzian lines and a linear baseline. Deuterium-enriched metabolite levels were overlaid with anatomical MR images as amplitude colormaps following spatial convolution with a Gaussian kernel.Results
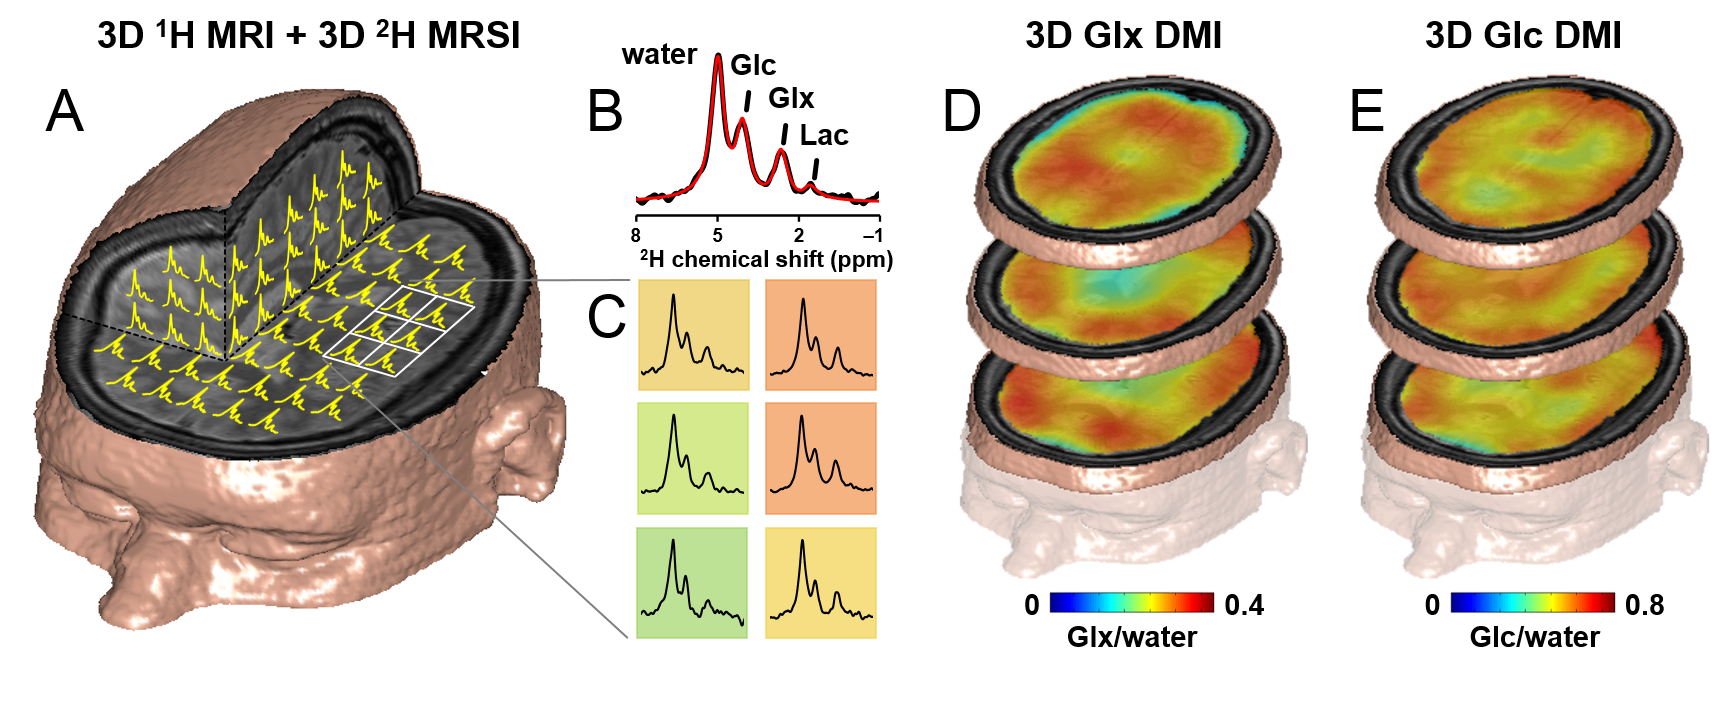
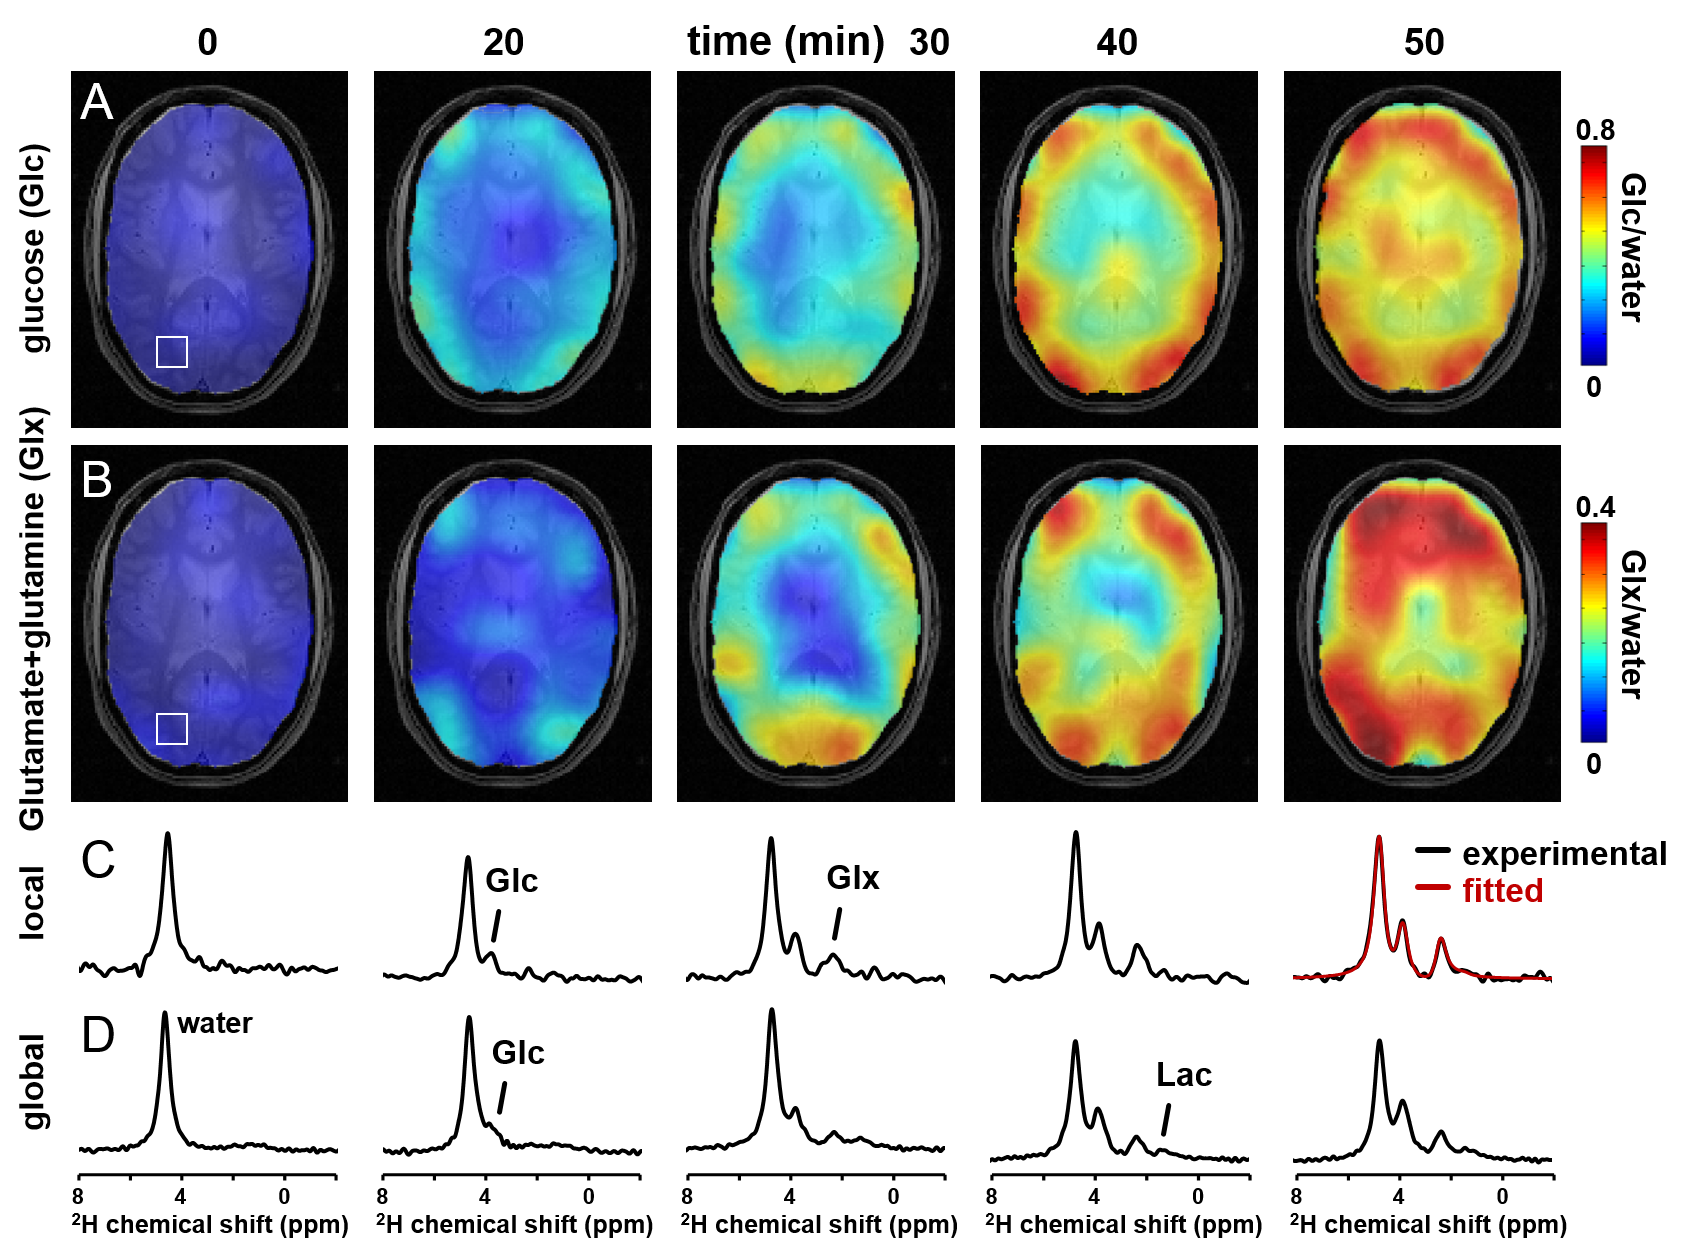
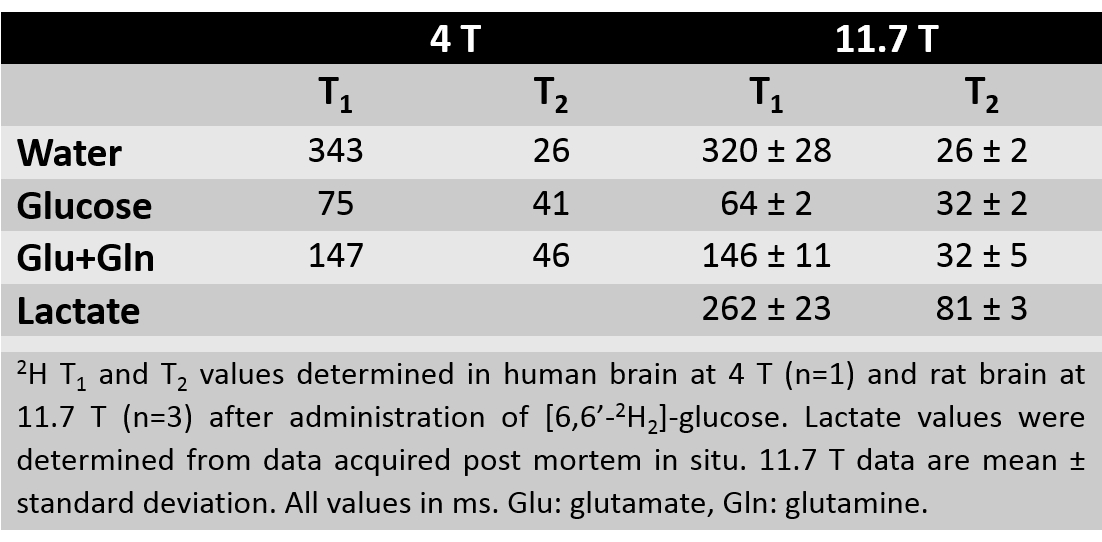
DMI combines 2H MRSI for detection of 2H-labeled metabolites following administration of a deuterium-labeled substrate resulting in 3D DM images spanning the entire brain (Fig. 1). DMI data can be acquired at metabolic and isotopic steady state, and also dynamically, following the labeling of metabolites in time (Fig. 2). Optimization of DMI requires knowledge of NMR relaxation parameters, which were measured at 4T and 11.7T and are reported in Table 1.Discussion
Following [6,6’-2H2]-glucose administration, in vivo 2H MR spectra contain peaks from the naturally abundant (0.012%) and metabolism-generated 2H-labeled water, glucose and its downstream metabolites (2,3). The short T2 values of 2H-labeled molecules result in relatively broad and partially overlapping peaks at 4T, but the spectral resolution is ample to reliably separate water, glucose and 2H-labeled glutamate+glutamine (Glx).
Besides the higher magnetic moment of deuterium’s spin 1 nucleus, the sensitivity of DMI is primarily dependent on the short T1 values of 2H-labeled molecules, which allow for boosting of SNR through rapid signal averaging. The T1 and T2 relaxation times only show a mild dependence on field strength, strongly favoring high magnetic fields for high-resolution DMI studies. The T1 values measured at 4T and 11.7T were in the range of previously reported values at 16.4T(2). DMI acquisition requires minimal RF power, due to the low NMR frequency of deuterium and the use of a single RF pulse. Further improvements of DMI include RF coil designs with homogenous transmission, and optimal nutation angles and TR values based on in vivo T1 values. This will make DMI even more suited for quantifying metabolic rates in human brain at high temporal and spatial resolution. Also other 2H-labeled substrates, such as acetate and 3-hydroxybutyrate can be used with DMI to provide further insight into human brain metabolism (4,5).
Conclusion
The current implementation of DMI provided visualizing of in vivo metabolism in human brain at unprecedented spatial resolution without the use of radioactive isotopes. Given the relative ease of implementation and the range of available 2H-labeled substrates, DMI has the potential to become a widespread MRI modality for metabolic imaging.Acknowledgements
No acknowledgement found.References
1. Rothman DL, De Feyter HM, de Graaf RA, Mason GF, Behar KL. 13C MRS studies of neuroenergetics and neurotransmitter cycling in humans. NMR Biomed. 2011;24:943–957.
2. Lu M, Zhu X-H, Zhang Y, Mateescu G, Chen W. Quantitative assessment of brain glucose metabolic rates using in vivo deuterium magnetic resonance spectroscopy. J. Cereb. Blood Flow Metab. 2017: Vol. 37(11) 3518–3530.
3. Harris RK, Becker ED, Cabral de Menezes SM, Goodfellow R, Granger P. NMR Nomenclature: Nuclear Spin Properties and Conventions for Chemical Shifts. IUPAC Recommendations 2001. Solid State Nucl. Magn. Reson. 2002;22:458–483.
4. Lebon V, Petersen KF, Cline GW, Shen J, Mason GF, Dufour S, Behar KL, Shulman GI, Rothman DL. Astroglial Contribution to Brain Energy Metabolism in Humans Revealed by 13C Nuclear Magnetic Resonance Spectroscopy: Elucidation of the Dominant Pathway for Neurotransmitter Glutamate Repletion and Measurement of Astrocytic Oxidative Metabolism. J. Neurosci. 2002;22:1523–1531.
5. Pan JW, de Graaf RA, Petersen KF, Shulman GI, Hetherington HP, Rothman DL. [2,4-13C2]-β-Hydroxybutyrate Metabolism in Human Brain. J. Cereb. Blood Flow Metab. 2002;22:890–898.
Figures