0905
PET by MRI: Glucose Imaging by 13C MRS by Noise Suppression through Tensor Decomposition Rank Reduction1Radiation Biology, NIH/NCI, Washington DC, DC, United States, 2NIH/NINDS, Bethesda, MD, United States, 3GE HealthCare, Dallas, TX, United States, 4Applied Science Laboratory, GE HealthCare, Menlo Park, CA, United States, 5GE HealthCare, Toronto, ON, Canada, 6Technical University of Denmark, Lyngby, Denmark
Synopsis
We show here a new method of imaging glucose metabolism in vivo by 13C MRS without DNP that relies on a simple but efficient postprocessing procedure using the higher dimensional analogue of SVD, tensor decomposition. Using this procedure, without sacrificing accuracy, we achieve an order of magnitude increase in SNR in both DNP and non-hyperpolarized single voxel experiments. In CSI imaging experiments, we see an approximately 30 fold increase in SNR, enough that the glucose to lactate conversions can be imaged with a time resolution of 12 seconds and an overall spatial resolution that compares favorably to 18F-FDG PET.
Rationale
Increased glucose uptake is a common feature of many cancers1-2, which makes glucose a primary target for metabolic imaging through both PET3 and indirect MRI spectroscopy imaging techniques like CEST.4-5 Metabolic imaging by 13C MRI in theory offers a non-radiologic alternative to 18F-FDG, but is limited by the inherent insensitivity of the 13C nucleus. To alleviate this problem, dynamic nuclear polarization (DNP) can be used to give a very large increase in signal. However, DNP is currently limited to a small set of molecules whose relaxation time is slow enough that the polarization is not lost before the kinetics can be determined. Unfortunately, the short T1 of glucose causes rapid relaxation of the hyperpolarized signal, meaning most of the signal is lost in DNP before glucose enters the glycolytic pathway.6Methods
Since the fundamental limitation of 13C MRI is noise, it is logical that a method that reduces noise in 13C MRI can greatly extend the utility of the technique. Current denoising methods mostly work in either the frequency or spatial domains, where the signal is complex and noise is difficult to separate from the signal. As a result, weak peaks are often suppressed during denoising. The success of accelerated imaging using low rank reconstruction7-8 suggests an alternate method. Rather than denoise each spectrum independently, it is possible to denoise the spectra collectively from the inherent low rank structure of the data using singular value decomposition (SVD) for non-localized spectra and its higher dimensional multilinear variant, tensor decomposition, for chemical shift imaging.Results and Discussiomn
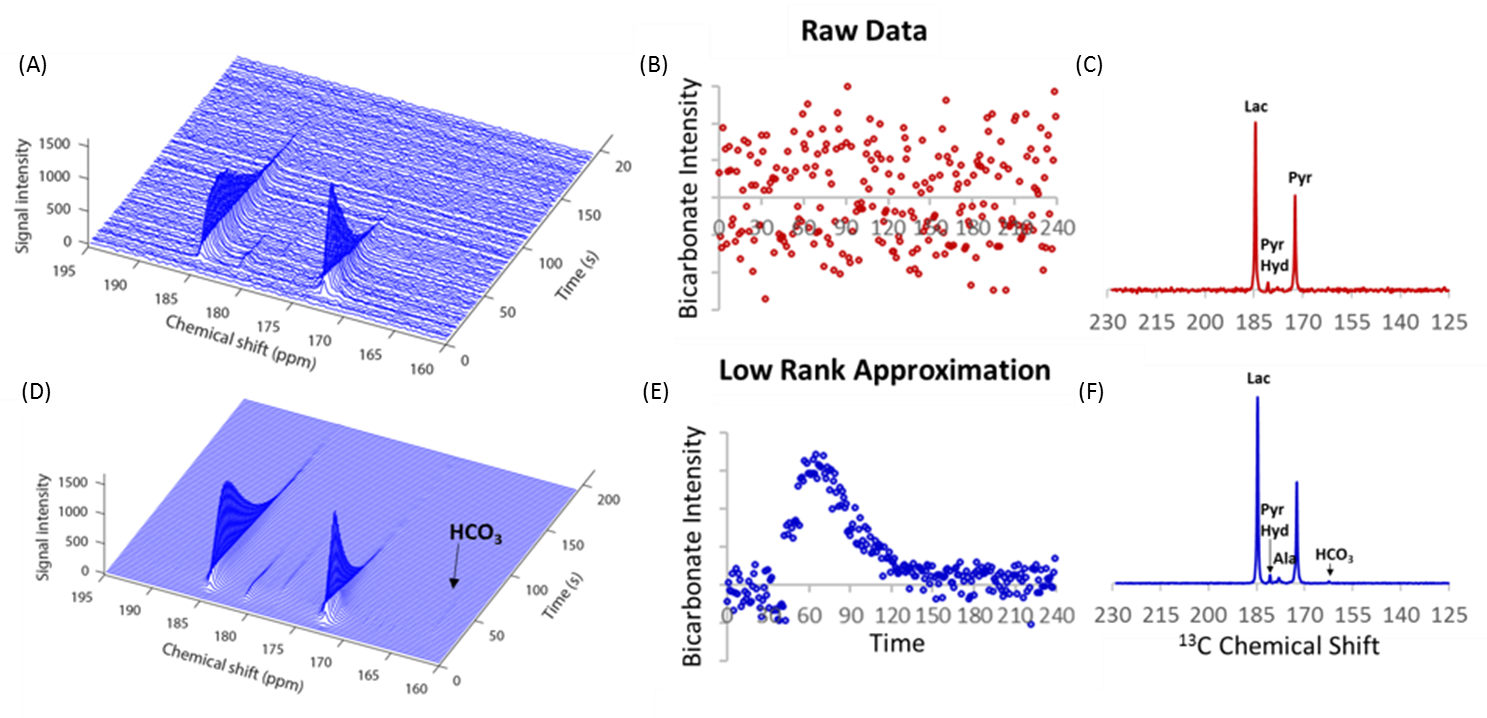
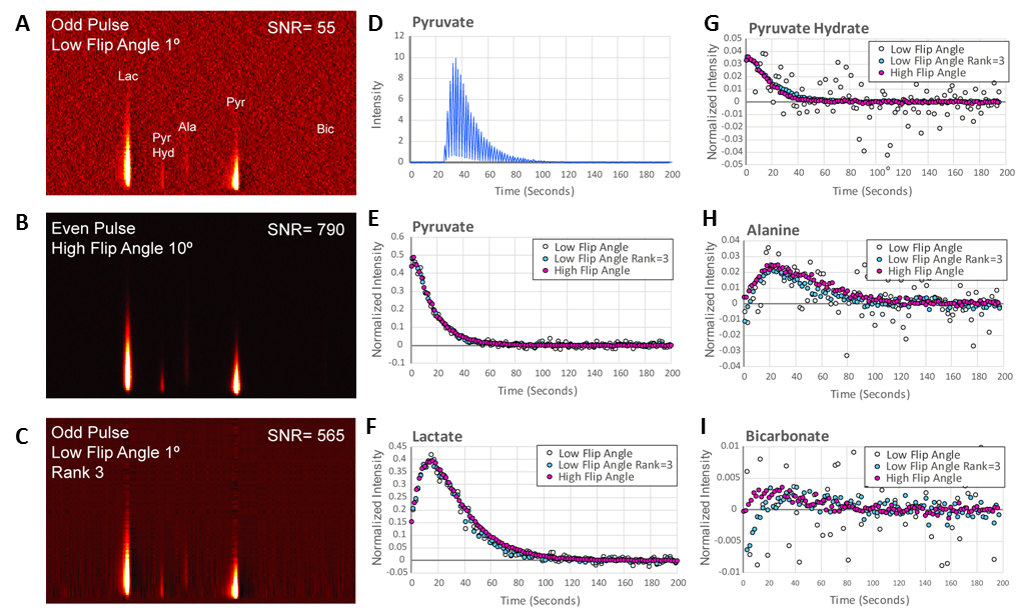
We first tested this procedure on non-localized, single pulse DNP experiments with hyperpolarized pyruvate using 41 mice with leg tumor xenografts at 3T. Overall, rank reduction by SVD to a rank of 3 resulted in an order of magnitude increase in the signal to noise in these experiments (Figure 1D). For signals of low initial quality (Figure 1A), quantification of even the strong pyruvate and lactate signals was only possible using the rank reduction technique. For signals of higher initial quality, rank reduction made possible the quantification of weak peaks that would otherwise be unnoticed, as shown by the bicarbonate peak in Figure 2. Note that no prior information on the position or existence of the bicarbonate peak is given. Experiments with alternating high and low flip angles (10º and 0.1º) in the same sample proved rank reduction allows quantitative recovery of the kinetics without bias (Figure 3).
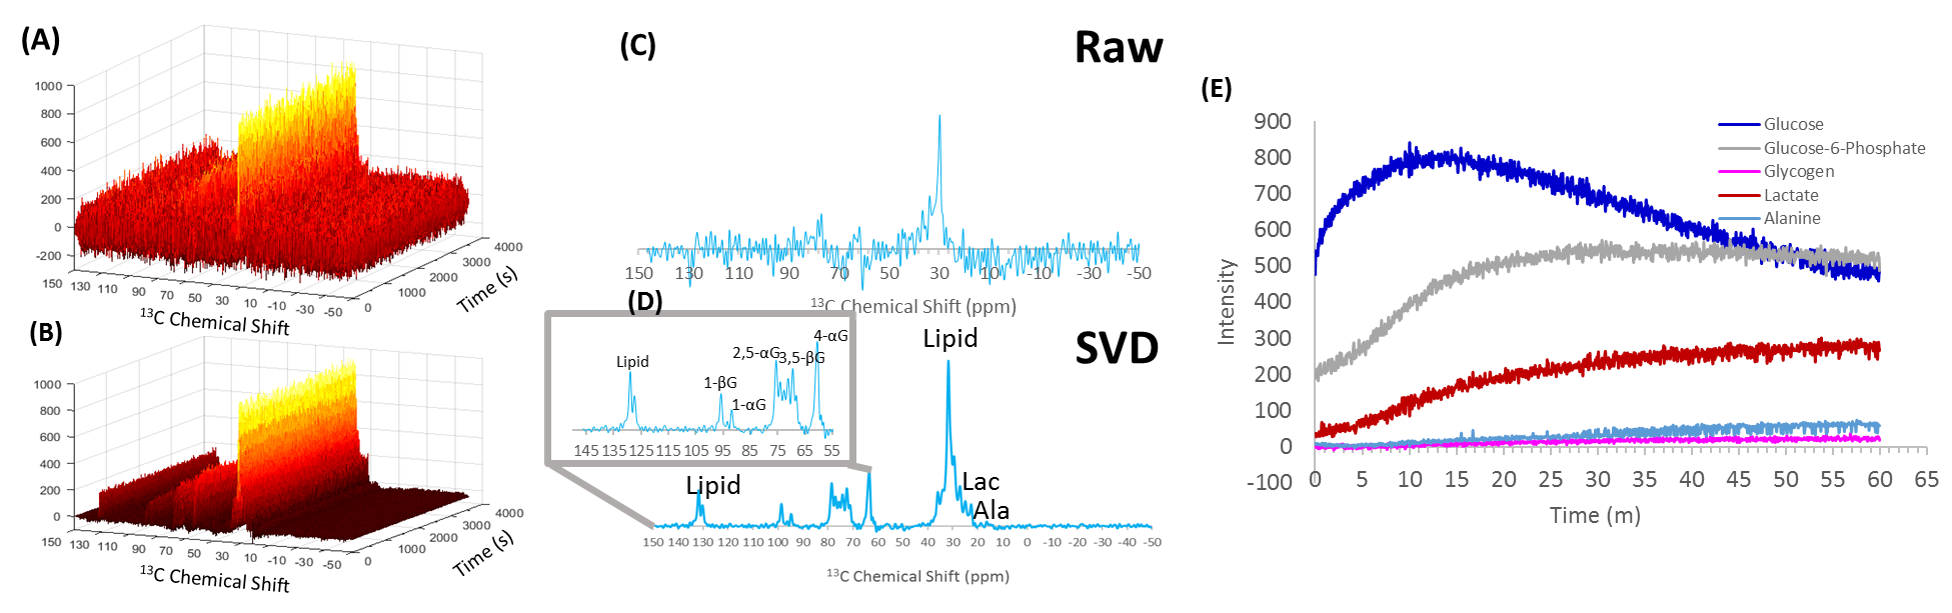
The success of SVD rank reduction in suppressing noise encouraged us to skip the hyperpolarization process entirely. While the raw signal after the injection of a 50 mg bolus of [U-13C]glucose was almost entirely noise, SVD reconstruction (rank 5) reveals a gradual uptake of glucose and a subsequent breakdown to lactate and alanine and conversion to glycogen, reflecting transport limited uptake and primarily aerobic glycolysis in this particular cell line (MiaPaca2) (Figure 4).9 Every peak of both the α- and β anomers of glucose can be identified and quantified. Previous measurements from 13C MRS were limited by signal-to-noise to taking one spectrum every 5 min, while a quantifiable signal can be acquired using rank reduction at 9.4 T every 0.8 s. The increased resolution allows measurement of the rate of uptake of glucose, which is impossible with the previous 13C measurements, and difficult even with PET imaging.10
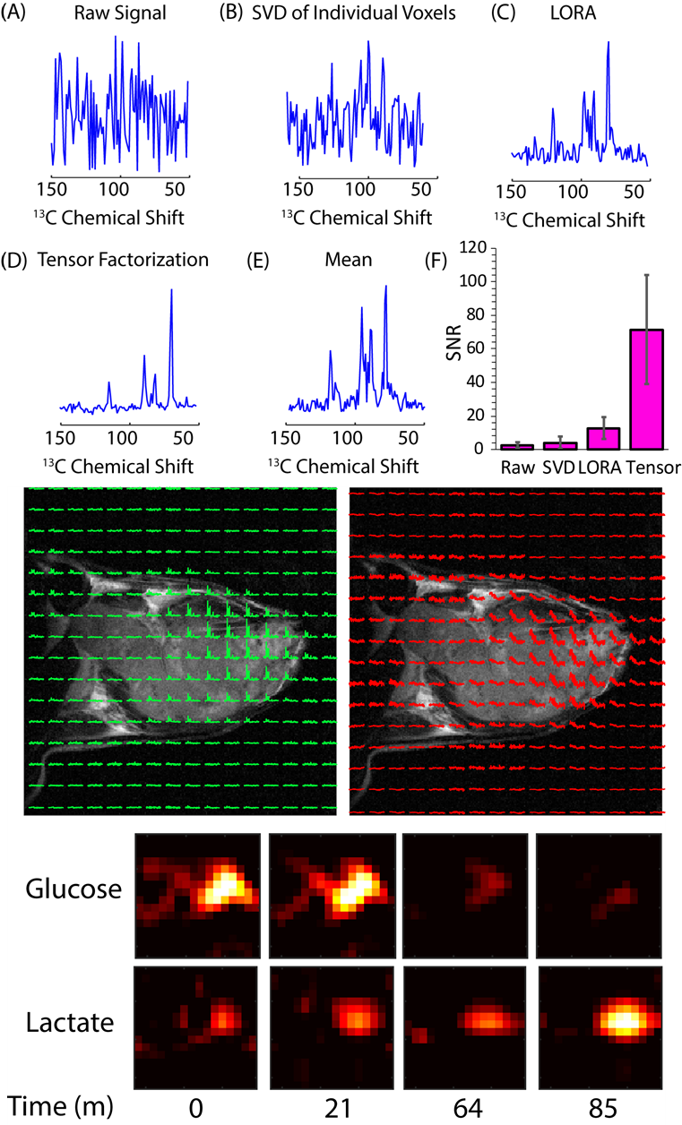
Noise suppression can be enhanced even further in imaging experiments by considering the correlations in both space and time by using the multidimensional analog of SVD, tensor decomposition. Tensor based decomposition of CSI imaging gave a 28-fold improvement in SNR (n=13), a substantial improvement over the 1.6-fold improvement obtained by treating each voxel individually by SVD. The multidimensional nature of the tensor decomposition is essential to its success, unfolding the data into a 2D matrix and then using SVD low rank reconstruction (the LORA technique11, Figure 5C) resulted in a six fold less improvement in SNR on this data set. The improvement in SNR is large enough that the SNR for each time point is actually higher than the SNR obtained by averaging over the entire time course. From a 50 mg injection of U-13C glucose, glucose, lactate, and alanine kinetics could be imaged with a time resolution of 12 s (Figure 5). Experiments with bbEPI scans showed tensor decomposition SNR improvements could also be made with image only kinetic data without a spectral dimension. By bypassing DNP, imaging by rank reduction processing may considerably expand the range of tracers that may be employed for imaging and may open new possibilities for metabolite tracking.
Acknowledgements
References
1. Hamanaka, R. B.; Chandel, N. S., Targeting glucose metabolism for cancer therapy. J Exp Med 2012, 209 (2), 211-215.
2. Hay, N., Reprogramming glucose metabolism in cancer: can it be exploited for cancer therapy? Nat Rev Cancer 2016, 16 (10), 635-649.
3. Almuhaideb, A.; Papathanasiou, N.; Bomanji, J., F-18-FDG PET/CT Imaging In Oncology. Ann Saudi Med 2011, 31 (1), 3-13.
4. Rivlin, M.; Horev, J.; Tsarfaty, I.; Navon, G., Molecular imaging of tumors and metastases using chemical exchange saturation transfer (CEST) MRI. Sci Rep-Uk 2013, 3.
5. Walker-Samuel, S.; Ramasawmy, R.; Torrealdea, F.; Rega, M.; Rajkumar, V.; Johnson, S. P.; Richardson, S.; Goncalves, M.; Parkes, H. G.; Arstad, E.; Thomas, D. L.; Pedley, R. B.; Lythgoe, M. F.; Golay, X., In vivo imaging of glucose uptake and metabolism in tumors. Nat Med 2013, 19 (8), 1067-+.
6. Brindle, K. M.; Hu, D. E.; Rodrigues, T. B.; Serrao, E. M.; Timm, K. N., Magnetic resonance imaging of tumour metabolism. Eur J Cancer 2014, 50, S5-S6.
7. Lingala, S. G.; Hu, Y.; DiBella, E.; Jacob, M., Accelerated dynamic MRI exploiting sparsity and low-rank structure: k-t SLR. IEEE Trans Med Imaging 2011, 30 (5), 1042-54.
8. He, J.; Liu, Q.; Christodoulou, A. G.; Ma, C.; Lam, F.; Liang, Z. P., Accelerated High-Dimensional MR Imaging With Sparse Sampling Using Low-Rank Tensors. IEEE Trans Med Imaging 2016, 35 (9), 2119-29.
9. Wojtkowiak, J. W.; Cornnell, H. C.; Matsumoto, S.; Saito, K.; Takakusagi, Y.; Dutta, P.; Kim, M.; Zhang, X.; Leos, R.; Bailey, K. M.; Martinez, G.; Lloyd, M. C.; Weber, C.; Mitchell, J. B.; Lynch, R. M.; Baker, A. F.; Gatenby, R. A.; Rejniak, K. A.; Hart, C.; Krishna, M. C.; Gillies, R. J., Pyruvate sensitizes pancreatic tumors to hypoxia-activated prodrug TH-302. Cancer Metab 2015, 3 (1), 2.
10. Kuntner, C., Kinetic modeling in pre-clinical positron emission tomography. Z Med Phys 2014, 24 (4), 274-285.
11. Nguyen, H. M.; Peng, X.; Do, M. N.; Liang, Z. P., Denoising MR spectroscopic imaging data with low-rank approximations. IEEE Trans Biomed Eng 2013, 60 (1), 78-89.
Figures