0904
High Field Hyperpolarized C-13 Dynamic Diffusion Weighted Imaging Based on Slice Selective Double Spin Echo Sequence1Bioengineering, UCSF & UC Berkeley, San Francisco, CA, United States, 2Department of Radiology and Biomedical Imaging, UCSF, San Francisco, CA, United States
Synopsis
We designed and optimized a dynamic double spin echo (DSE) acquisition scheme for hyperpolarized(HP) 13C metabolites dynamic diffusion weighted imaging(DWI). Compared to traditional DSE sequence, our sequence could provide higher SNR for longer dynamic imaging duration. Our studies on TRAMP mice indicate a dynamic change of HP lactate ADC over time, which might have potential to improve the assessment of aggressive cancers.
Introduction
Hyperpolarized (HP) 13C MRI has shown strong potential to non-invasively image cancer, most commonly through imaging the metabolic conversion of [1-13C]pyruvate to [1-13C]lactate[1,2]. HP 13C MRI also has the potential to measure the efflux of lactate from the intra to extra cellular environment, which has been shown to be increased in multiple tumor types including renal, prostate, and breast cancer[3,4,5]. In vivo measurements of lactate efflux have used diffusion weighted imaging (DWI), which relies on spin-echo (SE) based approaches to separate intra and extra cellular metabolite signals[7,8]. However, there are a number of challenges for SE based sequences, such as magnetization saturation due to imperfect refocus pulses[6] and the limited coil volume[9], as well as signal modulations due to slice profile effects[10]. Previously, we designed a slice-selective double spin echo (ss-DSE) to overcome the drawbacks mentioned above. In this work, we extended previous work to dynamic DWI as an optimized ss-DSE sequence. As the injected HP compound is the only source contributing to the imaging signal, dynamic DWI might provide more information related to the perfusion, metabolism, and efflux of HP metabolites.Methods
ss-DSE design
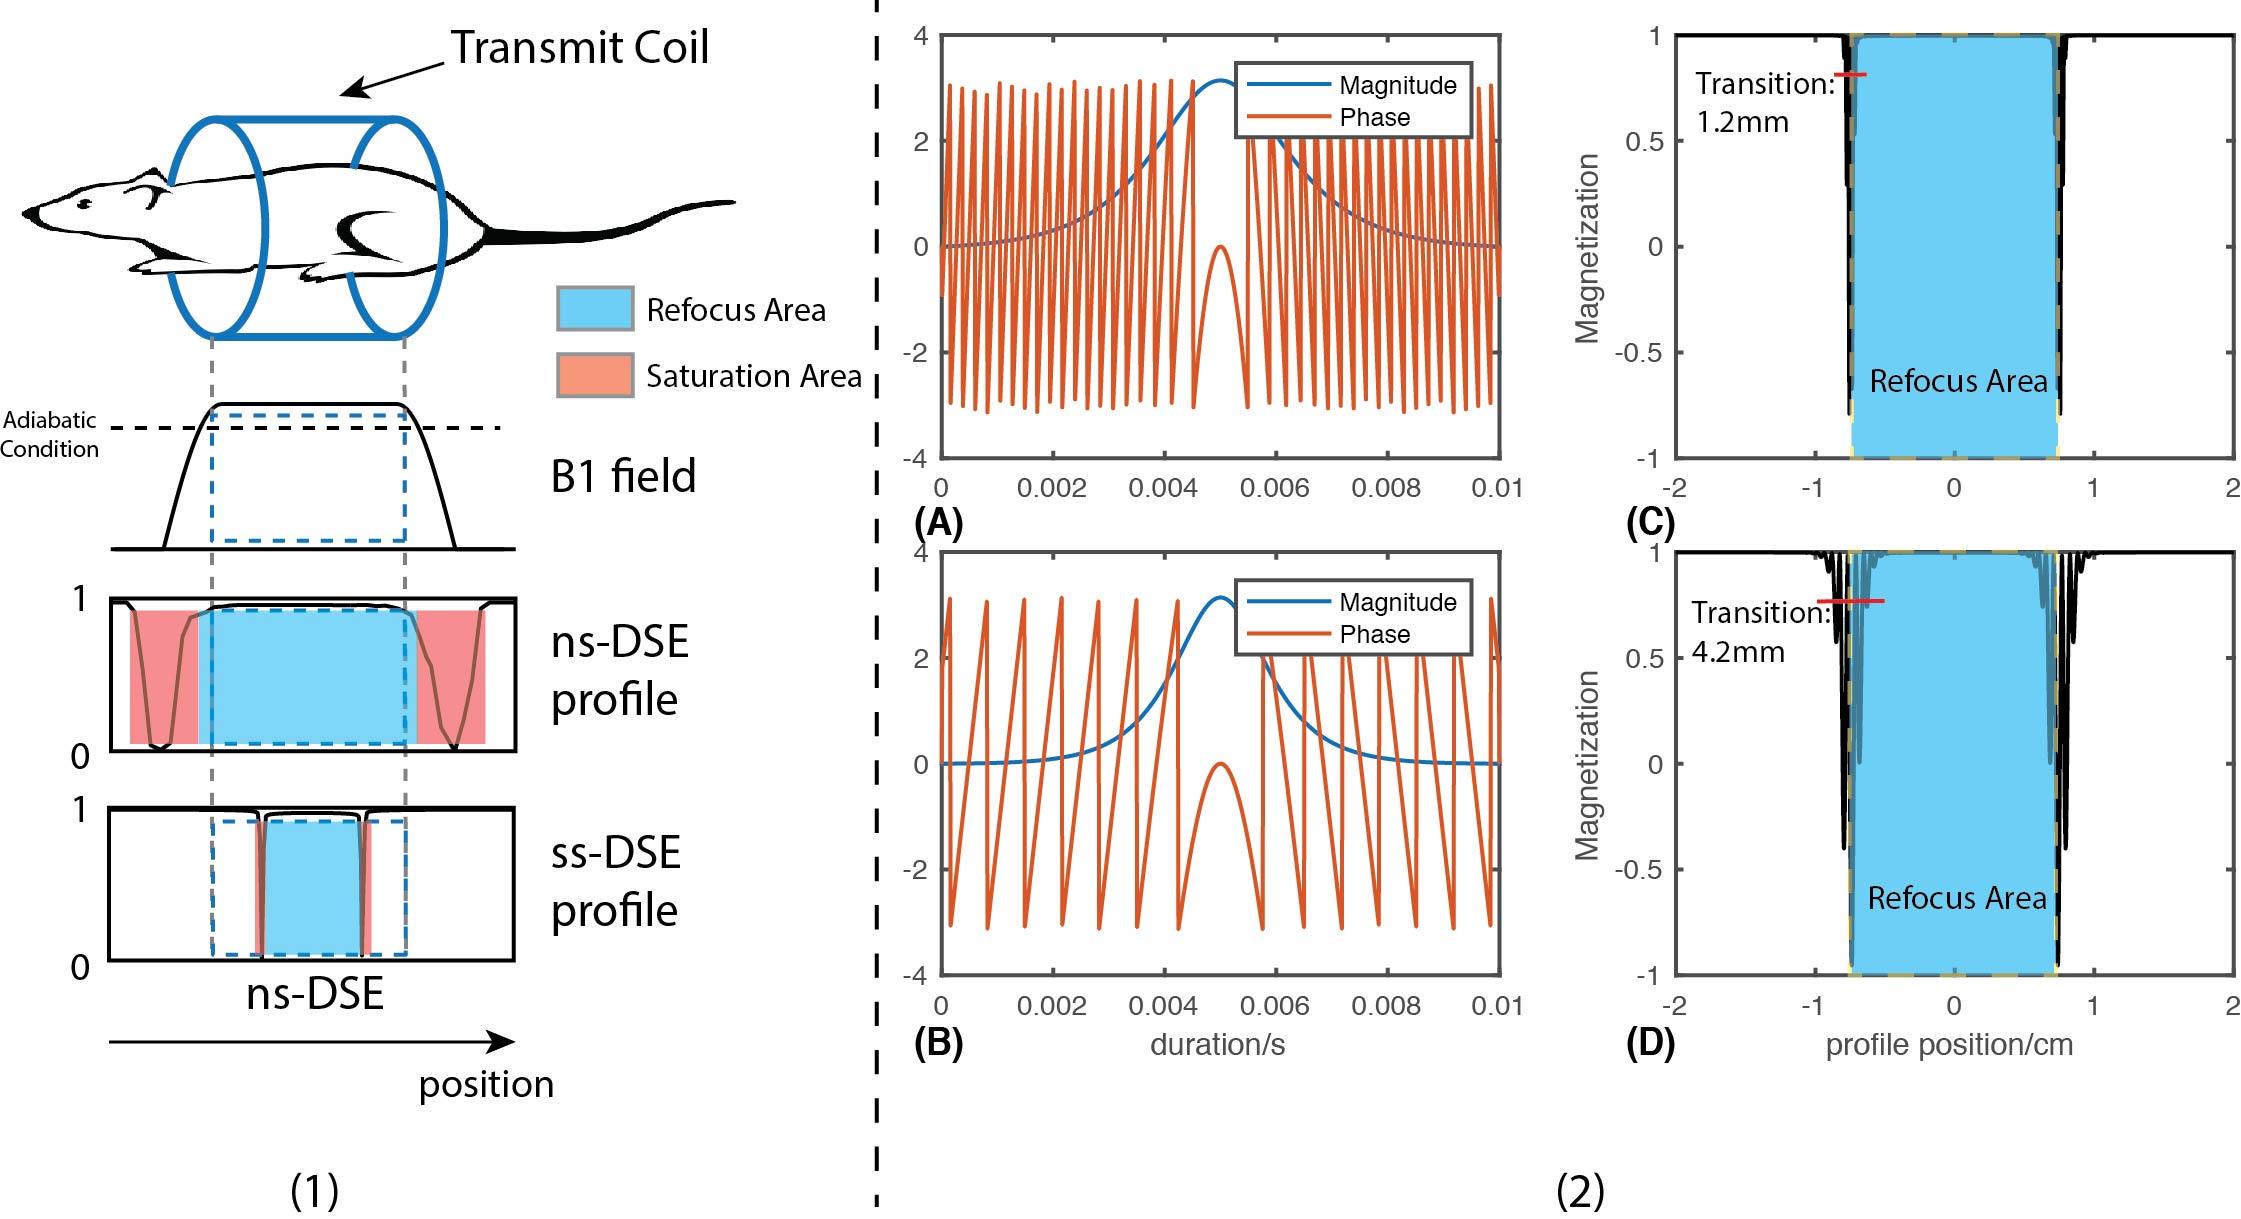
In previous work, we described the details about design our ss-DSE and compared to the ns-DSE[13]. According to Fig.1(1), the ss-DSE showed a smaller saturation effects than the ns-DSE sequence, and in (2), the optimized high bandwidth pulse had a smaller transition area (1.2mm) than the low bandwidth pulse (4.2mm).
In vivo study and acquisition scheme
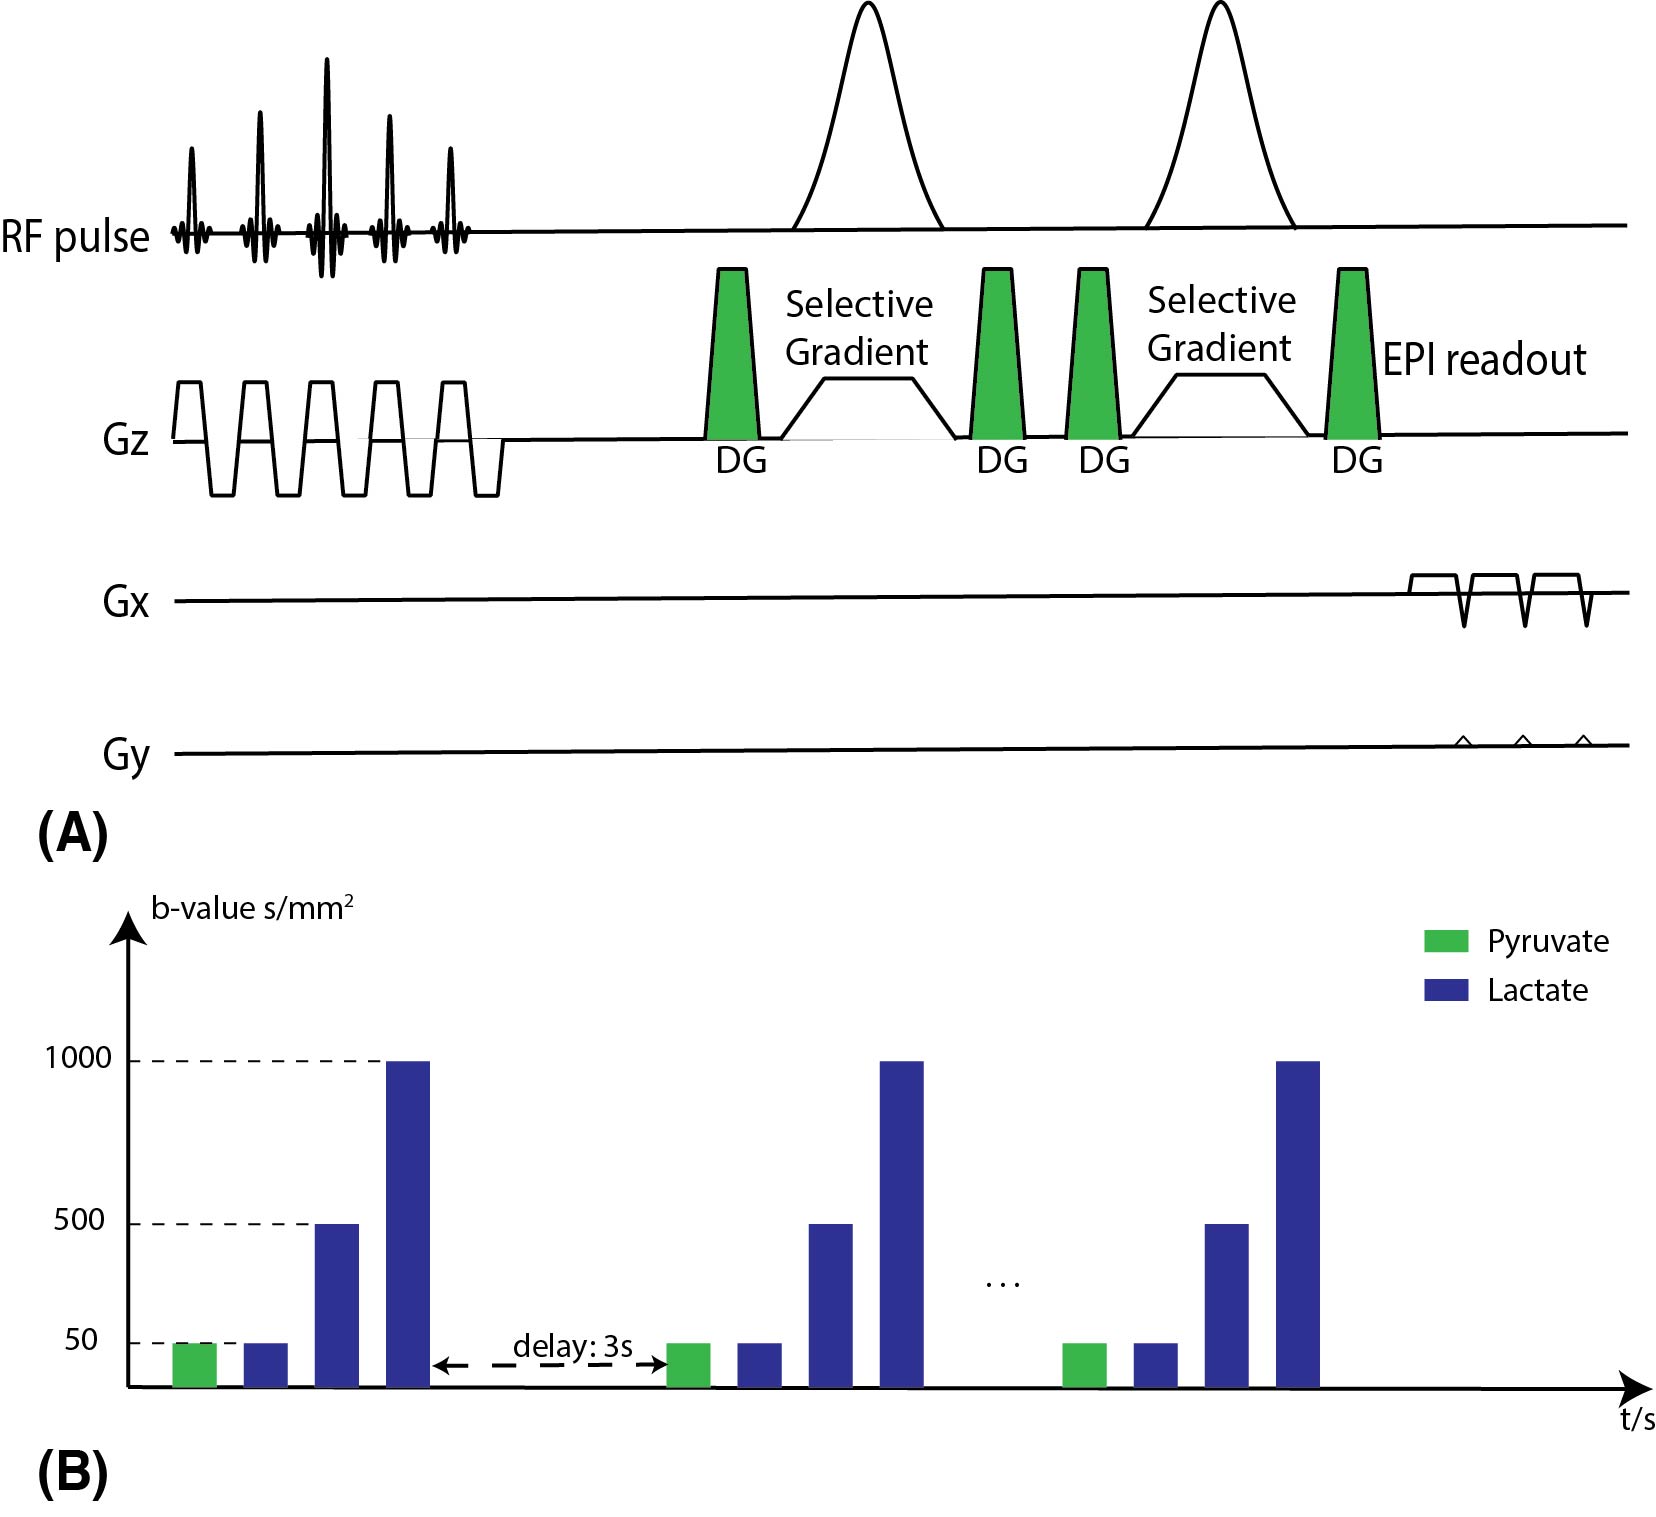
In vivo data were acquired in transgenic adenocarcinoma of the mouse prostate(TRAMP)(n=2) on a 14T vertical imaging system (Agilent). All the HP 13C sample preparation steps were summed in our previous work[13]. 350μL HP pyruvate was injected over 15s via tail vein, and the sequences started at the end of the injection. The DSE sequence used a flyback EPI readout, with 10mm slice thickness and 2x2mm2 in-plane resolution. Based on prior ex vivo studies[8,9], the signal from HP lactate generated and exported from cells would last ~20s. Thus we chose our DWI acquisition to cover 20~30s. The temporal resolution was 3s, and in each timepoint HP pyruvate was acquired with 1 low b-value (50s/mm2) with 10° flip-angle and HP lactate was acquired with 3 different b-values (50, 500, and 1000s/mm2) with a constant 30° flip-angle. The acquisition scheme details are summarized in Fig.2.
Data analysis
Dynamic low b-value HP pyruvate and lactate images were used to calculate metabolic flux of HP 13C-pyruvate to lactate (kPL) and the overall decay rate. At each time point, three different b-value images were fitted to mono-exponential model pixel-by-pixel to calculate the apparent diffusion coefficient (ADC) map.
Results and Discussion
ns-DSE, ss-DSE performance comparison
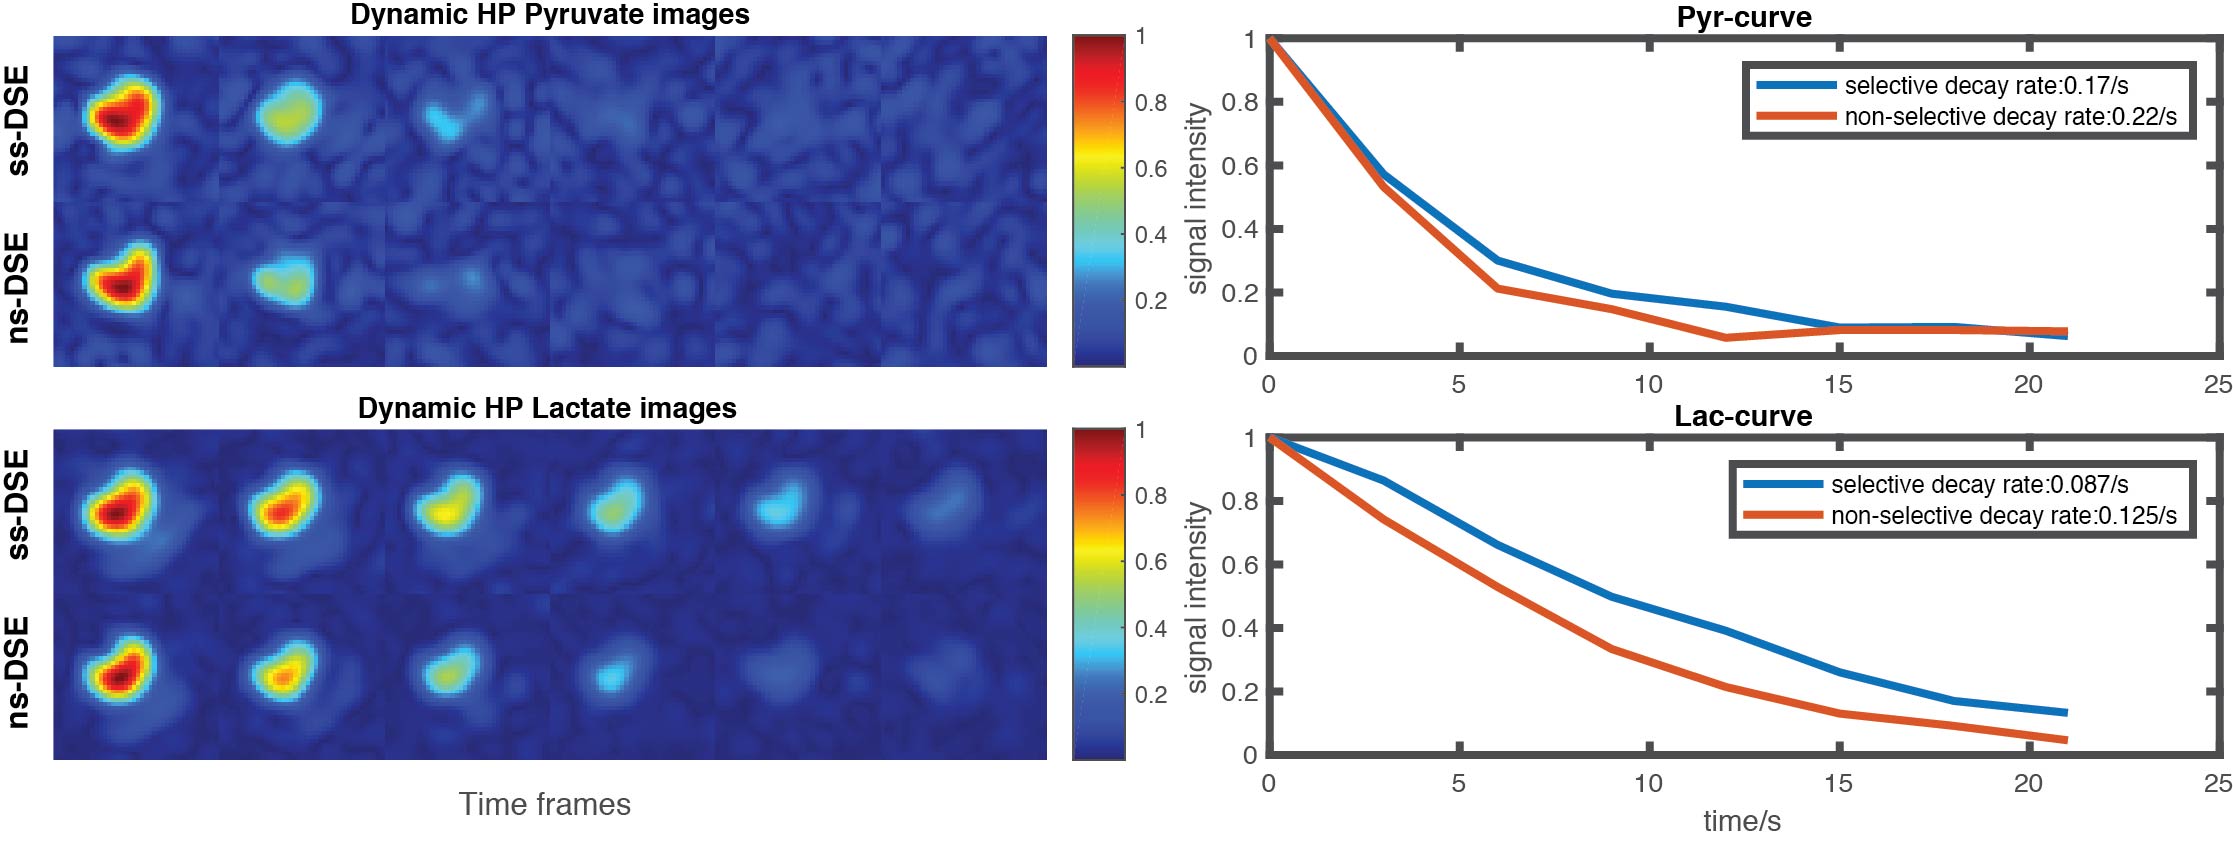
For each study the experiment was performed twice, once with ss-DSE and the other with ns-DSE, using the same parameters for performance comparison. The dynamic HP 13C pyruvate and lactate low b-value images are compared in Fig.3. The overall decay rate of pyruvate and lactate was directly calculated without any corrections (e.g. for flip angle or T1 decay compensation). Both HP lactate and pyruvate decay rates with ss-DSE acquisition were lower than with ns-DSE, providing higher SNR at later time points. And, the estimated kPL was .094/s for ss-DSE, .071/s for ns-DSE in the tumor, also likely due to differences in saturation between the sequences.
Dynamic HP Lactate DWI
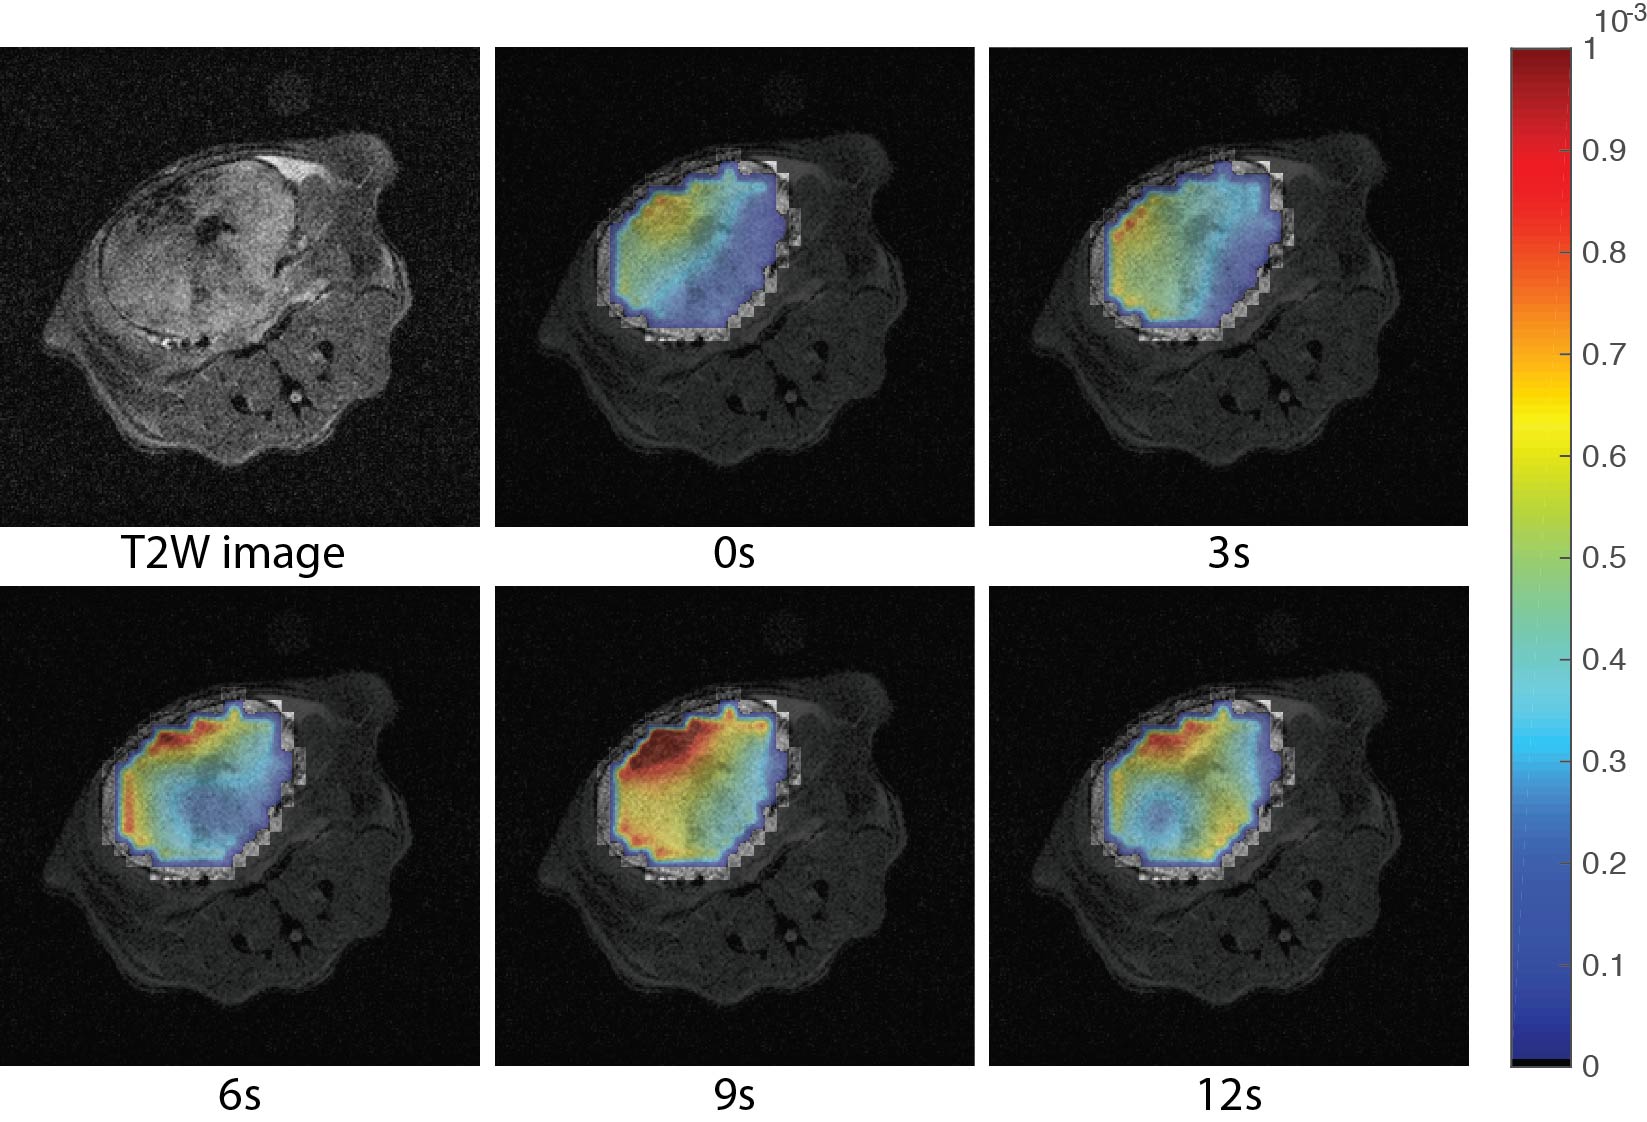
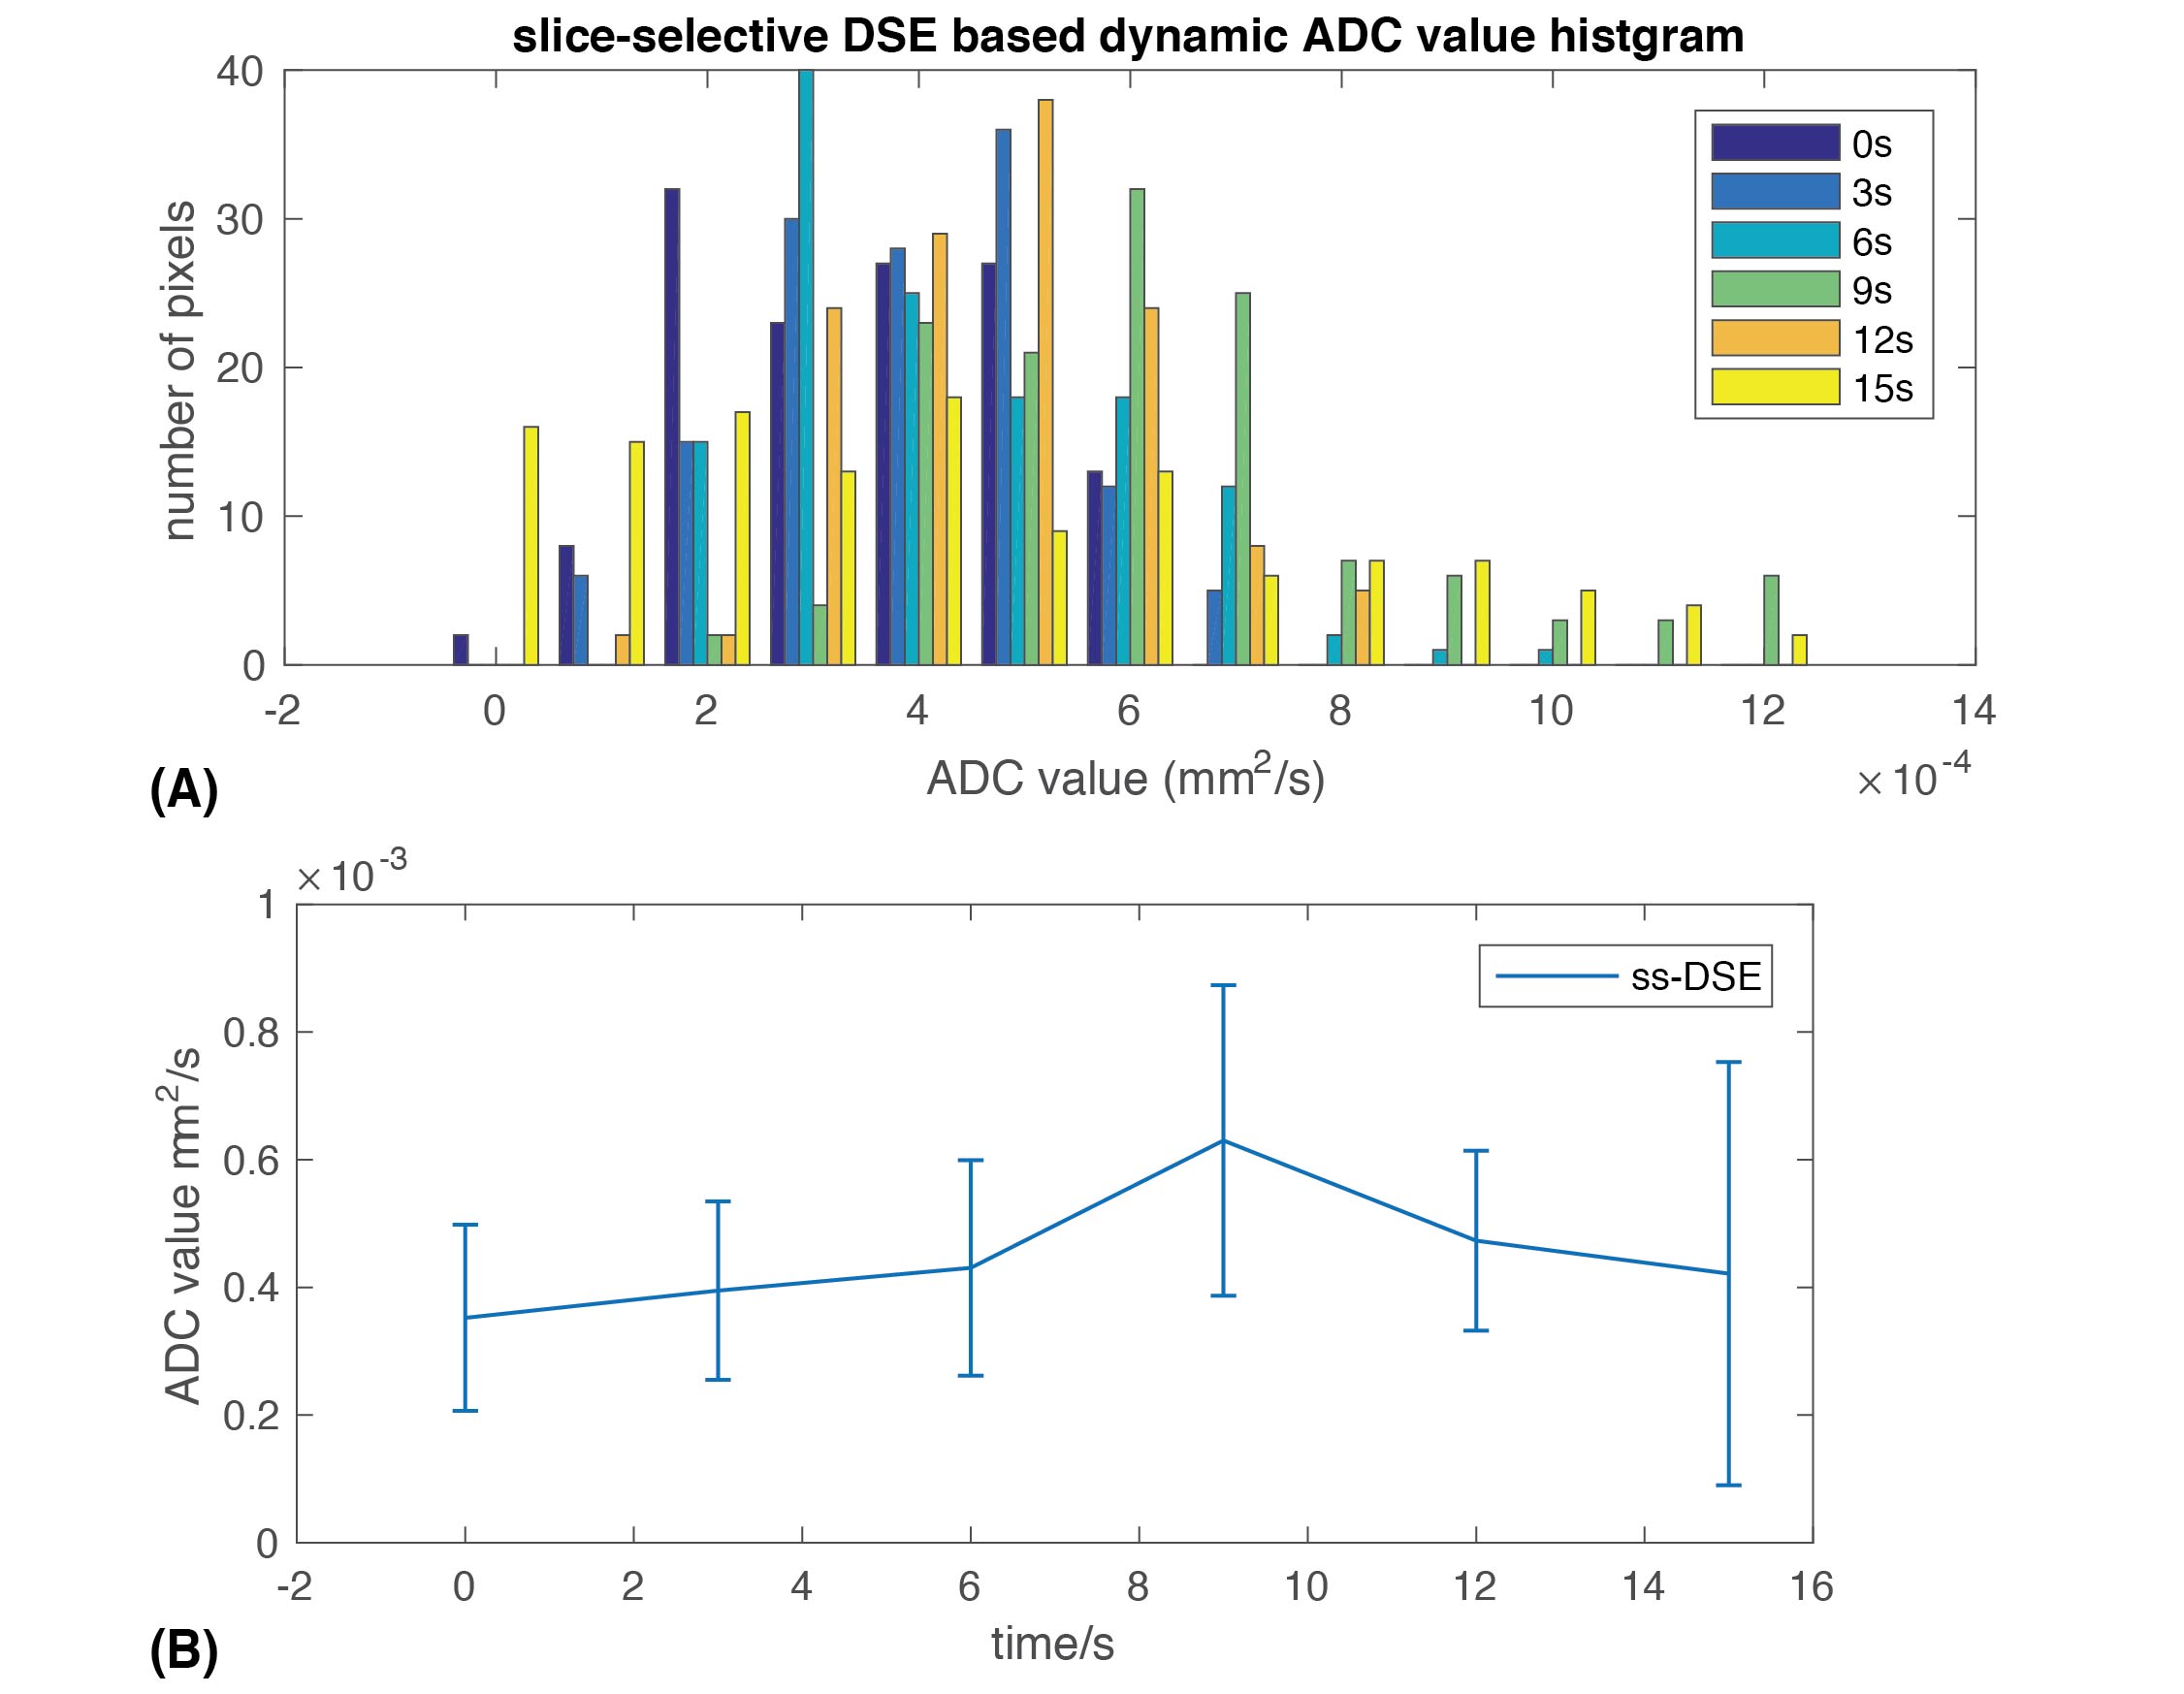
Fig.4 shows the ADC maps of ss-DSE based dynamic DWI. The ADC values we obtained are in good agreement with previous in vivo[7] and ex vivo studies[11,12]. The ADC histogram and average ADC for each time point (Fig. 5) showed a shift of the ADC values from ~0.3*10-3mm2/s at the end of injection to ~0.6*10-3mm2/s 9s after the end of injection. The shift of ADC values is consistent with lactate efflux during the experiment. Initially, most of the lactate transformed from pyruvate is intracellular with a lower ADC value, similar to cell studies[8] that measured an intracellular lactate ADC of ~0.2*10-3mm2/s. Furthermore, these studies measured extracellular lactate ADCs of ~0.6*10-3mm2/s which is similar to the largest ADC values measured. Thus we expect the ADC would increase over time due to lactate efflux from the intracellular to extracellular space.
Conclusion
In this work, we developed an acquisition strategy for dynamic DWI of hyperpolarized metabolites, and applied this for simultaneous measurements of lactate metabolism and efflux. This strategy was achieved with an optimized slice selective DSE sequence, which overcomes the saturation effects of the traditional DSE sequence. Our initial studies on TRAMP mice showed an increase in lactate ADC over time, consistent with increased MCT4 expression and lactate efflux in late-stage prostate cancer. These dynamic ADC changes have potential to improve the assessment of aggressive cancers.Acknowledgements
This work was supported by NIH grants R01EB016741 and P41EB013598. We would like to thank Dr. Peng Cao, Shuyu Tang for discussion.References
[1] Albers, Mark J., et al. "Hyperpolarized 13C lactate, pyruvate, and alanine: noninvasive biomarkers for prostate cancer detection and grading." Cancer research 68.20 (2008): 8607-8615.
[2] Chen, Hsin-Yu, et al. "Assessing Prostate Cancer Aggressiveness with Hyperpolarized Dual-Agent 3D Dynamic Imaging of Metabolism and Perfusion." Cancer Research 77.12 (2017): 3207-3216.
[3] Pértega-Gomes, N., Vizcaíno, J. R., Miranda-Gonçalves, V., Pinheiro, C., Silva, J., Pereira, H., Monteiro, P., Henrique, R. M., Reis, R. M., Lopes, C., & Baltazar, F. (2011) Monocarboxylate transporter 4 (MCT4) and CD147 overexpression is associated with poor prognosis in prostate cancer. BMC Cancer 11, 312.
[4] Kim, Y., Choi, J.-W., Lee, J.-H., & Kim, Y.-S. (2015) Expression of lactate/H⁺ symporters MCT1 and MCT4 and their chaperone CD147 predicts tumor progression in clear cell renal cell carcinoma: immunohistochemical and The Cancer Genome Atlas data analyses. Hum Pathol 46, 104-12.
[5] Witkiewicz, Agnieszka K, Diana Whitaker-Menezes, Abhijit Dasgupta, Nancy J Philp, Zhao Lin, Ricardo Gandara, Sharon Sneddon, Ubaldo E Martinez-Outschoorn, Federica Sotgia, and Michael P Lisanti. “Using The ‘reverse Warburg Effect’ to Identify High-Risk Breast Cancer Patients: Stromal MCT4 Predicts Poor Clinical Outcome in Triple-Negative Breast Cancers.” Cell Cycle 11.6 (2012)
[6] Cunningham, Charles H., et al. "Double spin-echo sequence for rapid spectroscopic imaging of hyperpolarized 13 C." Journal of magnetic resonance 187.2 (2007): 357-362.
[7] Koelsch, Bertram L., et al. "Rapid in vivo apparent diffusion coefficient mapping of hyperpolarized 13C metabolites." Magnetic resonance in medicine 74.3 (2015): 622-633.
[8] Kettunen, Mikko I., et al. "Spin echo measurements of the extravasation and tumor cell uptake of hyperpolarized [1‐13C] lactate and [1‐13C] pyruvate." Magnetic resonance in medicine70.5 (2013): 1200-1209.
[9] Josan, Sonal, et al. "Application of double spin echo spiral chemical shift imaging to rapid metabolic mapping of hyperpolarized [1− 13 C]-pyruvate." Journal of Magnetic Resonance 209.2 (2011): 332-336.
[10] Gordon, Jeremy W., et al. "Mis‐estimation and bias of hyperpolarized apparent diffusion coefficient measurements due to slice profile effects." Magnetic resonance in medicine 78.3 (2017): 1087-1092.
[11] Koelsch, Bertram L., et al. "Separation of extra-and intracellular metabolites using hyperpolarized 13 C diffusion weighted MR." Journal of Magnetic Resonance 270 (2016): 115-123.
[12] Sriram, Renuka, et al. "Real‐time measurement of hyperpolarized lactate production and efflux as a biomarker of tumor aggressiveness in an MR compatible 3D cell culture bioreactor." NMR in Biomedicine 28.9 (2015): 1141-1149.
[13] Xucheng Zhu, et al. ISMRM 2017, Abstract #3688.
Figures