0903
A Continuum of Components: Robust Parameter Mapping in Sodium MRI1Dept. of Biomedical Engineering, The University of Melbourne, Melbourne, Australia, 2Melbourne Brain Centre Imaging Unit, The University of Melbourne, Melbourne, Australia
Synopsis
Bi-exponential models of T2*-weighted sodium data are prone to producing noisy parameter maps and low contrast between brain tissue types. Further, inherently low SNR has, to this point, necessitated a constant fast fraction weight. Here, a continuum model of sodium T2*-decay is introduced and applied to in vivo human multi-echo 7T data, producing high quality, high contrast parameter maps, and informative voxelwise estimates of the relative weighting between fast and slow decay components.
Introduction
The estimation of $$$T_2^*$$$ from multi-echo sodium MRI data is challenging, both due to the low SNR of sodium images, and sodium's quadupolar spin which results in tissue structure-dependent fast and slow signal decay fractions. Typically a bi-exponential (BE) model is fit with the fast and slow fractions set to a constant 60/40 ratio1,2. Recently, we presented 3D-MERINA for efficient multi-echo acquisition$$$^3$$$, and along with this sequence proposed a bi-exponential mixture (BEM) approach to fitting the decay model. The BEM approach is a two-step procedure, firstly fitting a BE model, again constrained to the 60/40 ratio in brain tissue, and secondly replacing the BE with a mono-exponential (ME) fit in regions found to be implausible for a two-component BE fit, namely CSF. Both the BE and BEM approaches result in parameter maps that fail to clearly differentiate between white matter (WM) and gray matter (WM), and suffer from a low contrast, noisy, speckled appearance.
In this work, rather than forcing the bi-exponential decay model to maintain the 60/40 ratio between fast and slow decay components, we employ a continuum model of $$$T^*_2$$$ decay, based on the premise that sodium exists in the brain in heterogeneous states within localised environments. Our approach makes three key contributions to 23NA-MRI parameter mapping: 1) The continuum model produces $$$T^*_2$$$ maps with vastly superior tissue contrast and noise properties. 2) Parameter estimation is a robust one-step procedure that avoids the use of mixture models. 3) Estimates of the fast and slow component fractions are emergent from the inferred continuum models. Indeed, our in vivo human experimental results support the 60/40 split on average in brain tissue, while permitting localised variation that offers richer information than the constrained alternatives.
Methods
Continuum Signal Model: Following the approach of Layton et al.$$$^4$$$, and similar to the popular NNLS algorithm for $$$T_2$$$ estimation$$$^5$$$, we propose a continuum model of heterogeneous molecular environments. Our model uses a gamma (GA) probability distribution over $$$R_2^*$$$, parameterised by $$$k$$$ and $$$\theta$$$. The signal at echo time $$$TE$$$ is the integral over all components,
$$M(t;\, k,\theta)=\int M_0\,e ^{-TE\,R^*_2 }\,p(R^*_2)\,dR^*_2 = M_0 (1+\theta t)^{-k}.$$
The $$$T_{2,GA}^*$$$ parameter estimates are given by the reciprocal of the mean rate, $$$R^*_{2\,GA}=k\,\theta$$$.
The fast component fraction, $$$f_{fast}$$$, is defined to be the area under the $$$T_2^*$$$ pdf up to a threshold $$$T_2^*$$$ value, taken here to be 15ms. Thus $$$f_{fast}$$$ consolidates the contribution of the continuum of fast components below 15ms.
Experiments
Imaging was performed on a research 7T MRI scanner (Siemens Healthcare, Erlangen, Germany) with a transmit/receive dual-tuned $$$^1$$$H-$$$^{23}$$$Na head coil (QED, USA). $$$^{23}$$$NA-MRI was performed on four healthy volunteers with 3D-MERINA acquisition3. TR=160ms, initial echo time TE1=400µs, TRO=2ms, 38 echoes, FOV=20cm, 3.1mm isotropic resolution and N=10,000 projections.
Parameter Estimation
Maximum Likelihood estimation using the Rician noise model6 for magnitude data was carried out in MATLAB using constrained nonlinear optimization. BEM parameter maps of $$$T_{2\,short}^*$$$ and $$$T_{2\,long}^*$$$ components were generated, along with $$$T_{2\,GA}^*$$$ maps from our GA model. For each dataset, separate masks for WM, GM and CSF were created (see Blunck et al3 for masking details).
Results and Discussion
Model Estimation
WM, GM and CSF data is well-fit by BEM and GA models (Fig.1a). The sensitivity of the continuum GA approach to the underlying tissue structure is evidenced by the distinct gamma distribution shapes that are inferred for each tissue type (Fig.1b).
Parameter Maps
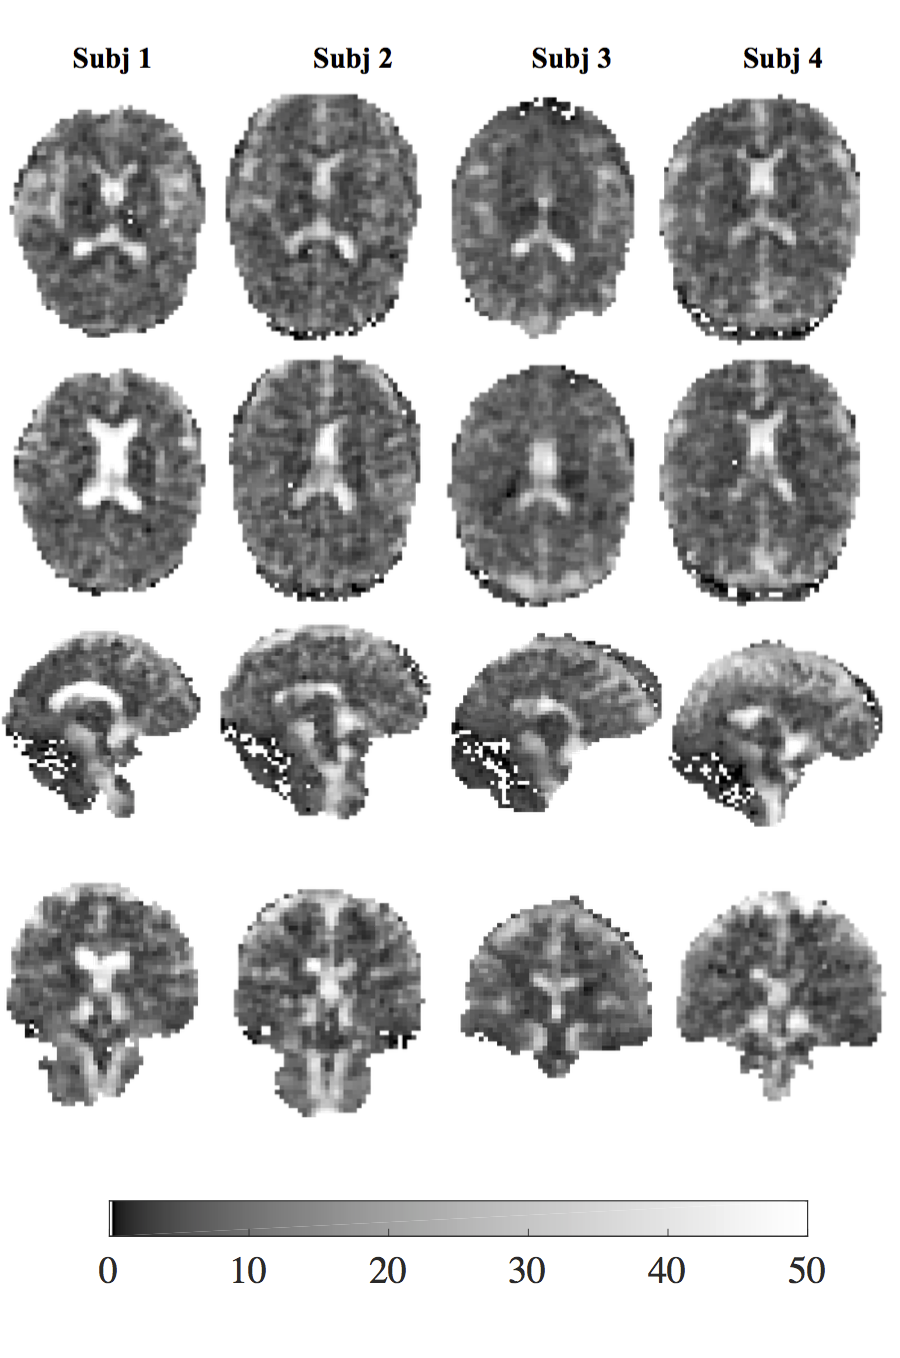
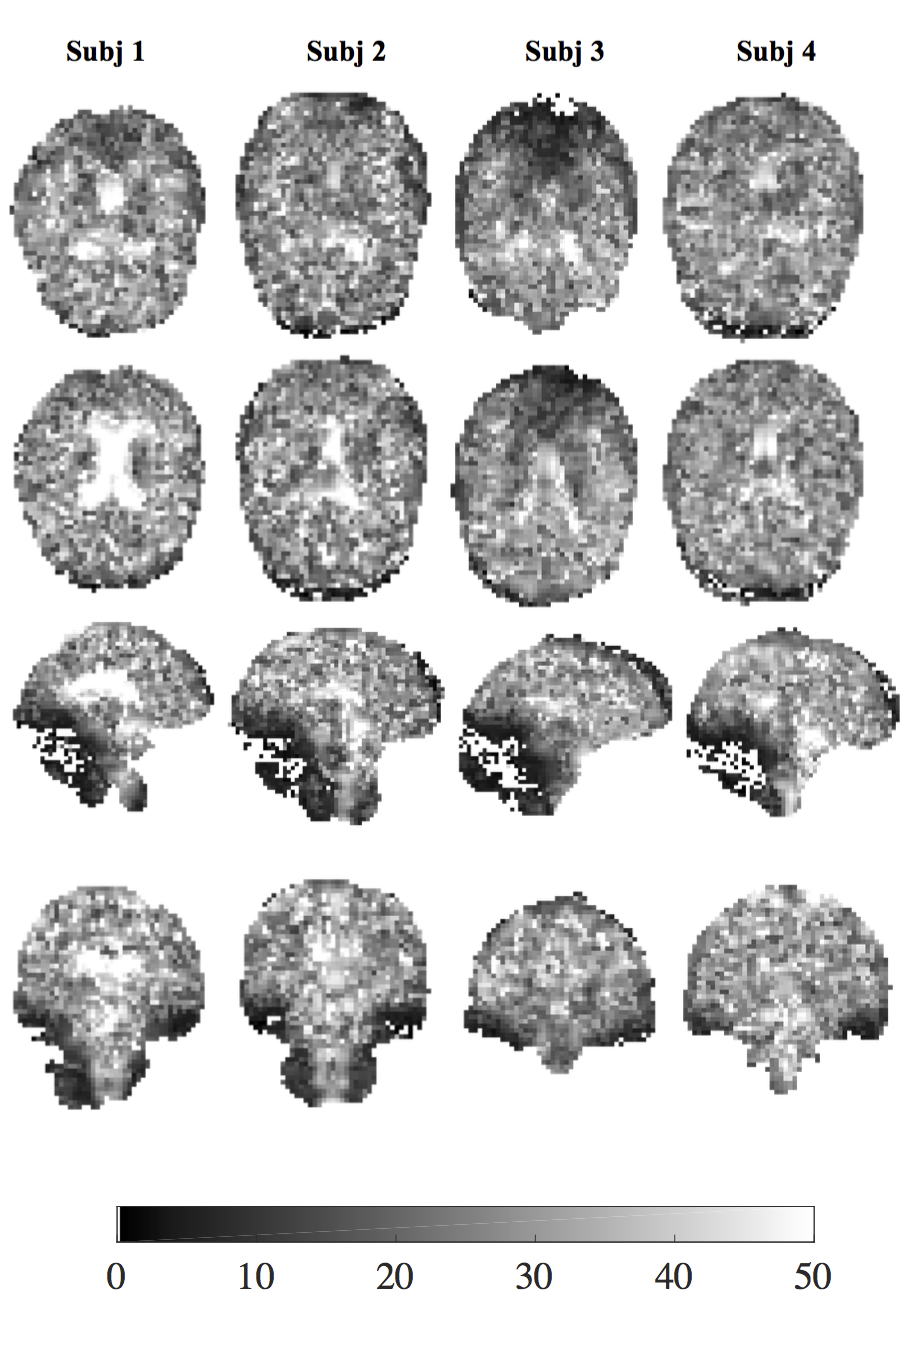
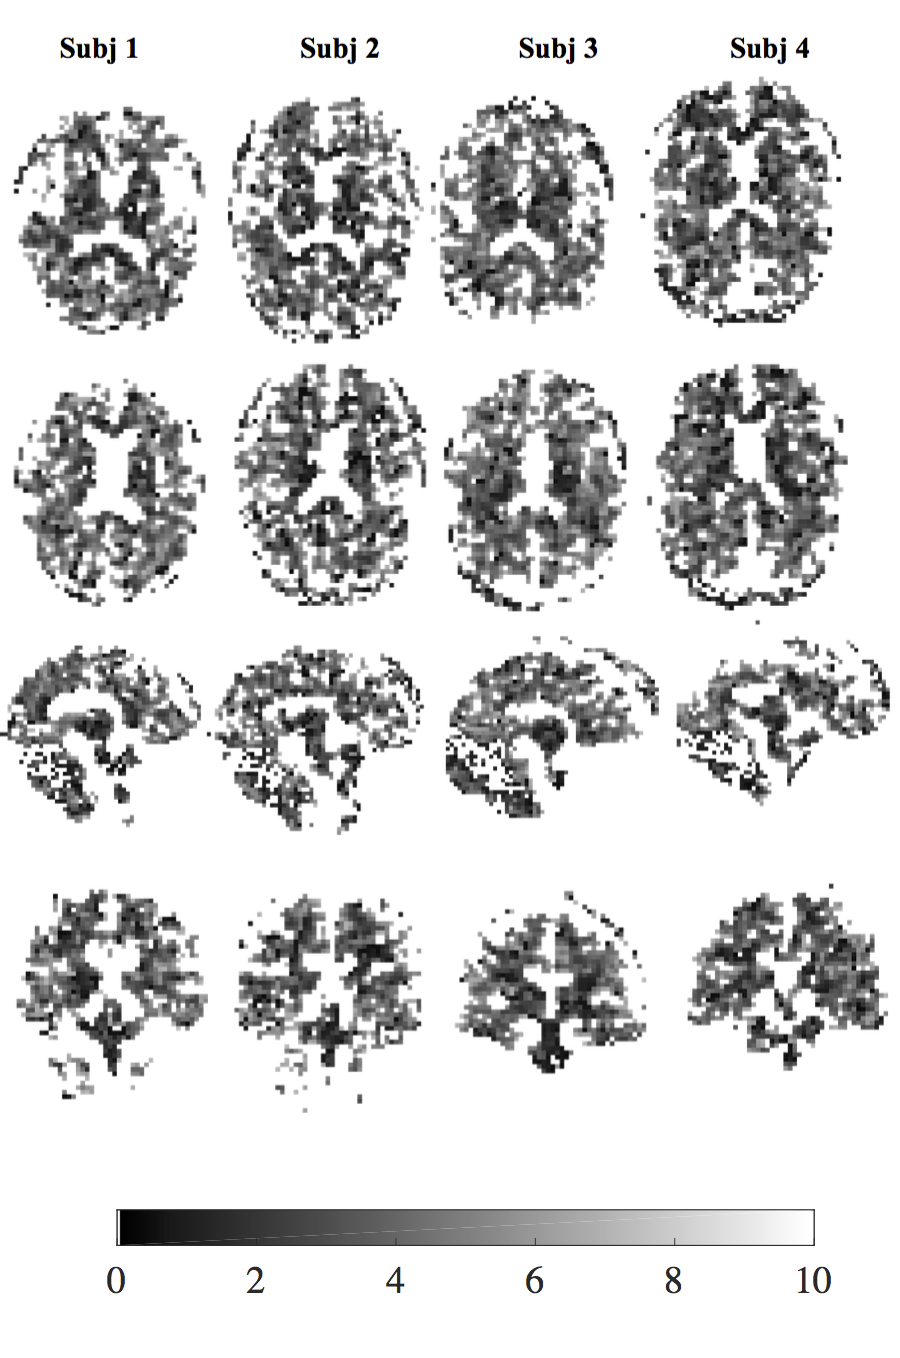
The $$$T^*_{2,GA}$$$ maps provide superior contrast between GM, WM and CSF regions (Fig.2) than the BME model (Figs.3-4), that only distinguish between CSF and tissue regions. The $$$T^*_{2,GA}$$$ maps are less speckled, delineating structural detail in tissue.
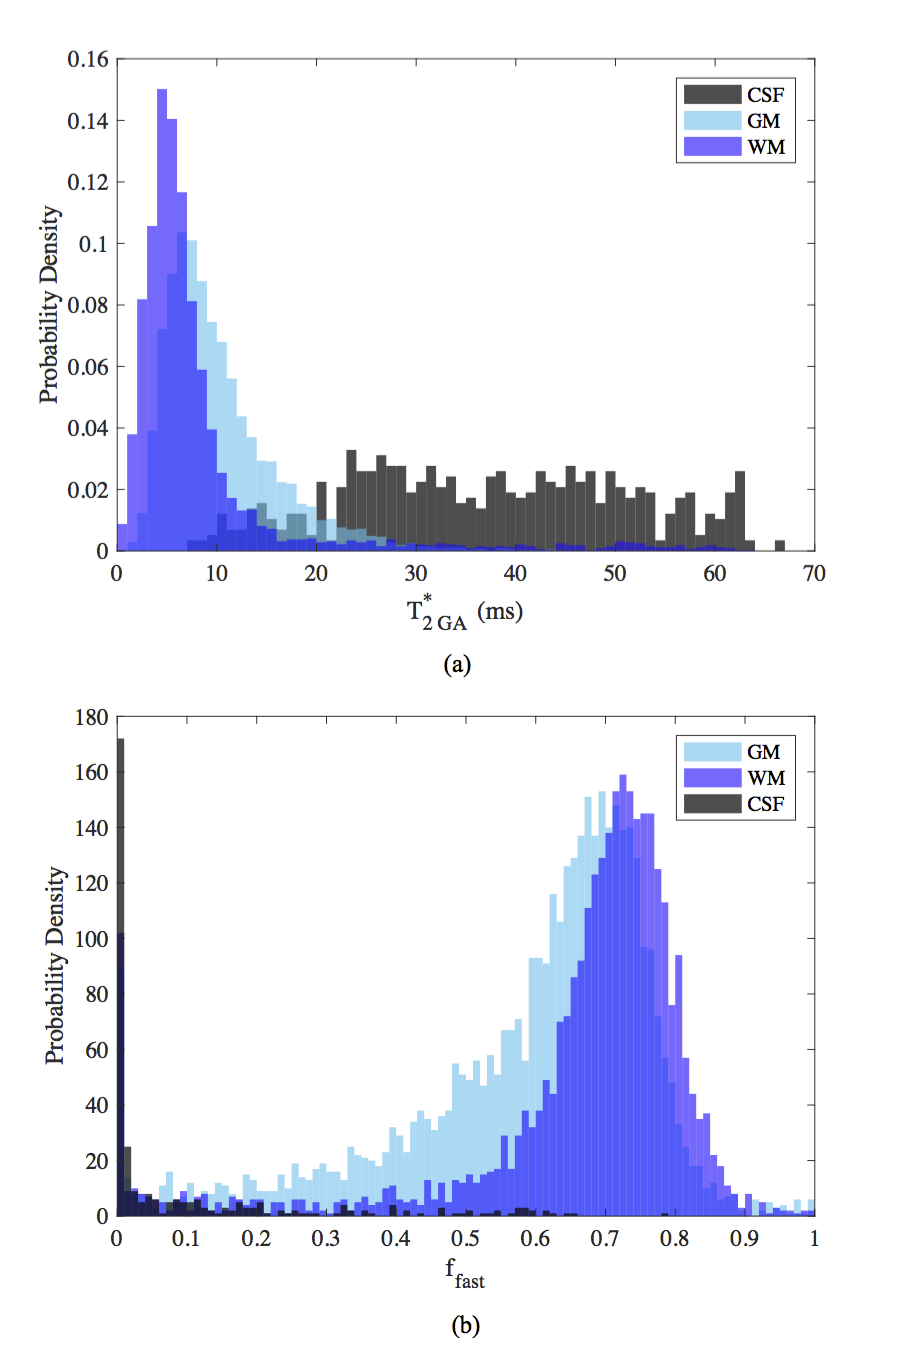
The single-voxel data of Fig.1 is supported by whole brain data (Fig.5a), with a broad slow decay distribution in CSF and two distinct peaks in WM and GM. As expected, the WM distribution has a smaller average $$$T^*_{2,GA}$$$. The tissue-based ranges of $$$T_{2,GA}^*$$$ show good agreement with previously reported values in literature7.
Remarkably, the fast fraction, $$$f_{fast}$$$, estimated from the GA distribution complies with the expected contribution of fast decay in CSF with a peak at 0, and in brain tissue with peaks centred around 0.6-0.7.
Conclusion
The proposed continuum model of the $$$T_2^*$$$-weighted sodium signal produces high contrast and high SNR parameter maps in a single step estimation procedure. Furthermore, unconstrained estimates of fast and slow component fractions are produced, obviating the need for constraints that were necessary in previous methods based on bi-exponential models of the sodium decay signal. We encourage analysis of multi-echo sodium images using the gamma continuum model, as the algorithm is simple to implement and the resultant parameter maps are both robust and easily interpretable.Acknowledgements
We acknowledge the facilities and the scientific and technical assistance of the Australian National Imaging Facility at the Melbourne Brain Centre Imaging Unit. The Australian National Imaging Facility is funded by the Australian Government NCRIS program. The work was also supported by a research collaboration agreement with Siemens Healthcare.References
1. Bartha, R. and Menon, R. S. (2004), Long component time constant of 23Na T2 relaxation in healthy human brain. Magn. Reson. Med., 52: 407–410. doi:10.1002/mrm.20144
2. Hubbard, P. S. (1970). Nonexponential nuclear magnetic resonance by quadrupole interactions. J Chem Phys, 53, 985-987.
3. Blunck, Y., Josan, S., Taqdees, S. W., Moffat, B. A., Ordidge, R. J., Cleary, J. O. and Johnston, L. A. (2017), 3D-multi-echo radial imaging of 23Na (3D-MERINA) for time-efficient multi-parameter tissue compartment mapping. Magn. Reson. Med. doi:10.1002/mrm.26848
4. Layton, K. J., Morelande, M., Wright, D., Farrell, P. M., Moran, B., & Johnston, L. A. (2013). Modelling and estimation of multicomponent T2 distributions. IEEE Transactions on Medical Imaging, 32(8), 1423–1434.
5. Whittall, K. P., MacKay, A. L. (1989). Quantitative interpretation of NMR relaxation data. J Magn Reson, 84, 134–152.
6. Bouhrara, M., Reiter, D. A., Celik, H., Bonny, J. M., Lukas, V., Fishbein, K. W., & Spencer, R. G. (2015). Incorporation of Rician noise in the analysis of biexponential transverse relaxation in cartilage using a multiple gradient echo sequence at 3 and 7 Tesla. Magn. Reson. Med., 73(1), 352–366.
7. Madelin, G., Lee, J., Regatte, R. R., Jerschow, A. (2014). Sodium MRI: Methods and applications. Progress in Nuclear Magnetic Resonance Spectroscopy, 79, 14-47.
Figures
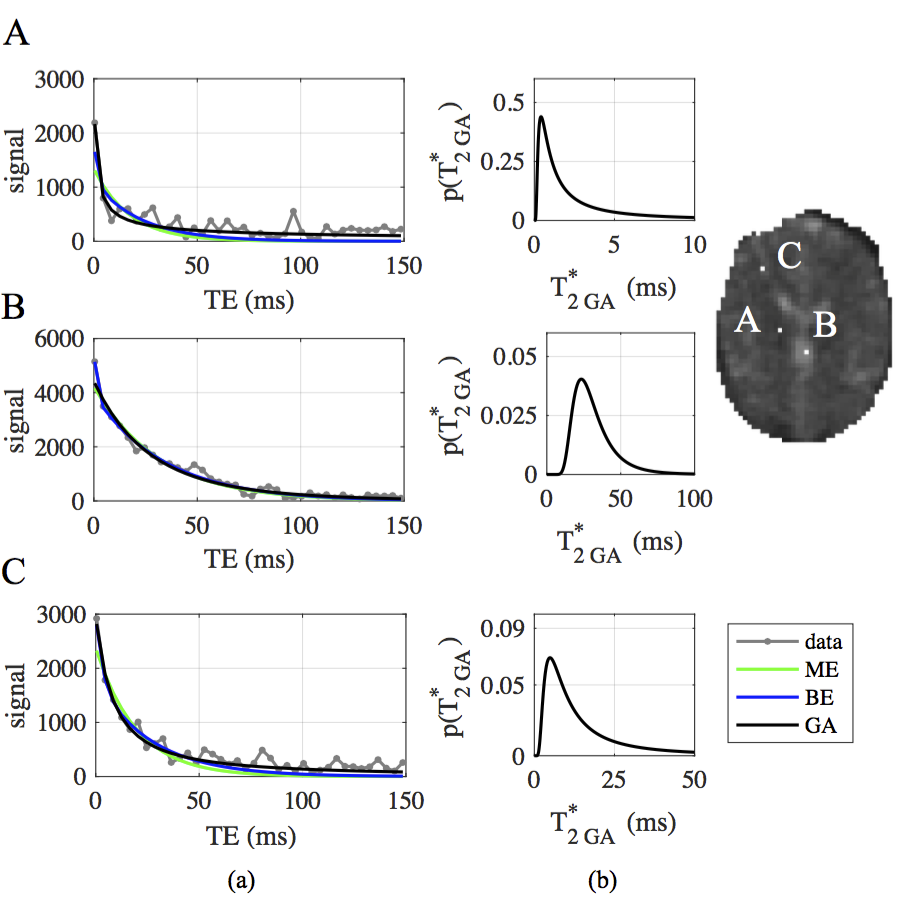
Figure 1: (a) Single voxel data (gray), overlaid with curve-fits from monoexponential (ME, green), bi-exponential (BE, blue) and gamma (GA, black) models, and (b) corresponding gamma pdfs in A) WM, B) CSF, C) GM.