0901
Machine learning classification of Parkinson’s disease using brainstem MRI and demographic features1Neurology, Emory University School of Medicine, Atlanta, GA, United States, 2Biomedical Informatics, Emory University School of Medicine, Atlanta, GA, United States, 3Center for Advanced Neuroimaging, University of California Riverside, Riverside, CA, United States, 4Biomedical Engineering, Emory University School of Medicine, Atlanta, GA, United States, 5Bioengineering, University of California Riverside, Riverside, CA, United States
Synopsis
Objective biomarkers for Parkinson’s disease (PD) are needed, and a PD MRI diagnostic could have high impact in clinical and research applications. 3T MRI sequences sensitive to neuromelanin loss and iron accumulation in substantia nigra pars compacta and locus coeruleus robustly detect PD effects. We hypothesized that a multivariate MRI classifier can differentiate PD from controls with high accuracy. A machine learning classifier was developed using data from PD and controls (n=67) with brainstem MRI and demographic features as model inputs. Using 5-fold cross-validation the model demonstrated 86% accuracy, which is in a clinically useful range and warrants further development.
Introduction
Parkinson’s disease (PD) selectively damages pigmented catecholamine neurons in locus coeruleus (LC) and substantia nigra pars compacta (SNc). Each of these structures undergoes profound neurodegeneration in PD, which is accompanied by neuromelanin loss as well as the accumulation of iron.[1-3] In previous work we have shown that at 3T neuromelanin-sensitive MRI (NM-MRI) and iron-sensitive T2-weighted MRI pulse sequences robustly detect PD effects.[4,5] There is currently an unmet need for neuroimaging biomarkers to assist PD diagnosis both clinically and in research. Because 3T MRI detects multiple features of disease biology in multiple regions of interest (ROIs) a multivariate classifier may be useful to accurately classify PD. Here we set out to determine whether a machine learning classification model incorporating MRI features of PD brainstem pathology can accurately differentiate PD patients from controls. The MRI methods used include automated image processing methods to facilitate translational application of biomarkers developed with this approach.Methods
MRI, clinical and demographic data were collected from 67 individuals (36 PD and 31 control) under an IRB approved protocol with informed, written consent in accordance with the Declaration of Helsinki. PD subjects met U.K. Brain Bank Criteria for PD diagnosis as assessed by a fellowship-trained movement disorders neurologist, and all PD subjects had an ON-medications Unified Parkinson’s Disease Rating Scale Part III (UPDRS-III) motor score of 25 or less.[6] Baseline clinical features of both groups are shown in Table 1.
Participants were scanned using a Siemens Prisma-Fit 3T MRI scanner with a 64 channel receive-only head coil. NM-MRI data was acquired using a 2-D gradient echo sequence with a reduced flip-angle magnetization transfer preparation pulse (300°, 1.2 kHz off-resonance, 10 ms duration), TE/TR = 3.10/354, 15 contiguous slices, 416x512 imaging matrix, voxel size 0.39x0.39x3 mm3, seven measurements, flip angle = 40°, 470 Hz/pixel receiver bandwidth, and scan time of 17 minutes 12 seconds.[7] Image processing to determine LC volume and SNc volume was carried out using an automated approach previously shown to have high scan-rescan reproducibility.[7,8] R2* data was acquired using a conventional multi-echo gradient echo sequence with 4 echoes spaced equally (see citation for parameters).[9] R2*, which is sensitive to iron accumulation, was measured in the NM-MRI defined SNc using a published method.[5,10] This method leverages a standard space SNc atlas developed using control population NM-MRI data, enabling R2* measurement in SNc with no operator-dependent segmentation steps.
We used a machine learning approach, applying a logistic regression model to develop a multivariate classifier to differentiate PD patients from controls. We included 1) SNc volume (NM-MRI), 2) LC volume (NM-MRI), 3) SNc R2*, and demographic features (age, gender) as inputs in the model. We limited the number of features included to these five and used 5-fold cross-validation to prevent overfitting. Receiver operating characteristic (ROC) analysis was performed and area under the curve (AUC) was determined in order to assess the accuracy of the classification model. During the sweep of the model parameters, we calculated the proportion of models for which a given parameter was non-zero. This measurement reflects the "importance" of a biomarker in predicting PD. The relative importance of the biomarkers was compared using one-way analysis of variance (ANOVA). Post-hoc comparison with the Tukey-Kramer procedure was used to compare the importance of the parameters included in the model.
Results
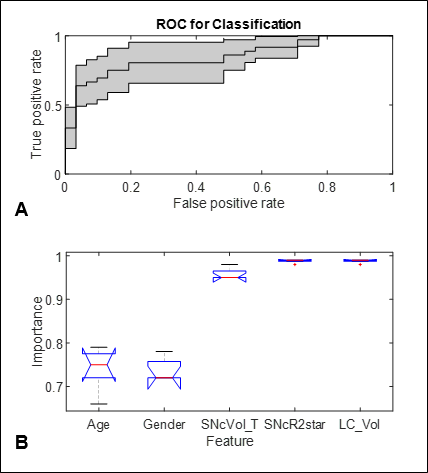
The AUC for the multivariate classification model is shown in Figure 1A. The central thin black line is the mean ROC, and the grey patch is the confidence interval from 5-fold cross-validation. The average AUC was 0.8557± 0.0832 (95% confidence interval). ANOVA comparing the relative importance of the features in the model found a statistically significant difference in importance among these biomarkers: age, gender, and three MRI measures (p-value < 0.001). Post-hoc comparison found that the MRI measures, SNc volume, SNc R2*, and LC volume, were significantly more important than the demographic biomarkers, age and gender, as shown in Figure 1B. Boxplots show the range and quartiles of the importance measurement. Non-overlapping notches indicate significant difference.Discussion
Machine learning classification using multi-variate logistic regression yielded a classifier model with 86% accuracy. This accuracy in discriminating early to moderate PD from controls is in a range that is clinically useful, and it is comparable to that of 123I-ioflupane SPECT (DATScanTM, General Electric), the only imaging modality currently FDA-approved to assist PD diagnosis.[11,12]Conclusion
This multivariate model is a promising candidate PD biomarker and warrants further development. It has potential for application to assist clinical diagnosis and in subject selection for PD clinical trials.Acknowledgements
This research was supported in part by the Michael J. Fox Foundation (MJF10854).References
1. Zucca FA, Segura-Aguilar J, Ferrari E, et al. Interactions of iron, dopamine and neuromelanin pathways in brain aging and Parkinson's disease. Prog Neurobiol 2017;155:96-119.
2. Zarow C, Lyness SA, Mortimer JA, Chui HC. Neuronal Loss Is Greater in the Locus Coeruleus Than Nucleus Basalis and Substantia Nigra in Alzheimer and Parkinson Diseases. Arch Neurol 2003;60:337-341.
3. Fearnley JM, Lees AJ. Ageing and Parkinson's disease: substantia nigra regional selectivity. Brain 1991;114:2283 - 2301.
4. Langley J, Huddleston DE, Sedlacik J, Boelmans K, Hu XP. Parkinson's disease-related increase of T2*-weighted hypointensity in substantia nigra pars compacta. Mov Disord 2017;32:441-449.
5. Huddleston DE, Langley J, Sedlacik J, Boelmans K, Factor SA, Hu XP. In vivo detection of lateral-ventral tier nigral degeneration in Parkinson's disease. Hum Brain Mapp 2017;38:2627-2634.
6. Hughes A, Daniel S, Kilford L, Lees A. Accuracy of clinical diagnosis of idiopathic Parkinson's disease: a clinico-pathological study of 100 cases. J Neurol Neurosurg Psychiatry 1992;55:181-184.
7. Langley J, Huddleston DE, Liu CJ, Hu X. Reproducibility of locus coeruleus and substantia nigra imaging with neuromelanin sensitive MRI. MAGMA 2017;30:121-125.
8. Chen X, Huddleston DE, Langley J, et al. Simultaneous imaging of locus coeruleus and substantia nigra with a quantitative neuromelanin MRI approach. Magnetic resonance imaging 2014.
9. Barbosa JH, Santos AC, Tumas V, et al. Quantifying brain iron deposition in patients with Parkinson's disease using quantitative susceptibility mapping, R2 and R2. Magnetic resonance imaging 2015;33:559-565.
10. Langley J, Huddleston DE, Merritt M, et al. Diffusion tensor imaging of the substantia nigra in Parkinson's disease revisited. Hum Brain Mapp 2016;37:2547-2556.
11. Bajaj N, Hauser RA, Grachev ID. Clinical utility of dopamine transporter single photon emission CT (DaT-SPECT) with (123I) ioflupane in diagnosis of parkinsonian syndromes. J Neurol Neurosurg Psychiatry 2013;84:1288-1295.
12. Kagi G, Bhatia KP, Tolosa E. The role of DAT-SPECT in movement disorders. J Neurol Neurosurg Psychiatry 2010;81:5-12.
Figures