0899
Machine learning and rapid multi-parametric relaxometry can differentiate demyelinating disorders with high accuracy1NeuroPoly Lab, Institute of Biomedical Engineering, Polytechnique Montreal, Montreal, QC, Canada, 2Athinoula A. Martinos Center for Biomedical Imaging, MGH, Charlestown, MA, United States, 3Department of Clinical Neuroscience, Karolinska Institutet, Stockholm, Sweden, 4Department of Radiology, Division of Neuroradiology, Karolinska University Hospital, Stockholm, Sweden, 5Department of Neurology, Karolinska University Hospital, Stockholm, Sweden, 6Center for Medical Imaging Science and Visualization, CMIV, Linköping, Sweden, 7SyntheticMR, Linköping, Sweden, 8Montreal Health Institute, Montreal, QC, Canada, 9Harvard Medical School, Boston, MA, United States, 10Functional Neuroimaging Unit, CRIUGM, Université de Montréal, Montreal, QC, Canada
Synopsis
Hereditary diffuse leukoencephalopathy with spheroids (HDLS) and multiple sclerosis (MS) are both demyelinating and neurodegenerative disorders that can be hard to distinguish clinically and radiologically. Here, we present a machine learning method that relies on rapid multi-parametric relaxometry and volumetry to achieve a robust classification of HDLS vs. MS. Linear discriminant analysis was shown to be a favorable approach compared to non-linear options. A leave-one-out cross-validation show a detection rate of 100% and 0% false positives for both conditions, which suggests that computer-assistance maybe helpful in accurately diagnosing these disorders.
Purpose
Hereditary diffuse leukoencephalopathy with spheroids (HDLS) and multiple sclerosis (MS) are two disorders that are both characterized by demyelination, axonal loss, neurodegeneration and scarring, making them sometimes hard to distinguish clinically and with conventional imaging.1 HDLS can therefore be misdiagnosed as primary progressive MS due to their clinical and radiological similarities.2,3 There are, however, differences in the pathophysiology and the degree of tissue disruption in MS and HDLS.4 Non-invasively quantifying these underlying differences with MRI could thus be helpful in improving the differential diagnostics and subsequent guidance of treatment since MS immunomodulatory treatment has indication to treat MS but not HDLS. Here, we present a machine learning based method that relies on simple tissue quantification and volumetry to achieve a robust differentiation between HDLS and MS.Methods
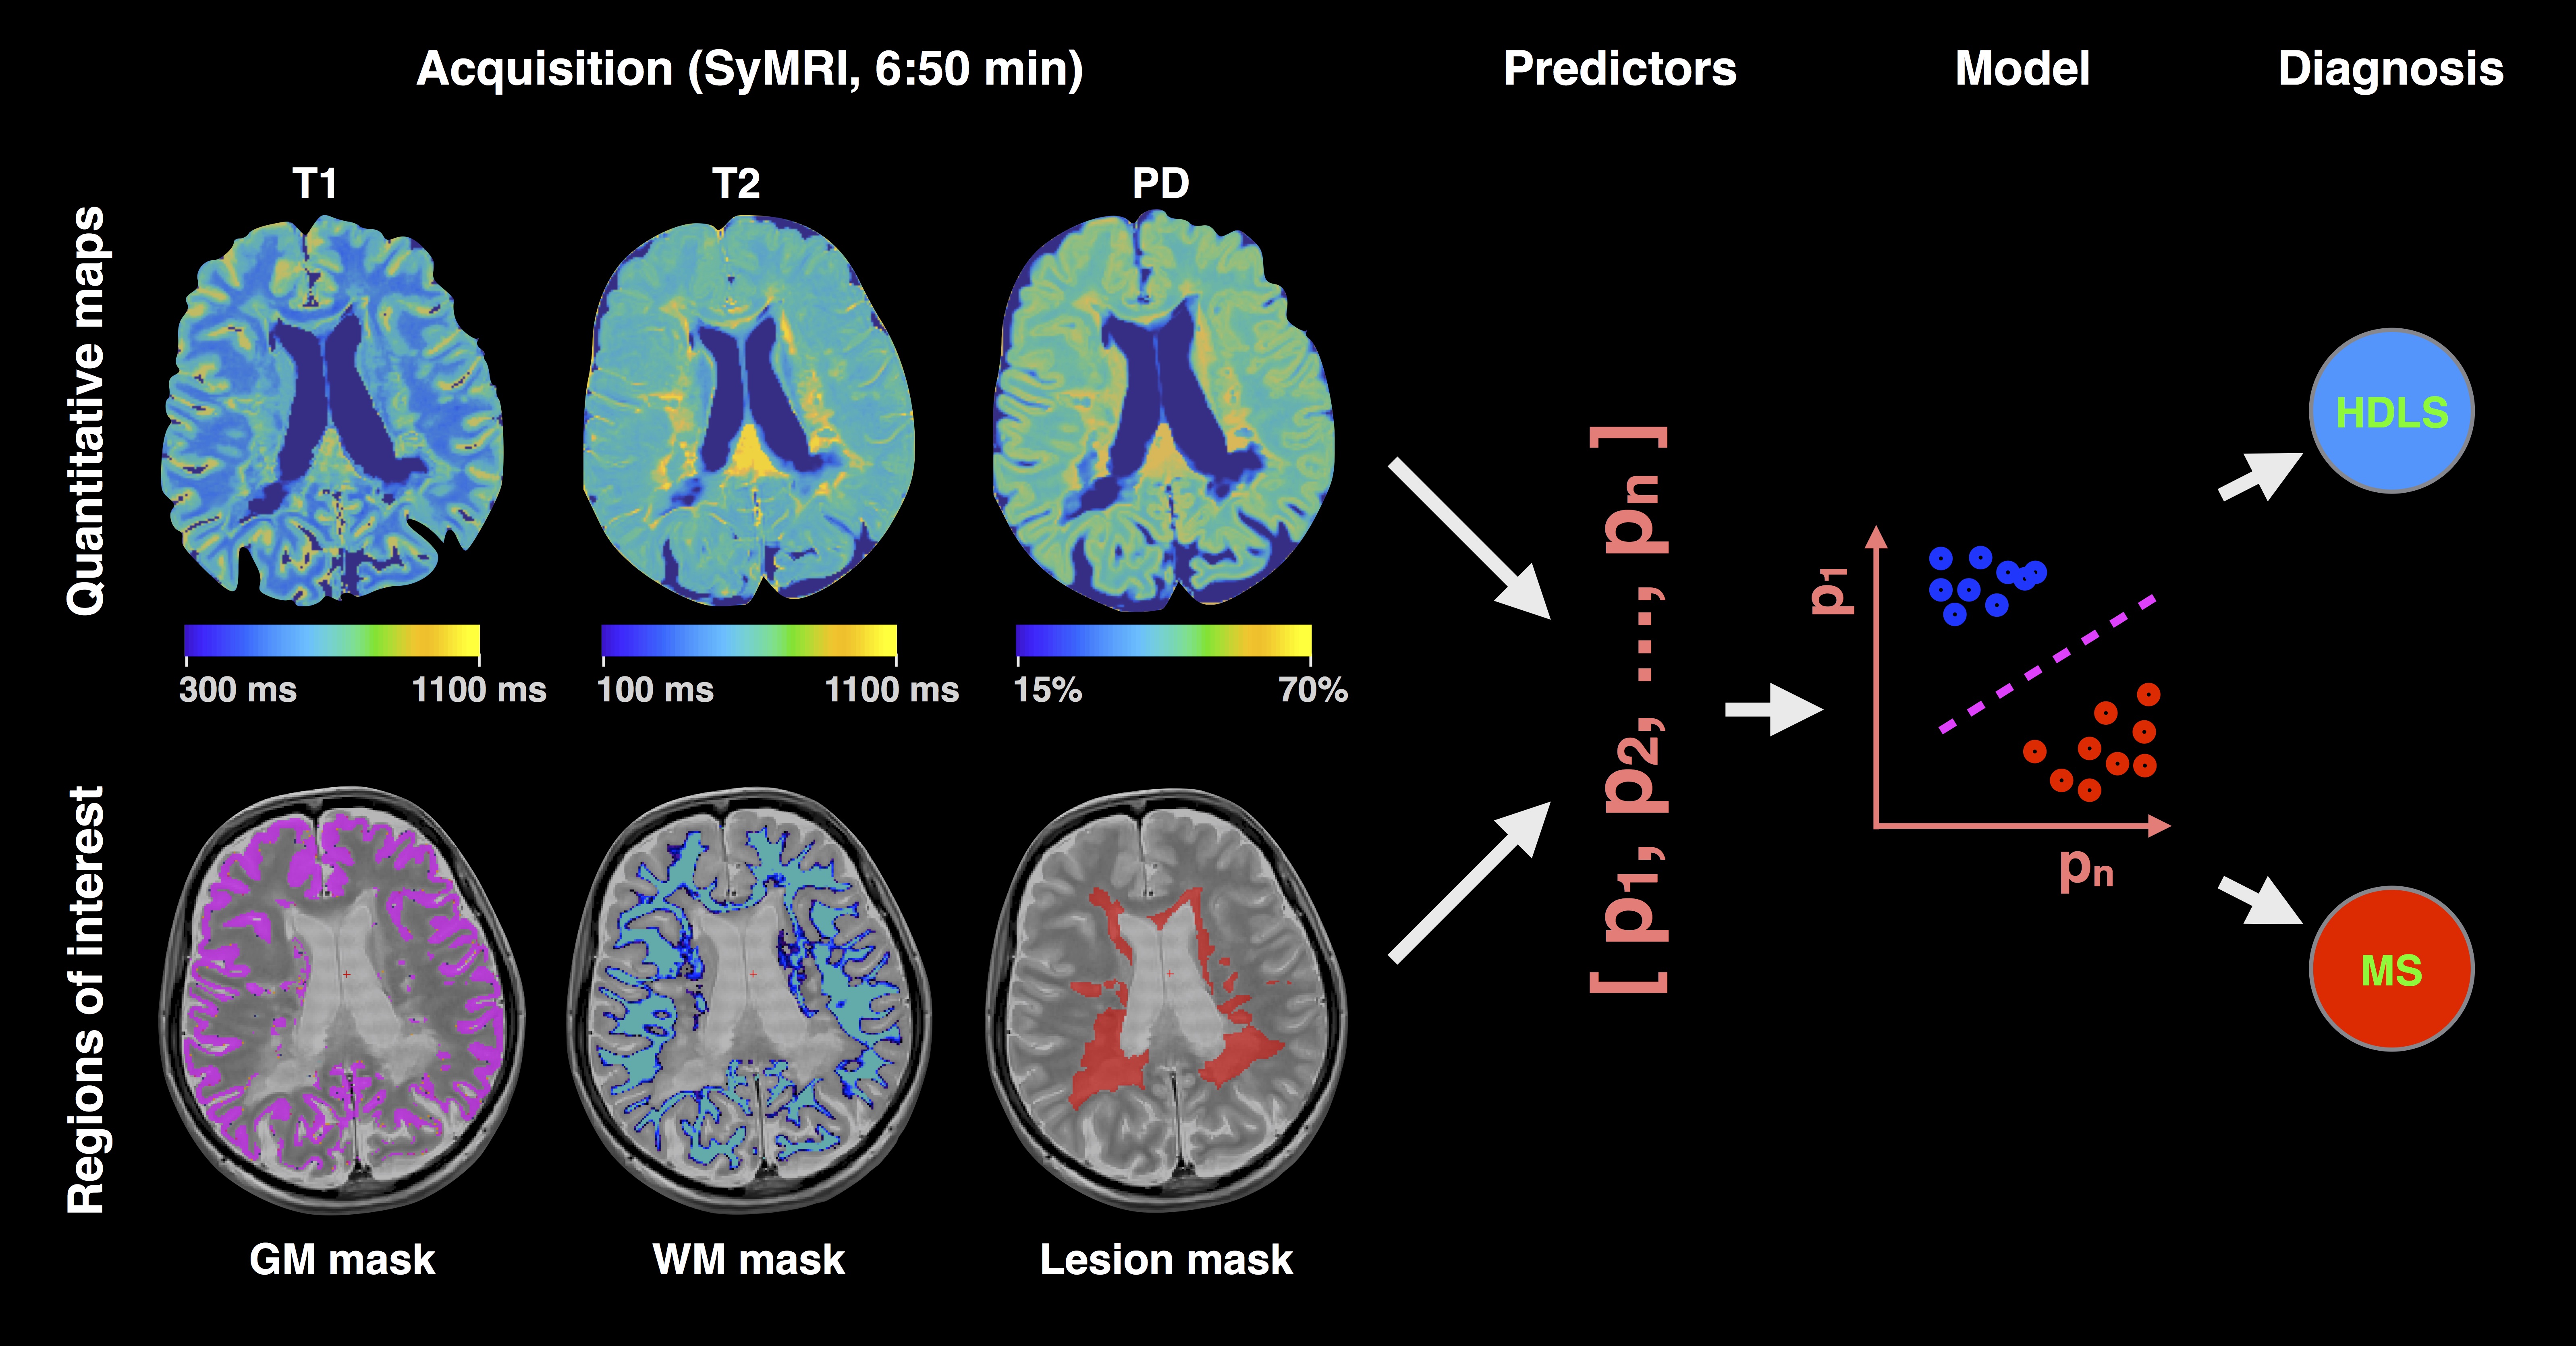
Data acquisition: In this prospective study, we enrolled 14 healthy controls (age 40±14 years, 7 females), 14 MS patients (age 50±9 years, 11 females; 1 primary progressive MS, 4 relapsing-remitting MS, 9 secondary progressive MS, median Expanded disability status scale (EDSS) score 3.75, range 1-8.5) and 4 HDLS patients (age 50±5 years, 2 females). All participants underwent imaging with a Siemens Trio 3.0 T scanner (Siemens Healthcare, Erlangen, Germany) using a saturation-recovery turbo spin echo sequence and a 12-channel head coil. Acquisition parameters were: 30 axial slices, resolution 0.9x0.9x4.0 mm3, flip angle 120°; repetition time 4260 ms; echo times 22 and 100 ms; 4 averages (150/580/2000/4130 ms effective inversion times); GeneRalized Autocalibrating Partial Parallel Acquisition (GRAPPA) factor 2; acquisition time 6:50 min.5 The software SyMRI 7.2RC was used to fit the quantitative PD, T1 and T2 maps. Since these maps are based on the same acquisition, they are inherently aligned.
Tissue masks: Grey matter (GM), white matter (WM) and cerebrospinal fluid (CSF) masks were automatically generated with SyMRI 7.2RC based on the combination of the quantitative T1, T2 and PD maps.6 Lesion masks in patients were segmented by an experienced rater (T.G.) based on synthetic T2-weighted FLAIR and PD-, T1- and T2-weighted images.
Classification: A Linear Discriminant Analysis (LDA) was chosen to perform the classification task.7 Other nonlinear methods such as quadratic discriminant analysis and random forest classification trees were tested, but the nonlinearities led to an overfitting of the training dataset, inducing larger cross-validation errors. The predictors of the LDA were: GM, WM and lesion volumes, PD, T1, T2, R1 and R2.
Validation: Both leave-one-out and leave-two-out bootstrap analyses were used to cross-validate the classifications. Moreover, confusion matrices were used to assess the robustness of the classifications. Figure 1 shows an example of the acquired data and summarizes the methodology.
Results
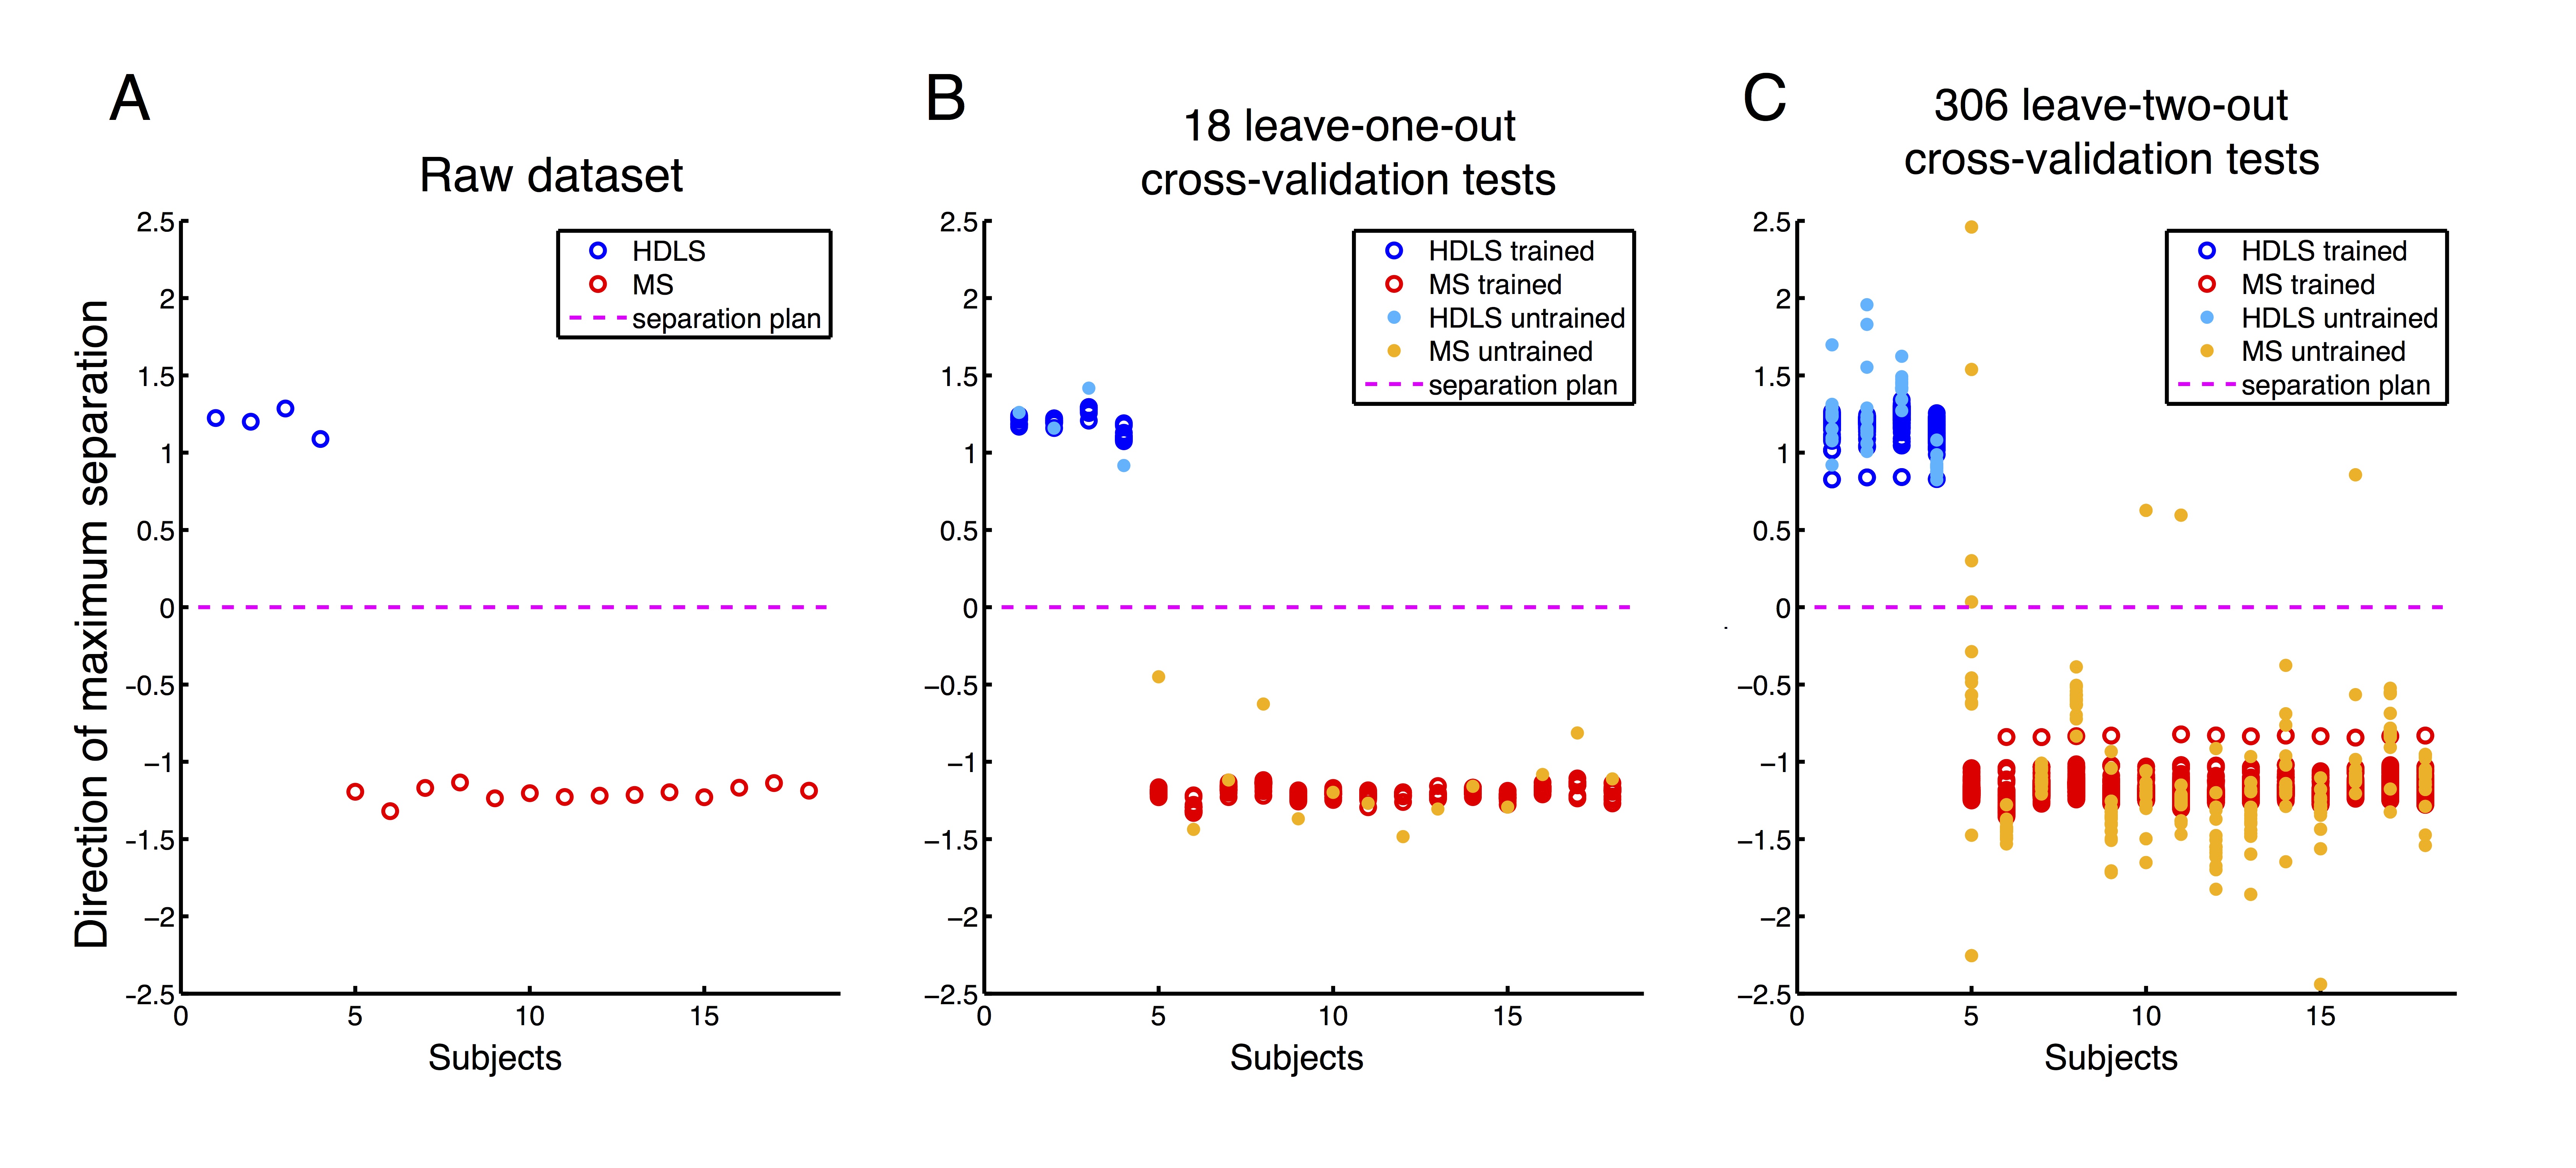
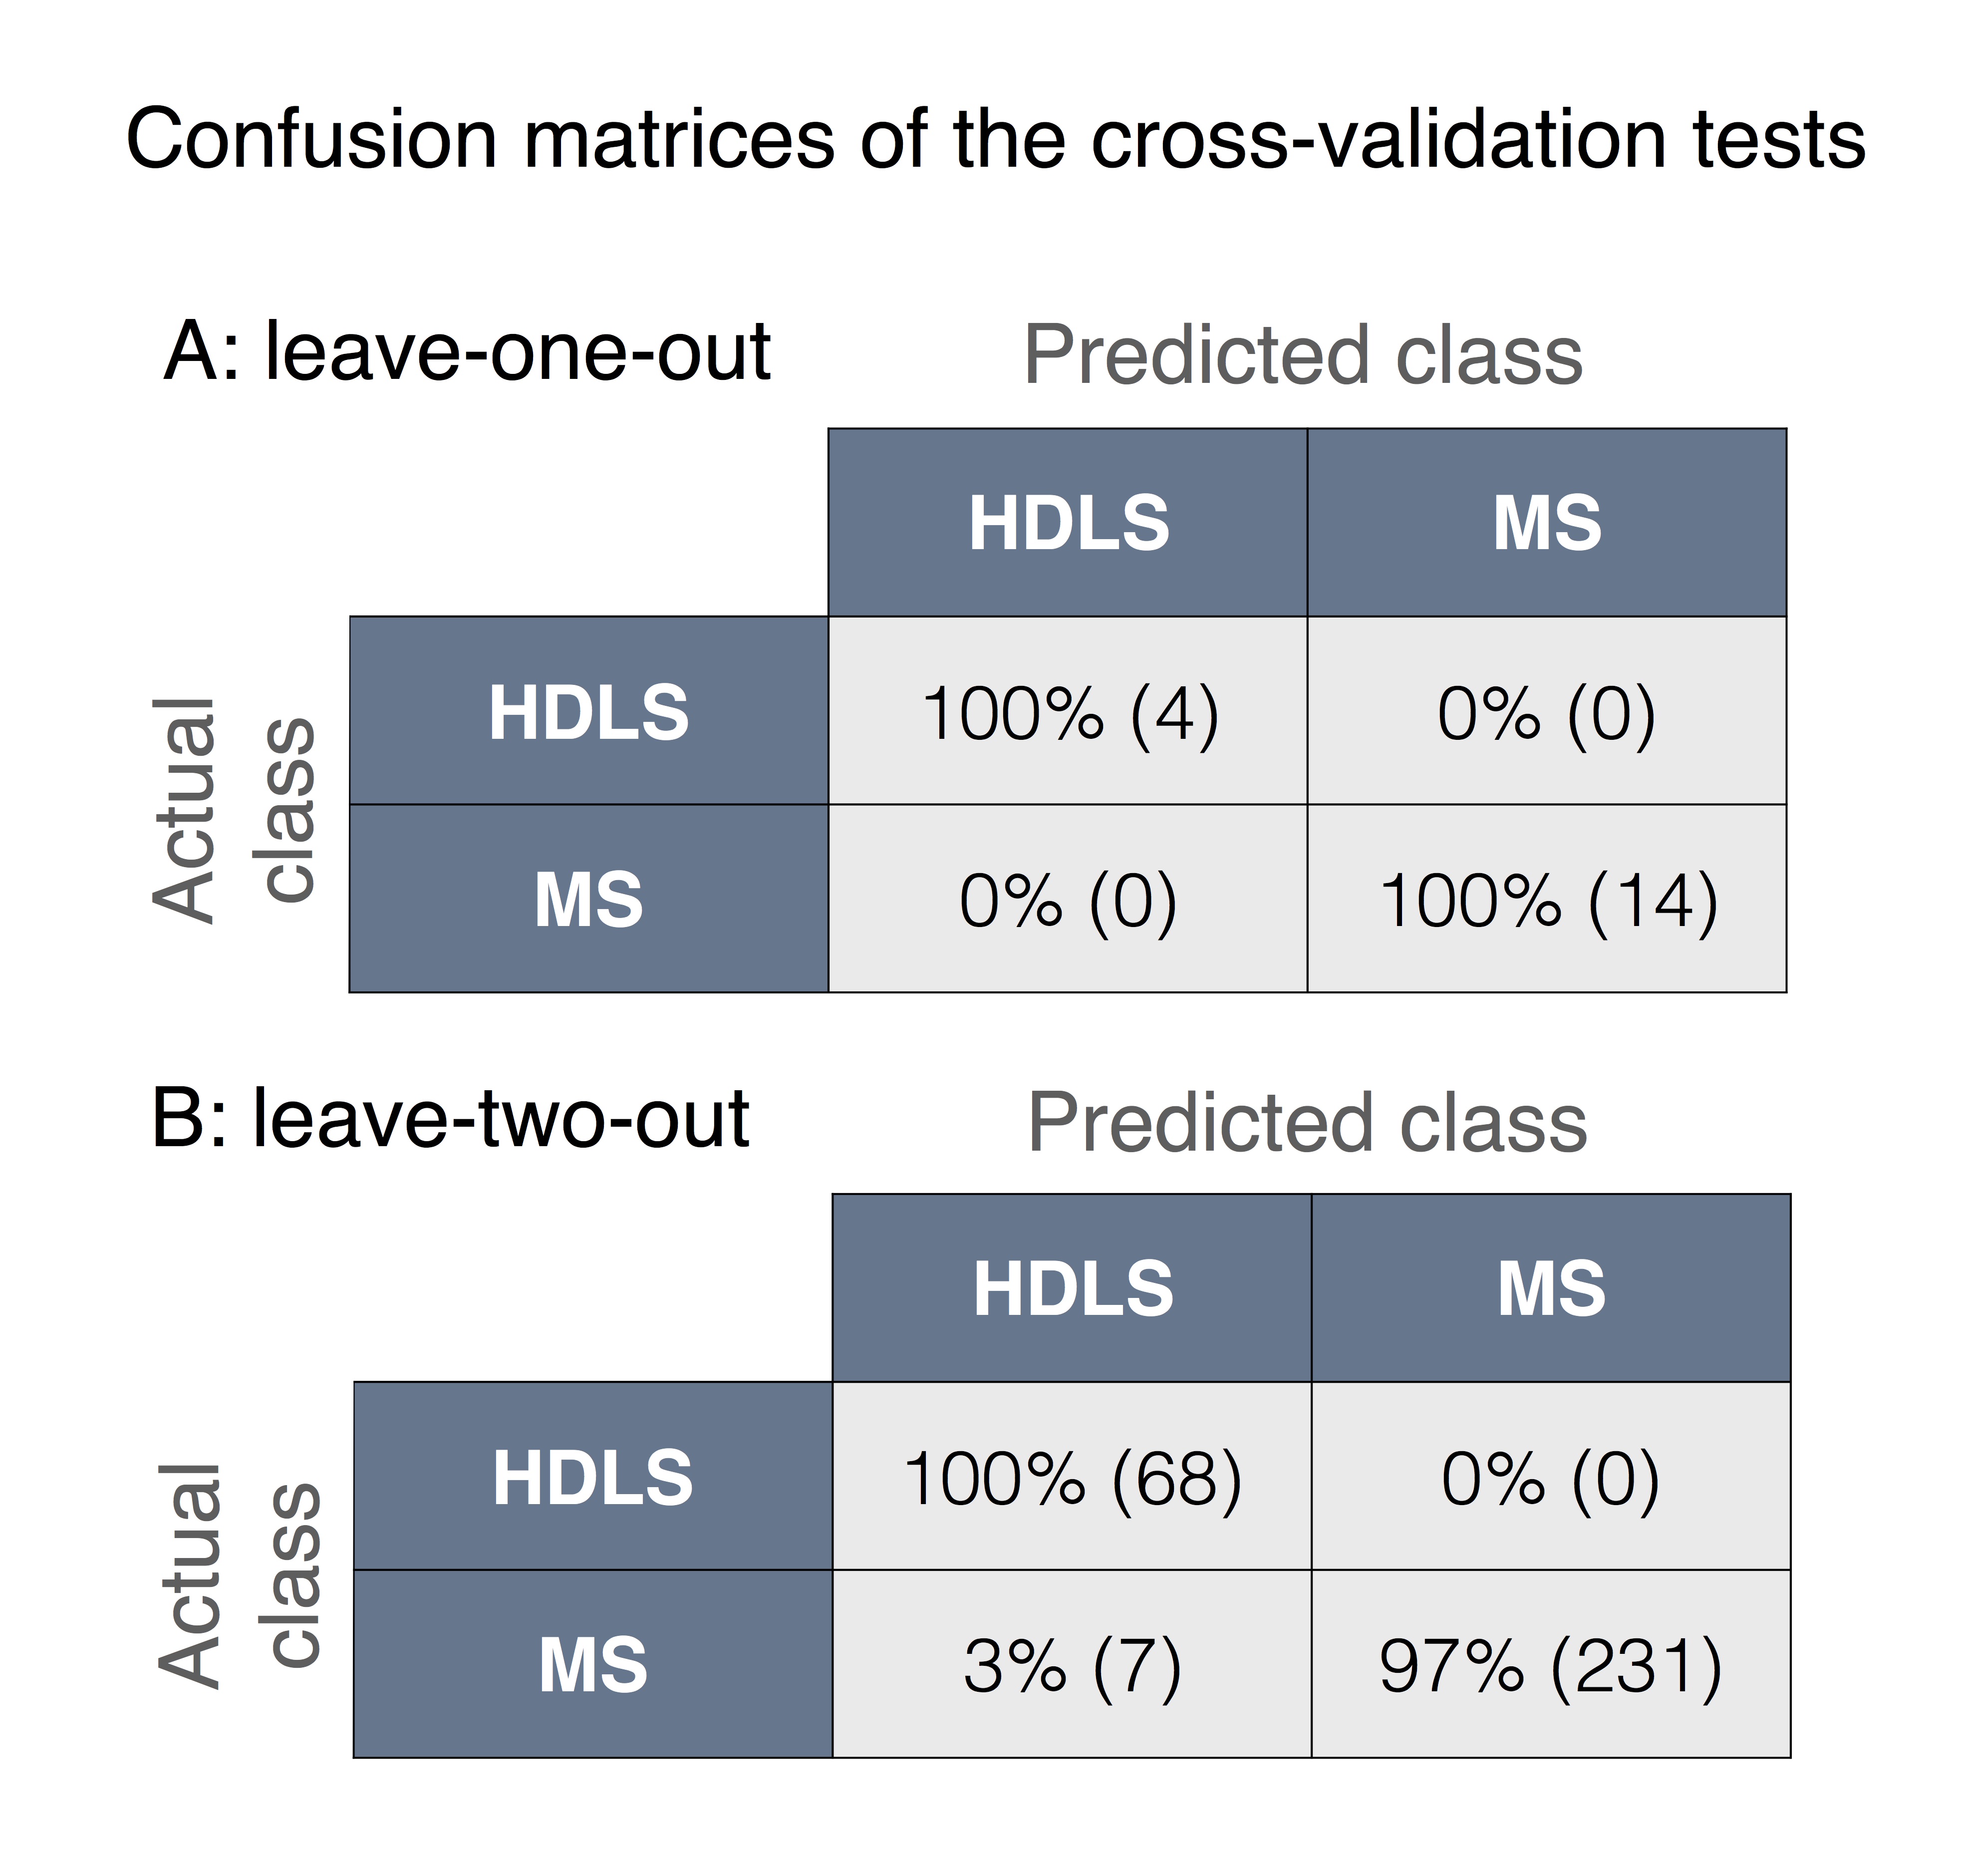
Figure 2A shows the dataset projected on the maximum separation hyper-direction. This representation allows a visual appreciation of the classification results, where an increased distance between the data points represents a more robust classification. Figure 2B shows the results of the leave-one-out bootstrap analysis, highlighting the untrained data in plain circles, and Figure 2C shows the results of the leave-two-out bootstrap in a similar way. Figure 3 shows the confusion matrices for the two cross-validations. The leave-one-out cross-validation shows an impressive classification with 100% detection rate and 0% false positives for both classes. The leave-two-out cross-validation corroborates these results, showing a very good classification with only 3% false positives in the HDLS group.Discussion/Conclusion
This study presents a robust and simple machine learning method that is able to robustly differentiate HDLS from MS, which is otherwise clinically and radiologically challenging to separate. The findings suggests that computer-assistance may be helpful in accurately diagnosing these disorders. Here, a simple linear classification method was shown more robust than non-linear methods. Except the lesion segmentation, no manual interventions are required to perform the classification, making the method relatively time-efficient. Future works will include i) automatic lesions segmentation, ii) acquisition noise stability tests and iii) the acquisition of a larger datasets to further validate this automated diagnostic approach.
Acknowledgements
We would like to thanks Maël Richard (Claude Bernard Medical University) for helpful discussions. This research was supported by the Stockholm City Council and Karolinska Institutet (ALF 20120213 and 20150166), the Canadian Institute of Health Research (CIHR FDN-143263), Canada Research Chair in Quantitative Magnetic Resonance Imaging, the Fonds de Recherche du Québec - Santé (FRQS 28826), the Fonds de Recherche du Québec - Nature et Technologies (FRQNT 2015-PR-182754), Quebec Bio-Imaging Network (QBIN), the Natural Sciences and Engineering research Council of Canada (NSERC). Dr. Granberg was supported by the Swedish Society for Medical Research.References
1. Granberg, T., Hashim, F., Andersen, O., Sundal, C. & Karrenbauer, V. D. Hereditary diffuse leukoencephalopathy with spheroids - a volumetric and radiological comparison with multiple sclerosis patients and healthy controls. Eur. J. Neurol. 23, 817–822 (2016).
2. Saitoh, B.-Y. et al. A case of hereditary diffuse leukoencephalopathy with axonal spheroids caused by a de novo mutation in CSF1R masquerading as primary progressive multiple sclerosis. Mult. Scler. 19, 1367–1370 (2013).
3. Sundal, C. et al. Hereditary diffuse leukoencephalopathy with spheroids with phenotype of primary progressive multiple sclerosis. Eur. J. Neurol. 22, 328–333 (2015).
4. Baba, Y. et al. Hereditary diffuse leukoencephalopathy with spheroids: clinical, pathologic and genetic studies of a new kindred. Acta Neuropathol. 111, 300–311 (2006).
5. Warntjes, J. B. M., Leinhard, O. D., West, J. & Lundberg, P. Rapid magnetic resonance quantification on the brain: Optimization for clinical usage. Magn. Reson. Med. 60, 320–329 (2008).
6. West, J., Warntjes, J. B. M. & Lundberg, P. Novel whole brain segmentation and volume estimation using quantitative MRI. Eur. Radiol. 22, 998–1007 (2012).
7. Fisher, R. A. The Use of Multiple Measurements in Taxonomic Problems. Ann. Eugen. 7, 179–188 (1936).
Figures