0896
Prediction of Tumor Progression Time Interval in Malignant Glioma Using Textural Information derived from FLAIR and T1c MR-images and Machine Learning1Institute for Diagnostic and Interventional Neuroradiology, University Hosiptal Bern, Bern, Switzerland, 2Institute of Radiooncology, University Hosiptal Bern, Bern, Switzerland, 3Institute of Pathology, University Bern, Bern, Switzerland, 4Center for Proton Therapy, Paul Scherrer Institute, Villigen, Switzerland, 5Neurosurgery, University Hosiptal Bern, Bern, Switzerland
Synopsis
Glioma-patients get regular neuroradiological MRI-follow-ups to evaluate the tumor-progression-status. In this study it was investigated whether it is possible to predict tumor progression within the next follow-up period, from progression on a longer time-scale. The T1c- and FLAIR-images of two times 20 patients were investigated; one group having stable-disease at two subsequent follow-ups (ST-ST), the second group showed stable-disease during the first but progressive-disease during the second follow-up (ST-PR). By applying machine-learning (random-forests) on textural MRI-information, short-term progression could be predicted with an accuracy of 77.5%. This novel type of information can have an impact on improved personalized-treatment of glioma-patients.
Introduction
Magnetic resonance imaging (MRI) is the imaging method of choice for the initial diagnosis and follow-up of patients with high-grade gliomas. Currently, decisions on second-line therapies of gliomas are based on whether the revised assessment in neuro-oncology (RANO) criteria for progression are fulfilled during follow-up examinations. This means e.g. that re-resection is considered at a time point at which the tumor shows neuroradiologic signs of progressive-disease. The purpose of this study was to investigate whether combined fluid-attenuated inversion-recovery (FLAIR) and T1c-imaging-derived bio-markers, obtained from patients with stable-disease according to RANO, can distinct neuroradiological tumor-recurrence within the follow-up time-period from more prolonged tumor-recurrence. This information could potentially be used to either increase the frequency of MRI-follow-up, and/or to alert clinicians to consider other second-line therapeutic options before human visible neuroradiological progression occurs.Methods
Patients - We conducted a prospective cohort-study of 40 patients with histologically confirmed high-grade gliomas, according to their neuroradiological follow-up status. One group of 20 patients (stable-stable group (ST-ST)) who exhibited stable disease according to the RANO-criteria and advanced neuro- imaging criteria (MR-perfusion and MR-spectroscopy) during at least 2 follow-up MR-examinations (conducted at approximately 3‑monthly intervals) formed the reference group. The other group, also comprising of 20 patients, showed stable-disease during the first MRI-follow-up but during the second follow-up, met the RANO and advanced neuro-imaging criteria for progressive-disease (stable-progression group (ST-PR)).
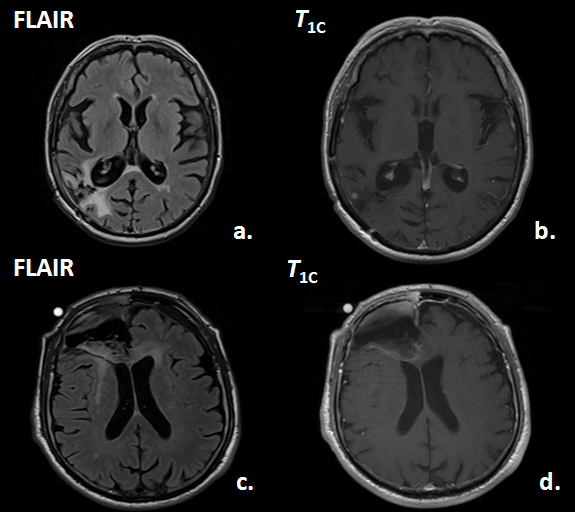
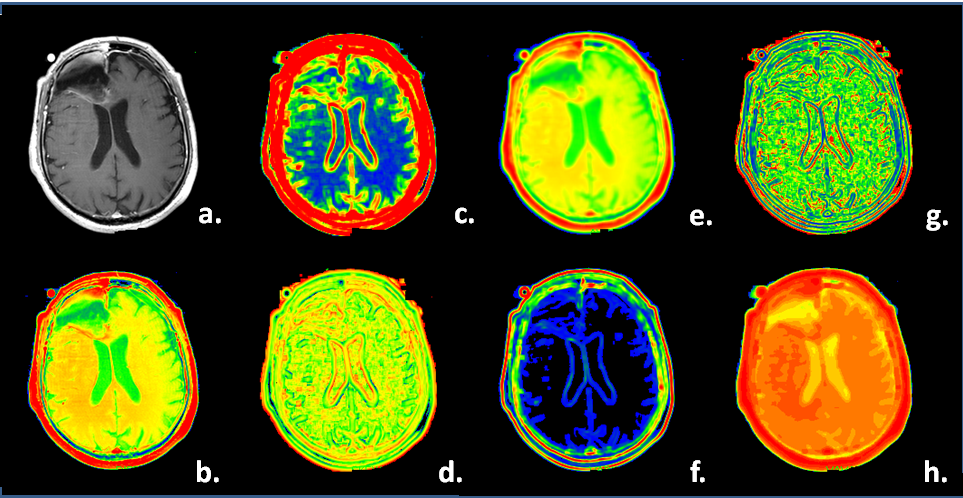
Image Selection and Contouring - Manually drawn regions on FLAIR- and post-contrast T1,c were defined that enclosed the complete abnormal tumor-affected region, as compared to the normal-appearing opposite hemisphere (see example images in Figure 1). From the original FLAIR- and post-contrast T1,c (ORIG), the following textural maps were computed over a 5 x 5 pixel-interval: (a.) local moving averaged maps (AVER), (b.) the local STandard DEViation (STDE) maps, (c.) local SKEWness maps (SKEW); (d.) local variance maps (VARI); (e.) local KURTosis maps (KURT); (f.) local VAriance-in-VAriance (VAVA) maps. The mean values over the contoured regions of the 2 times 7 maps were taken as features for the classification. Their numerical products were taken as 7 additional features, resulting in a total of 21 features. Additionally the patient age, abnormal T1c-volume, abnormal FLAIR-volume and T1c-volume-to-FLAIR-volume we used in the analysis and machine learning algorithm (random forests [1]). Results were confirmed by leave-one-out cross-validation to test for overfitting. In Figure 2 an example of the used computed texture-maps derived from T1c in this study is shown.
Hypothesis - It is possible to predict tumor-progression occurring within the follow-up period (in this study effectively 3.1 months) from more prolonged tumor-progression occurring using T1c-, FLAIR- derived texture-parameters and machine-learning.
Results
Taking image features from FLAIR only, or from T1c only, the RF-classification based distinction between the ST-ST from the ST-PR group could be distinguished with an out-of-box (OOB) classification error of 32.5% for FLAIR and also 32.5% for the T1c-images. The performance of the classifiers can substantially be improved by basing the classification on the FLAIR and T1c product-features only; the OOB classification error drops to 25%.
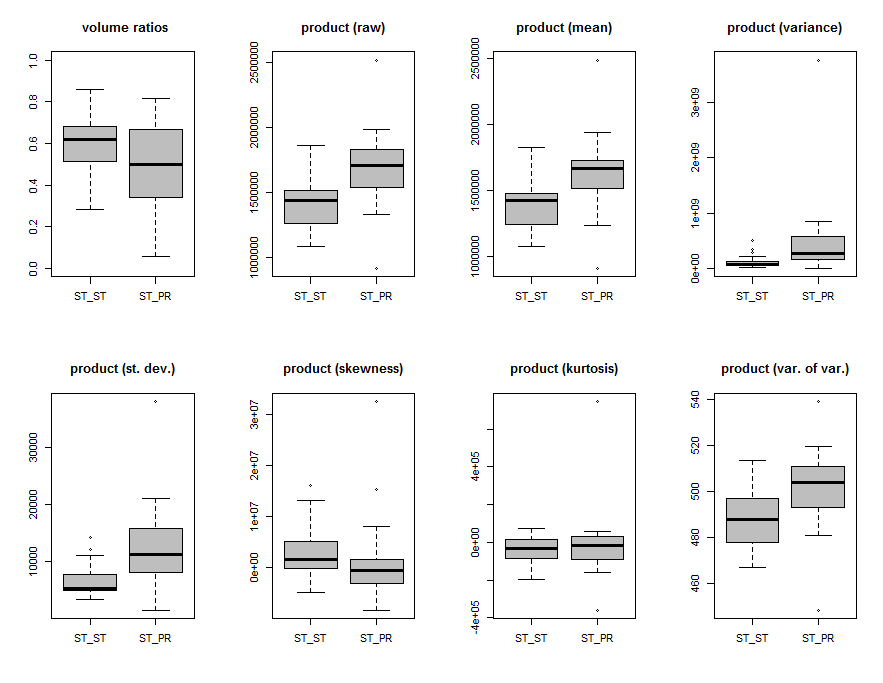
To illustrate the numerical differences in the product-features between the ST-ST and the ST-PR group, Figure 3 shows the box-plots of the product features extracted from both T1c, FLAIR images (e.g. the tumors' VARI(T1c) x VARI(FLAIR) is displayed in the top-left box-plot of Figure 3). For example, the product (raw) feature, which measures the tumors' average product-brightness of both T1c-, and FLAIR-images, differs highly significantly with a p=0.0004 (Wilcoxon sum rank test) between the groups. Significant differences are also obtained for the variance, standard deviation and variance-in-variance product features. No significant difference were obtained in the skewness and kurtosis textural product-features.
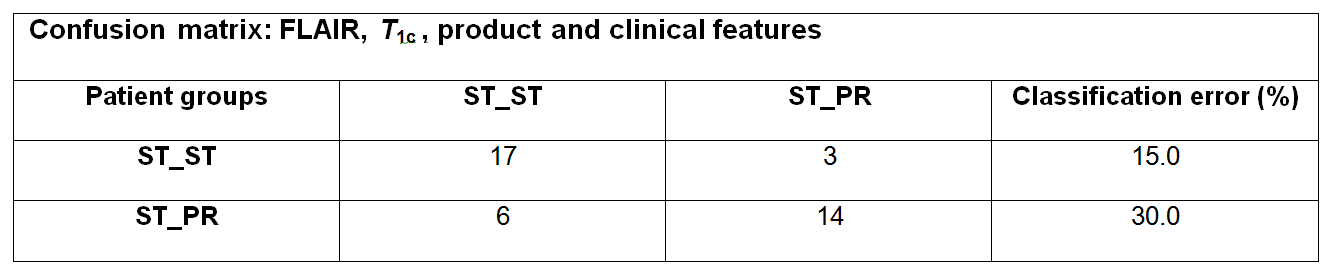
Best classification performance to distinguish ST-ST from ST-PR was obtained with a combination of features from FLAIR, T1c and product features, and yielded a classification OOB-error of just 22.5%, and a specificity of 82.3% (95% CI [55.8%,95.3%]) and a sensitivity of 73.9% (95% CI [51.3%,88.9%]). Figure 4 shows the confusion matrix of this classifier.
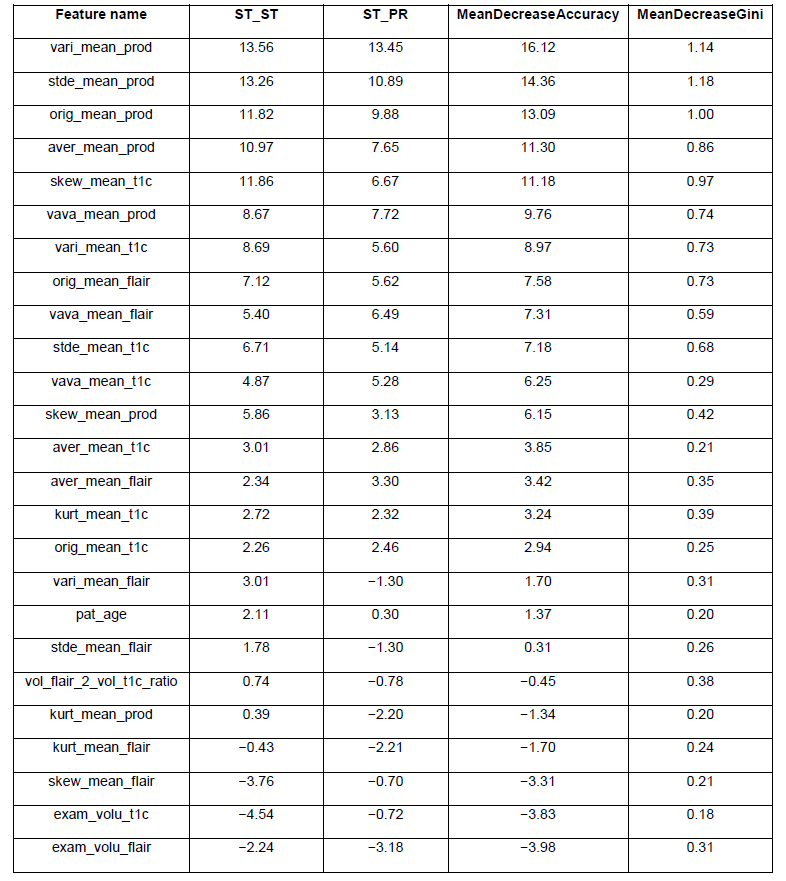
A very elegant feature of Breimans' random-forests algorithm [1] is, that it also indicates the relative importance of the used features. The most important features were: 1. the product variance, 2. product standard deviation, 3. the product mean values. The least important features were the T1c and FLAIR derived tumor volumes. A full overview of all relative-importance of all RF-included features can be found in Figure 5.
Conclusion
FLAIR and T1c MR-image-derived textural features provide predictive information to distinguish rapid from slow malignant glioma-recurrence in patients with high-grade gliomas. This information can potentially be used for timely initiating personalized second-line medical treatments in this disease.Acknowledgements
This study was supported by Swiss National Foundation, Grant number 320030_140958, and by the EU Marie Curie FP7-PEOPLE-2012-ITN project TRANSACT (PITN-GA-2012-316679).References
1. Breiman L. Random forests. Mach Learn. 2001;45(1):5-32. doi:10.1023/A:1010933404324.Figures