0895
Biomarkers for CTE diagnosis in retired NFL player using Machine learning1Electrical and Computer Engineering, Boston University, Boston, MA, United States, 2Department of Neurology, Boston University, Boston, MA, United States, 3Center for Clinical Spectroscopy, Brigham and Women's hospital, Boston, MA, United States, 4Boston University, Boston, MA, United States
Synopsis
Multiple concussions have the potential to develop Chronic Traumatic Encephalopathy (CTE), a neurodegenerative disease that is currently diagnosed only in postmortem by tau protein deposition in the brain. Since repetitive head trauma alters brain morphology and metabolism, magnetic resonance imaging and spectroscopy could be suitable candidates for CTE diagnosis. Therefore, we propose machine learning-based approach to identify CTE-related biomarkers. The model achieves 80% prediction accuracy with AUC of 0.72 using creatine, macromolecules and brain volume as features for the machine learning model.
Introduction
Repetitive brain trauma experienced by individuals in contact sports can lead to long-term neurological difficulties1. Athletes with multiple concussions have the potential to develop Chronic Traumatic Encephalopathy (CTE)2, 3, a progressive neurodegenerative brain disease. Currently, CTE is diagnosed postmortem characterized by a distinct pattern of tau protein deposition in the brain. Given the concern for developing CTE within sports athletes and others that suffer from multiple brain traumas, there is a need for an in-vivo diagnosis. MR Spectroscopy (MRS) can be a suitable candidate for CTE diagnosis as studies have shown neurochemical changes in the brain as a result of repetitive brain trauma4, 5. However, these changes can be subtle, and group differences are not sufficient for clinical diagnosis. With the aid of machine learning, it is possible to use a multivariate approach to find differences that correspond to the symptomatic changes that have been exhibited in athletes before their death.Methods
This study includes 65 athletes (males) from the National Institutes of Health funded “Diagnosing and Evaluating Traumatic Encephalopathy using Clinical Tests” (DETECT) study. Inclusion criteria are professional NFL players with a minimum of 2 years of active playing time ages 40–69 years. All athletes underwent proton MRS on a 3T MRI (Siemens TIM Verio) using a 32 channel head coil using short-echo point-resolved (PRESS) single voxel spectroscopy (TE=30ms, TR=2s, 128 averages, 8 cc volume) in the posterior cingulate of the brain. We also obtained the brain volume and gray matter volume in that region. The raw PRESS data is frequency and phase corrected using Suspect6 and metabolites concentrations were measured using LCmodel7. Metabolites with Cramer-Rao lower bounds of less than 20% are used for the classification algorithm.
All athletes also underwent a comprehensive neuropsychological and clinical evaluation. The results are modeled into a four-factor structure described in previous studies in a larger cohort from which these subjects were drawn8. The four-factors are 1) behavior/mood, 2) psychomotor speed/executive function, 3) verbal memory, and 4) visual memory. Z-scores below -1 for Factors 2,3, and 4 or above 1 for Factor 1 were considered impaired. For this study, athletes with one or more impairments were labeled as “Impaired class” (n=32). The remaining athletes formed “Non-Impaired class” (n=33).
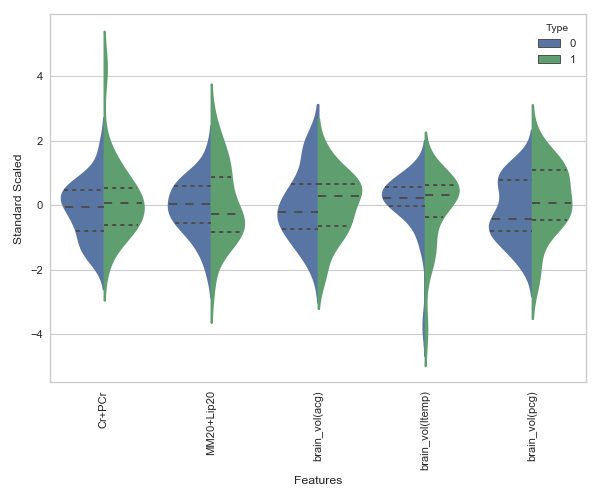
Python programming language and Sci-kit library9 were used for our machine learning analysis. We considered metabolite concentrations from PRESS, brain volume, demographic and RHI exposure information as features. Since the number of samples is limited, we did feature elimination using Sequential Feature Search (SFS)10, 11algorithms. Figure 1 shows the result of feature selection and it is evident that using all the features for classification lead to poor generalization. Figure 2 shows that distribution of 5 features selected by SFS is different for “Non-Impaired” and “Impaired” athletes.
Results
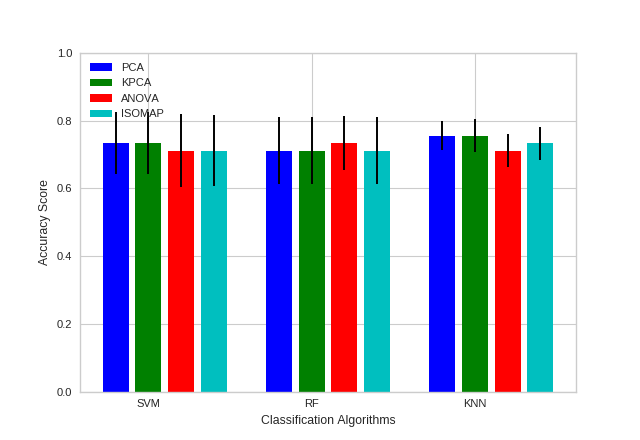
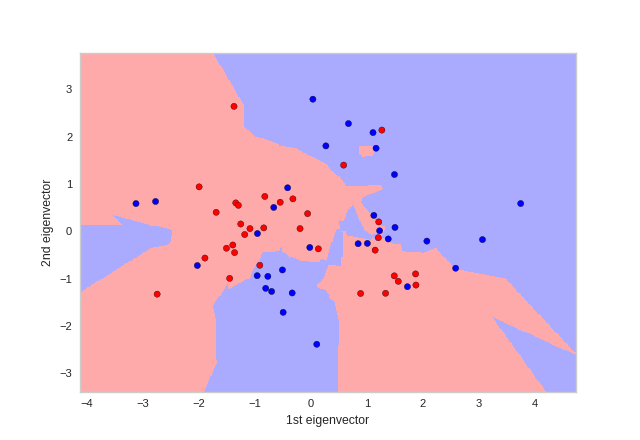
We considered three type of supervised machine learning algorithms, Support Vector Machine with radial basis function (SVM-RBF), K-Nearest Neighbors (KNN) and Random forest (RF), for classification and three dimensionality reduction techniques Principal Component Analysis (PCA), Kernel PCA (KPCA) and Isometric mapping (ISOMAP) to reduce the number of features further. Additionally, we used Analysis of Variance (ANOVA) to understand the importance of each feature. The dataset was randomly divided into 70% training and 30% testing set. We performed a grid search with 5-fold Cross-Validation for model parameters using the training set. From Figure 3 KNN has high mean accuracy and low standard deviation compared to SVM-RBF and RF classifiers. Evaluating the classifier using testing set resulted in AUC of 0.72 and prediction accuracy of 80% for KNN with 4 neighbors and PCA with 2 components. Figure 4 shows the decision boundary of the classification model. The sensitivity and specificity of the model was 80% for testing set. Therefore, based on classification results tCr, peaks at macromolecule spectrum and brain volumes are potential biomarkers for CTE.
Conclusion
While tCr and brain volume have been described to be changed in other concussion studies4, 12, it is of great interest that the macromolecules had high relevance for classification. This implies that changes in the macromolecules spectrum may have hidden diagnostic value for CTE-related research and can be further explored using methods such as 2D correlated spectroscopy. It is also evident from the analysis that the neurochemical changes correspond with the neuropsychological test and clinical evaluation. This reflects the heterogeneity of changes found in concussion studies and demonstrates the substantial value of machine learning methods to evaluate changes in CTE. The current multicenter U01 study will provide a larger cohort and additional insight into the use of MRS for CTE.Acknowledgements
This work was supported by grants from the National Institutes of Health (NIH; P30 AG13846; R01NS078337; R56 9500304025; U01NS093334; 1U01NS086659-01) as well as the joint Boston University-Brigham and Women's Hospital Fellowship.References
1. Koerte, I. K. et al. A review of neuroimaging findings in repetitive brain trauma. Brain Pathology 25, 318–349 (2015).
2. Stern, R. A. et al. Clinical presentation of chronic traumatic encephalopathy. Neurology 81, 1122–1129 (2013).
3. McKee, A. C. et al. The spectrum of disease in chronic traumatic encephalopathy. Brain 136, 43–64 (2013).
4. Lin, A. P. et al. Changes in the neurochemistry of athletes with repetitive brain trauma: preliminary results using localized correlated spectroscopy. Alzheimer’s research & therapy 7, 13 (2015).
5. Koerte, I. K. et al. Altered neurochemistry in former professional soccer players without a history of concussion. Journal of neurotrauma 32, 1287–1293 (2015).
6. Rowland B, I. J. L. A., Mariano LJ. An open-source software repository for magnetic resonance spectroscopy data analysis tools. International Society for Magnetic Resonance in Medicine MR Spectroscopy Workshop (2016).
7. Provencher, S. W. Automatic quantitation of localized in vivo1h spectra with lcmodel. NMR in Biomedicine 14, 260–264 (2001).
8. Alosco, M. L. et al. Olfactory function and associated clinical correlates in former national football league players. Journal of neurotrauma 34, 772–780 (2017).
9. Pedregosa, F. et al. Scikit-learn: Machine learning in python. Journal of Machine Learning Research 12, 2825–2830 (2011).
10. Aha, D. W. & Bankert, R. L. A comparative evaluation of sequential feature selection algorithms. In Learning from data, 199–206 (Springer, 1996).
11. Raschka, S. Mlxtend (2016). URL http://dx.doi.org/10.5281/zenodo.594432.
12. Zhou, Y. et al. Mild traumatic brain injury: longitudinal regional brain volume changes. Radiology 267, 880–890 (2013).
Figures
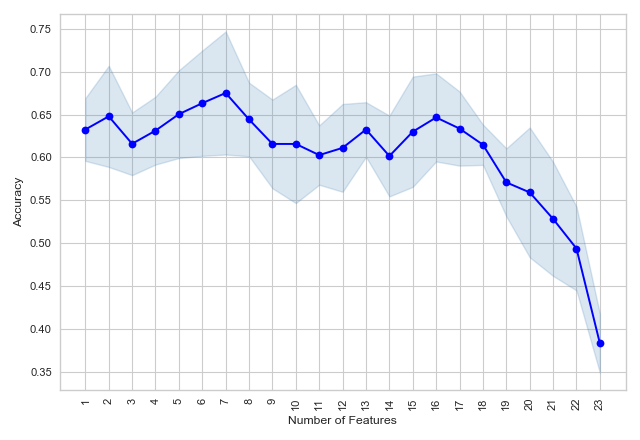
Figure 1: Mean accuracy (with standard deviation) of Linear classifier with 5 fold Cross-validation using Sequential Forward Feature Selection for feature selection.