0894
Machine learning with amide proton transfer and magnetization transfer MRI for predicting IDH mutation status in diffuse gliomas1Department of Radiology, Johns Hopkins University, Baltimore, MD, United States, 2Department of Radiology, Zhujiang Hospital, Southern Medical University, Guangzhou, China, 3Department of Pathology, Zhujiang Hospital, Southern Medical University, Guangzhou, China, 4Department of Pathology, Johns Hopkins University, Baltimore, MD, United States, 5F.M. Kirby Research Center for Functional Brain Imaging, Kennedy Krieger Institute, Baltimore, MD, United States
Synopsis
The current diagnostic criterion for IDH mutation status is based on lab tests via surgical tissue samples. APTw and MT imaging contrast mechanisms can detect low-concentration mobile proteins and semi-solid macromolecules, respectively. We implemented a support vector machine (SVM)-based method to predict IDH1/2 genotype in gliomas using APTw and MT MRI features. 105 WHO Grade II and III glioma patients with complete imaging and genetic data were enrolled. Within the supervised classification framework, our results suggest that the use of APTw and MT features enabled the SVM to reach the accurate diagnosis of the IDH genotype in gliomas.
Target audience:
Researchers and clinicians who are interested in clinical APT imaging applications and radiogenomics.Purpose
In 2016, the WHO released the first algorithm including genetic signatures to achieve classification in patients with diffuse gliomas (1), the reason being that different genotypes lead to diverse outcomes. Among the recommended genetic markers, isocitrate dehydrogenase (IDH) mutation status has the critical clinical relevance(2). A number of recent studies have investigated the efficiency and accuracy of structural MR imaging features to discriminate patients with IDH-wildtype and IDH-mutant gliomas by machine learning (3, 4). However, none of them used features from molecular MR images. Amide proton transfer-weighted (APTw) and magnetization transfer (MT) imaging were used to generate contrast dominated by endogenous mobile proteins and semi-solid macromolecules (5). The goal of this study was to evaluate the power of machine learning in classification for IDH1/2 mutation status in grade II and III gliomas using APTw and MT MRI features.Methods
Patients: A total of 105 patients, who had MRI exams between May 2013 and August 2016, were enrolled. Each patient had all study related MRI data prior to their initial surgical diagnostic procedure and a lab test report of IDH1/2 mutation status. Pathological specimens were examined and re-classified as WHO grade II or III glioma according to the 2016 CNS WHO guidelines. Approval for the study was obtained from the institutional review board, and the requirement of informed consent was waived for this retrospective analysis.
MRI protocol: All patients were scanned on a Philips 3T MRI system. The sequences performed for each patient included T1w, T2w, FLAIR, APTw, MT, and gadolinium contrast-enhanced T1w. A multi-offset, multi-acquisition imaging acquisition scheme was used for APTw and MT imaging (saturation power = 2 μT; saturation time = 800 msec; matrix = 128×128; field of view = 240×240 mm2; slice thickness = 6 mm; scan time = 3 min) (5). APTw images were calculated using the magnetization transfer ratio (MTR) asymmetry at 3.5ppm.
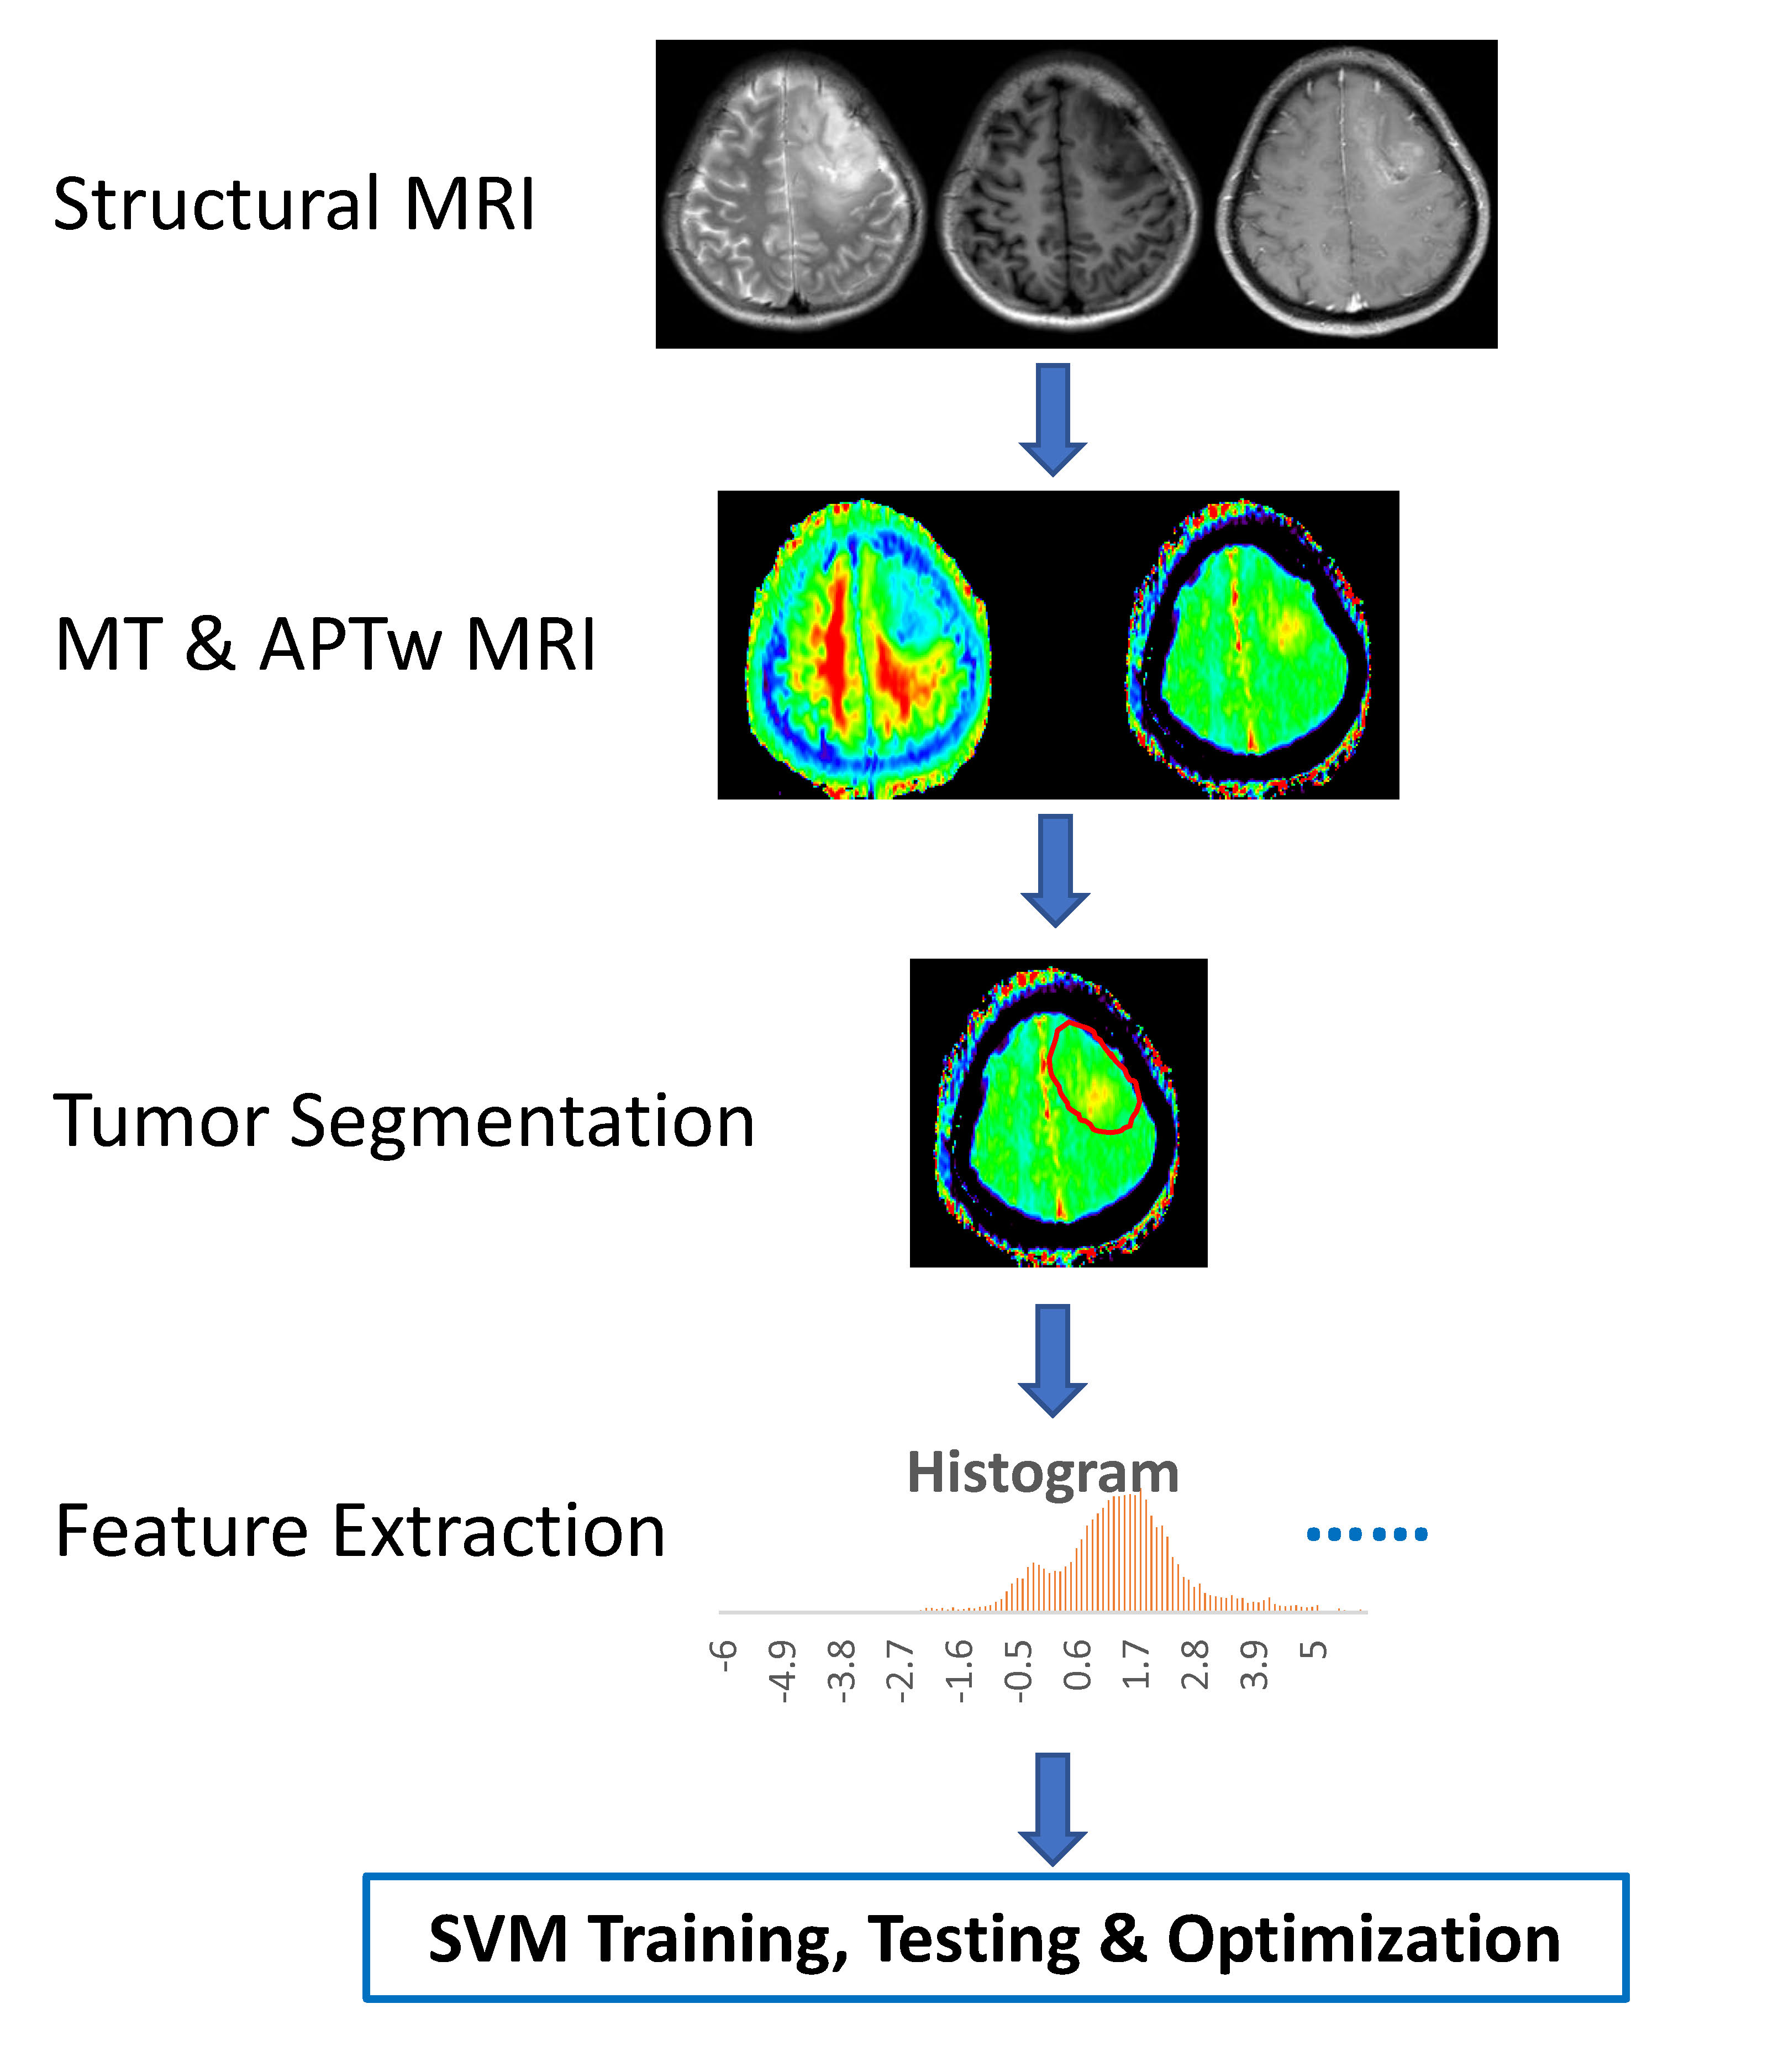
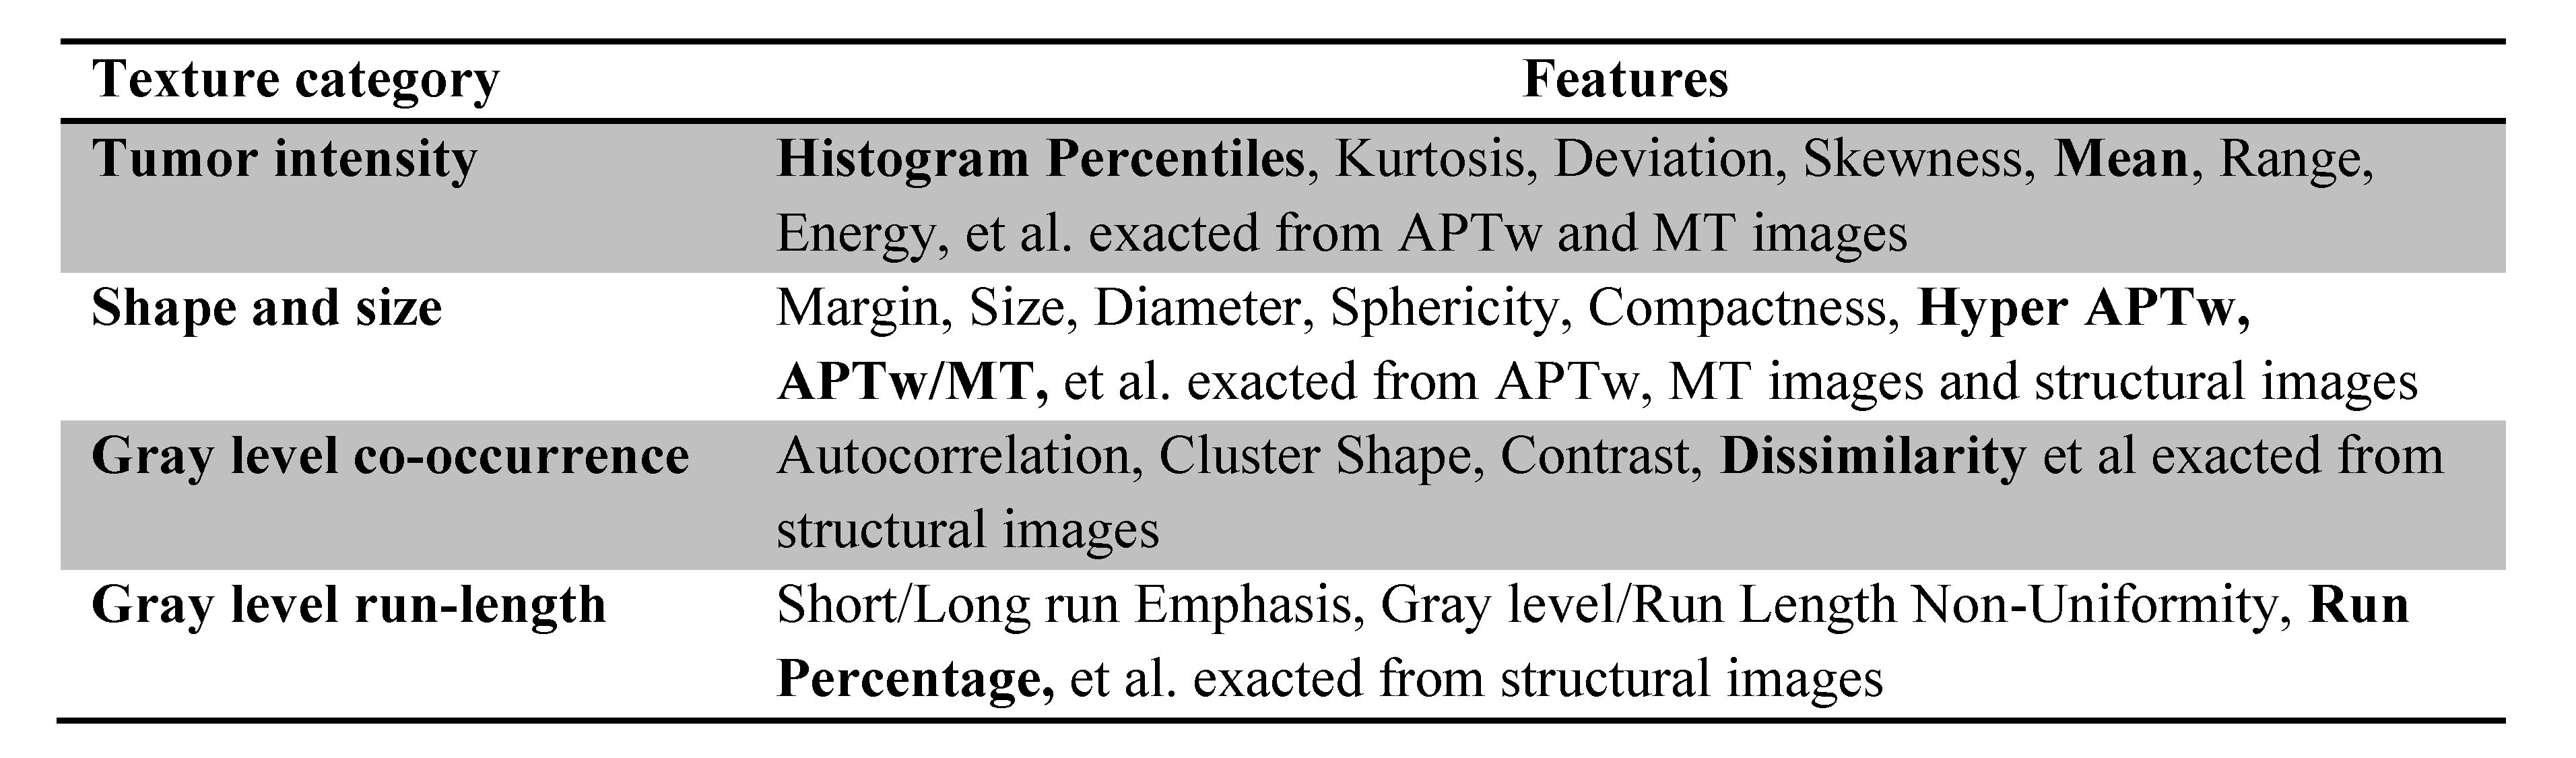
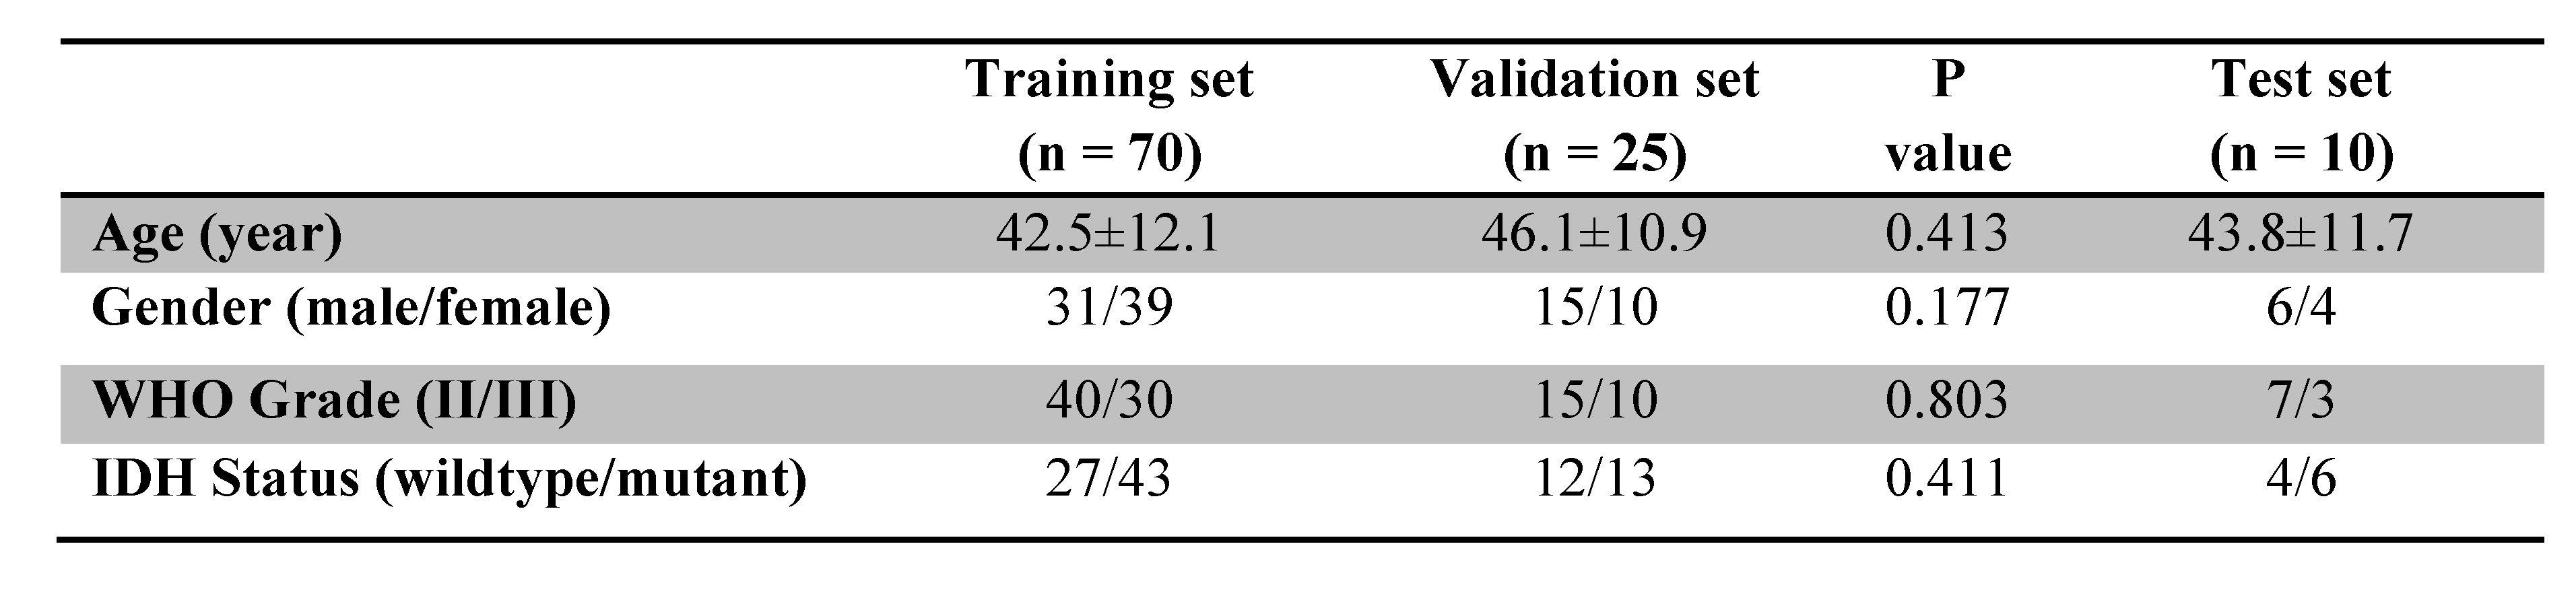
Data Postprocessing: The processing workflow is presented in Fig. 1. All MR Images were corrected for geometric distortion and motion. Semi-automatic segmentation of lesions was performed in IDL, and then, normalization of regions of interest (ROIs) was performed (6). 391 radiomics features(7) based on shape and size, texture, histogram statistics, and parametric intensity on APTw, MT and structural MR images were extracted from the tumor ROIs and calculated automatically after removing redundant features (Table 1). To utilize the features, the support vector machine (SVM) method was implemented as shown schematically in Fig. 1. 70 cases were randomly assigned to training set, 25 cases to validation set, and 10 cases to test set (Table 2). 10-fold cross-validation was used for tuning parameter (γ) selection. A grid search comprehensive possible combinations of γ and C, within a preselected range of values (0.01, 0.03, 0.1, 0.3, 1, 3, 10, 30) was done to find the best combination of γ and C providing optimal classifiers (3).
Statistical analysis: Chi-square test and t-test were performed to evaluate the differences in the demographic and clinical characteristics of the patients between the training set and validation set. Leave-one-out cross-validation was applied to get an overall estimation of the classification performance of the models. The accuracy of a classifier in distinguishing IDH-wildtype from IDH-mutant was determined by a ROC analysis. AUC, sensitivity, specificity, and classification accuracy were measured from the results. The alpha level of all tests was set at P < 0.05.
Results and Discussion
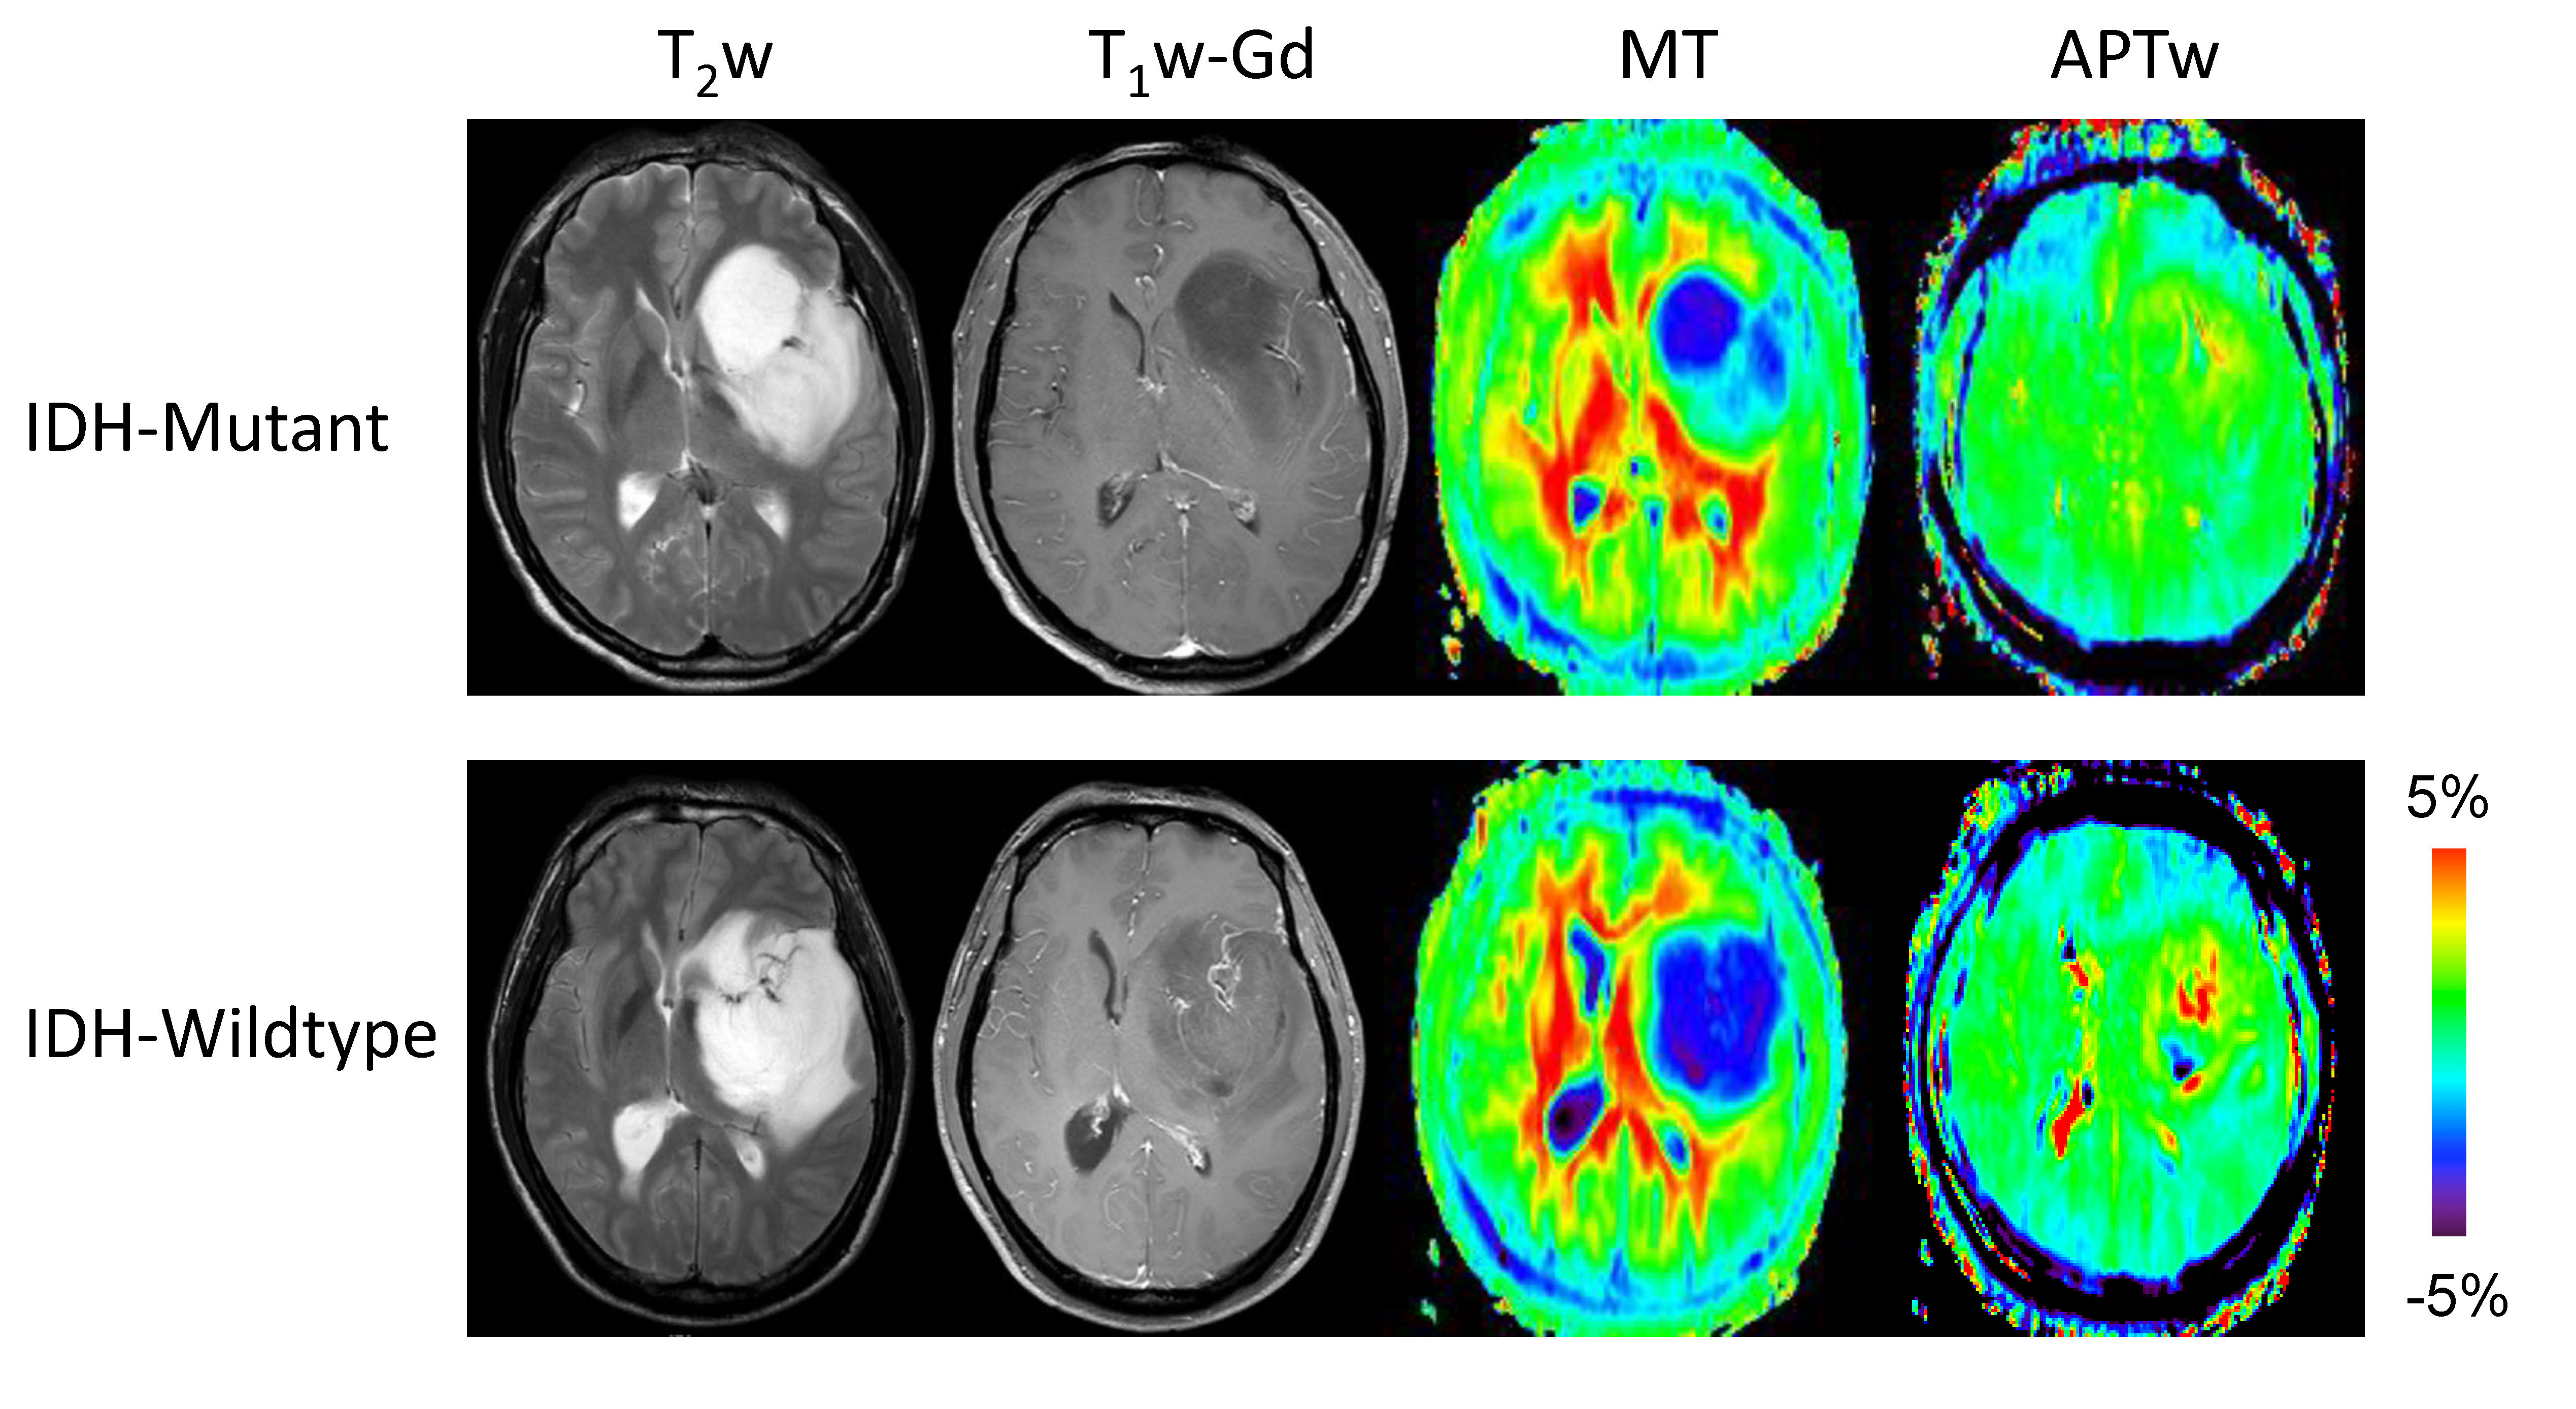
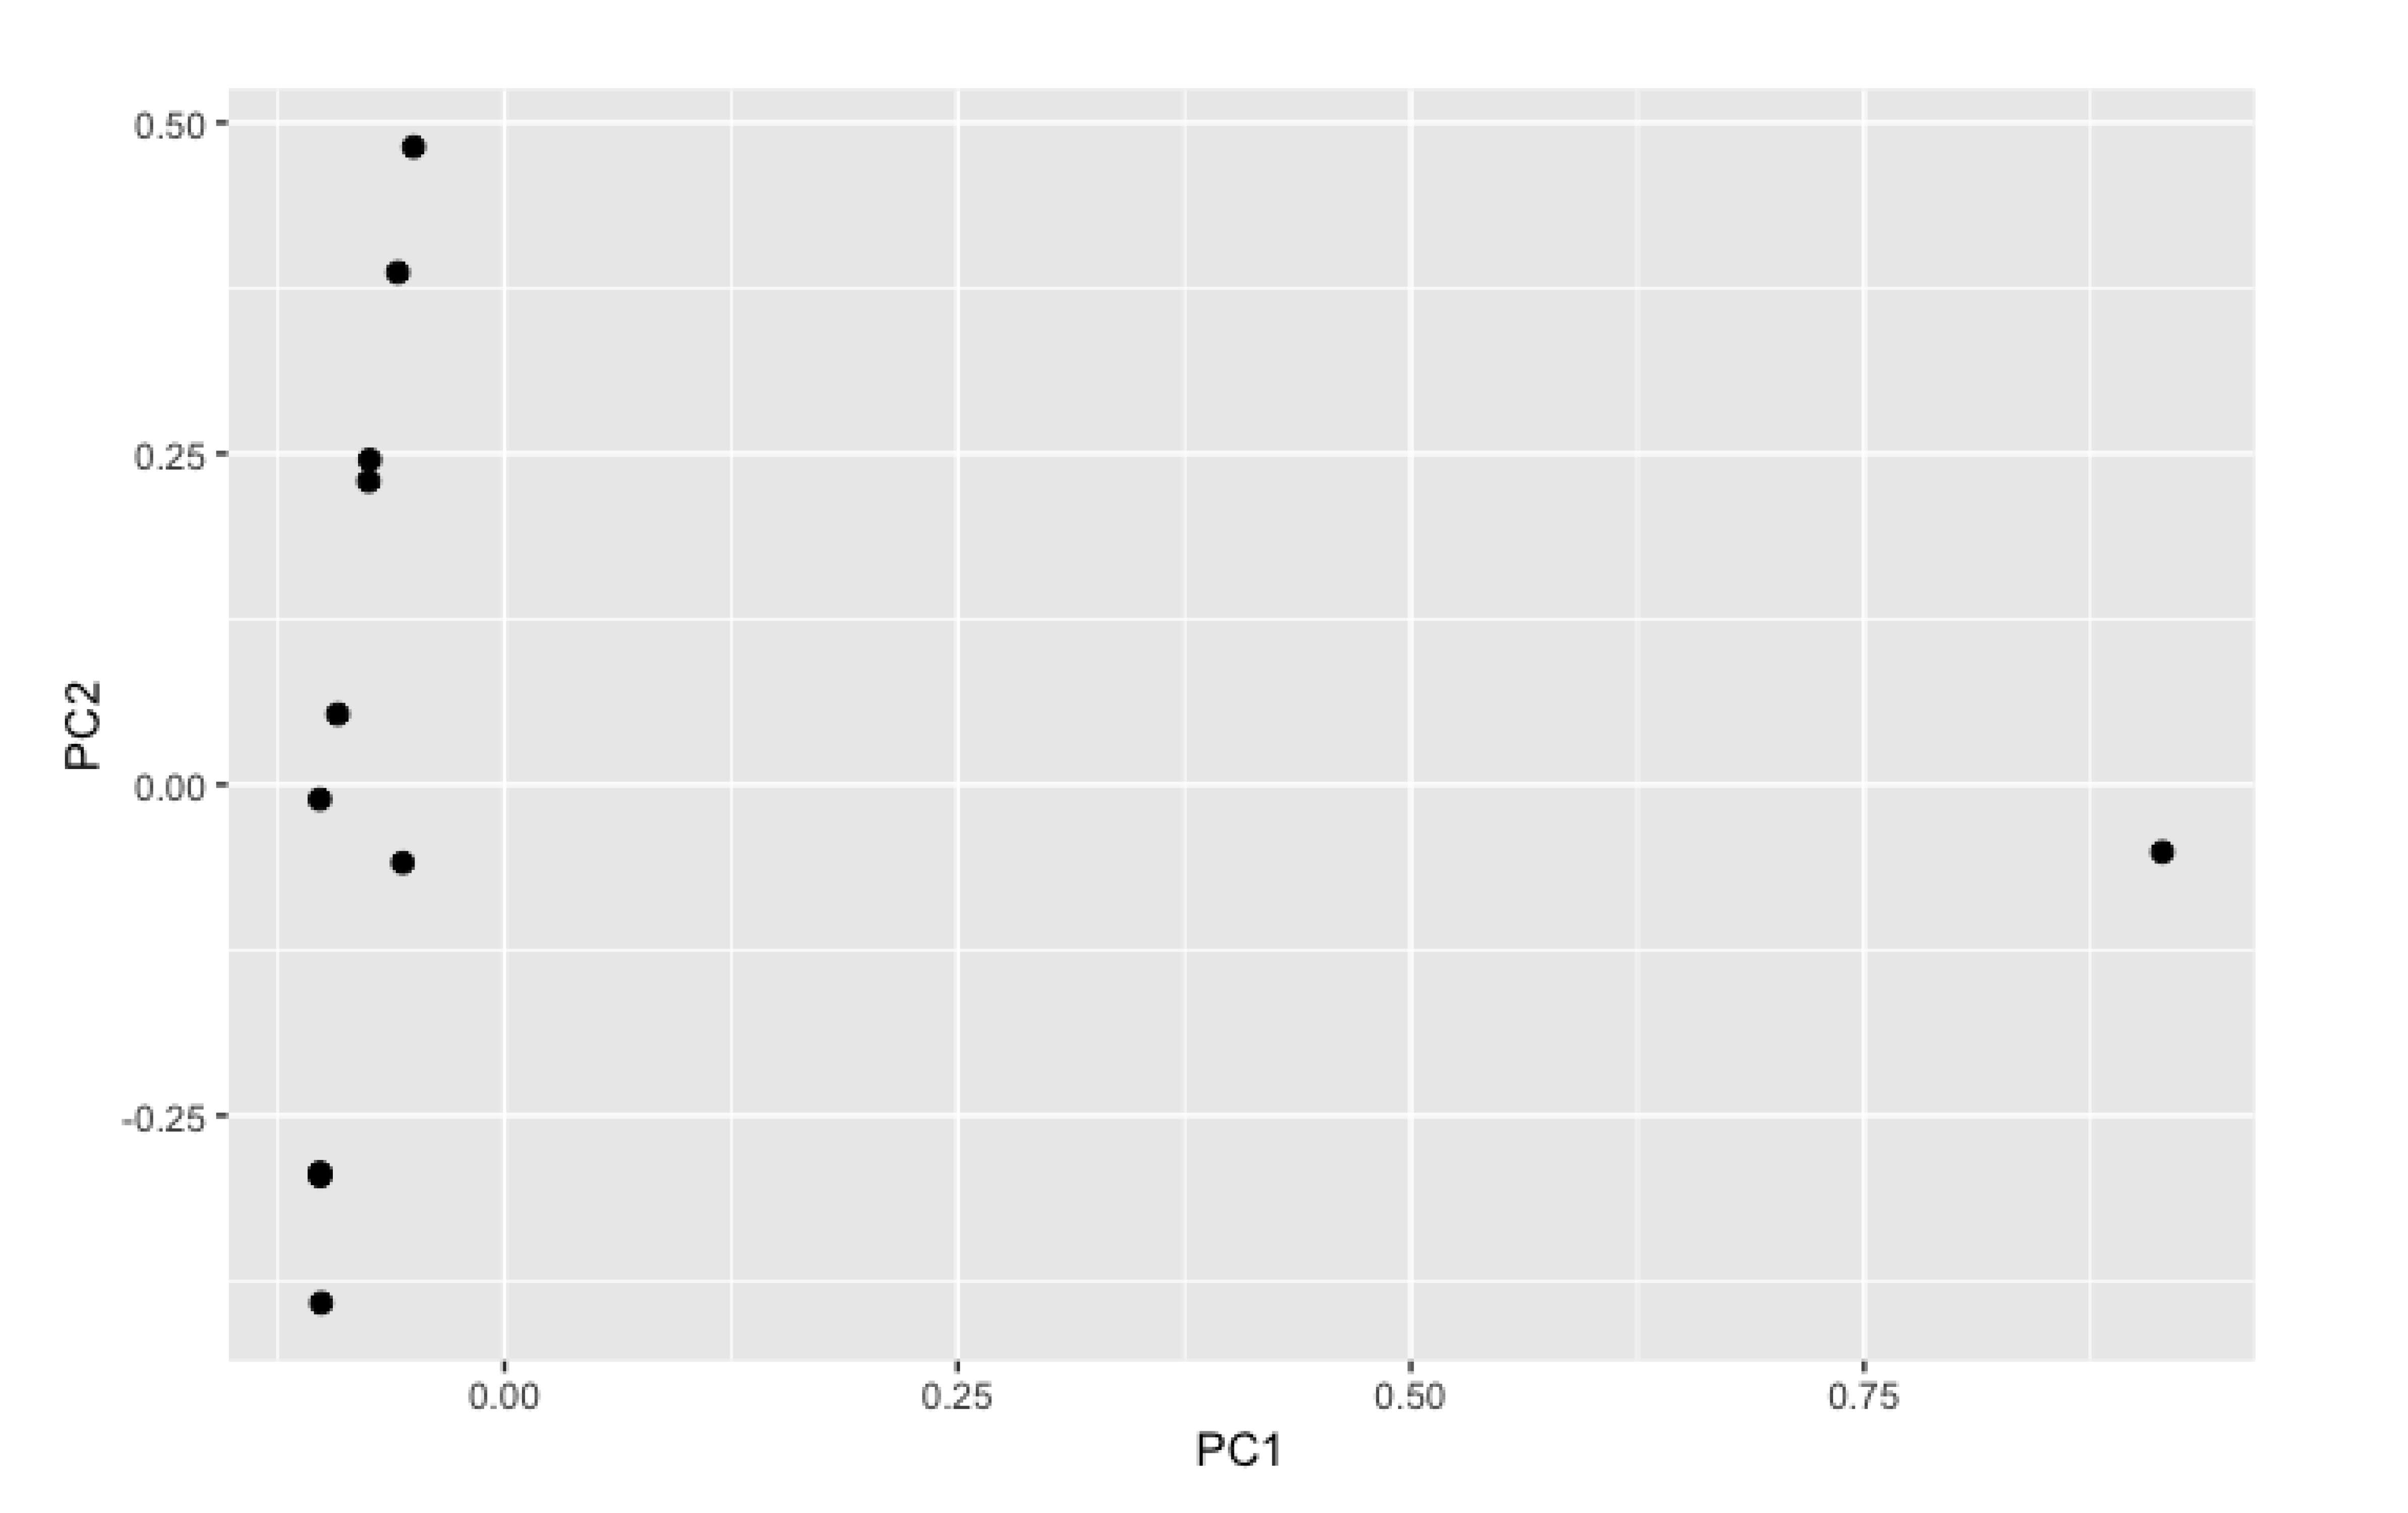
Based on the histopathology and molecular analysis, 43 patients were confirmed as IDH-wildtype, and the remaining 62 patients as IDH-mutant. Fig. 2 shows structural, MT and APTw MR images for two grade III gliomas with IDH-wildtype and IDH-mutant. Demographic and clinical characteristics showed no significant difference between the training set and validation set. However, the IDH-wildtype cohort showed significant higher age and higher WHO grade compared with IDH mutant group. Thus, we added age and WHO grade when building a classifier. IDH genotype prediction using the SVM model achieved accuracies of 100% (AUC = 1) in the test set. The 10 features (Age, Grade, APTw_Mean, APTw_10th percentile, APTw_25th percentile, MT_75th percentile, Dissimilarity, Run percentage, Hyper_APTw, and APTw/MT) that contributed most to the model are presented as a PCA plot in Fig. 3.Conclusion
Our SVM model presented here achieved an accuracy of 100% in the test set. Features exacted from APTw and MT MR images combined with age and WHO grade yielded the highest predictive performance in WHO grade II and III gliomas. The findings of our study support the use of textures extracted from APTw and MT MRI to aid the accurate diagnostic classification of IDH genotype.Acknowledgements
No acknowledgement found.References
1. Louis DN, Perry A, Reifenberger G, von Deimling A, Figarella-Branger D, Cavenee WK, Ohgaki H, Wiestler OD, Kleihues P, Ellison DW. The 2016 World Health Organization classification of tumors of the central nervous system: a summary. Acta Neuropathol 2016;131:803-820.
2. Yan H, Parsons DW, Jin G, McLendon R, Rasheed BA, Yuan W, Kos I, Batinic-Haberle I, Jones S, Riggins GJ, Friedman H, Friedman A, Reardon D, Herndon J, Kinzler KW, Velculescu VE, Vogelstein B, Bigner DD. IDH1 and IDH2 mutations in gliomas. N Engl J Med 2009;360:765-773.
3. Zhang B, Chang K, Ramkissoon S, Tanguturi S, Bi WL, Reardon DA, Ligon KL, Alexander BM, Wen PY, Huang RY. Multimodal MRI features predict isocitrate dehydrogenase genotype in high-grade gliomas. Neuro Oncol 2017;19:109-117.
4. Eichinger P, Alberts E, Delbridge C, Trebeschi S, Valentinitsch A, Bette S, Huber T, Gempt J, Meyer B, Schlegel J, Zimmer C, Kirschke JS, Menze BH, Wiestler B. Diffusion tensor image features predict IDH genotype in newly diagnosed WHO grade II/III gliomas. Sci Rep 2017;7:13396.
5. Zhou J, Payen J, Wilson DA, Traystman RJ, van Zijl PCM. Using the amide proton signals of intracellular proteins and peptides to detect pH effects in MRI. Nature Med 2003;9:1085-1090.
6. Strzelecki M, Szczypinski P, Materka A, Klepaczko A. A software tool for automatic classification and segmentation of 2D/3D medical images. Nucl Instrum Meth A 2013;702:137-140.
7. Aerts HJWL, Velazquez ER, Leijenaar RTH, Parmar C, Grossmann P, Cavalho S, Bussink J, Monshouwer R, Haibe-Kains B, Rietveld D, Hoebers F, Rietbergen MM, Leemans CR, Dekker A, Quackenbush J, Gillies RJ, Lambin P. Decoding tumour phenotype by noninvasive imaging using a quantitative radiomics approach. Nat Commun 2014;5.
Figures