0892
Abundance of cell bodies can explain the stick model’s failure in grey matter at high b-value1Computer Science Department and Centre for Medical Imaging Computing, University College London, London, United Kingdom, 2Champalimaud Neuroscience Programme, Champalimaud Centre for the Unknown, Lisbon, Portugal
Synopsis
This work investigates the validity of the stick model used in diffusion-weighted MRI for modelling cellular projections in brain tissue. We hypothesize that the model will fail to describe the signals from grey matter due to an abundance of cell bodies. Using high b-value (≥3 ms/µm2) data from rat and human brain, we show that the assumption fails for grey matter. Using diffusion simulation in realistic digital models of neurons/glia, we demonstrate the breakdown of the assumption can be explained by the presence of cell bodies. Our findings suggest that high b-value data may be used to probe cell bodies.
Introduction
We examine the validity of a standard assumption in modelling the relationship between brain tissue microstructure and diffusion-weighted MRI (DW-MRI) data. Specifically, from the water diffusion standpoint, it has been conjectured that the neuronal and glial projections (neurites) can be modelled as sticks1-4. If this stick model is valid, then the decay of the direction-averaged normalized signal, S, at high b values (b≥3 ms/µm2) is expected to follow the distinctive behaviour4,5:
$$$S(b)\approx f_{intra}(\frac{\pi}{4bD_{intra}})^{1/2}erf[(bD_{intra})^{1/2}]+\gamma\approx\beta b^{\alpha}+\gamma$$$, with α=-1/2 and β,γ≥0 (1)
where fintra and Dintra are the intra-neurites volume fraction and (axial) diffusivity, respectively, β$$$\propto$$$fintra/(Dintra)1/2 and γ fraction of fully restricted water. The extra-neurites contribution is assumed to decay exponentially faster than the intra-neurites one, and can be neglected for large b5,6. Testing the validity of the power-law (1) is challenging, because high b values over a few orders of magnitude are required. While recent studies5,6 suggested that relation (1) may hold in white matter (WM), a distinctively faster decay in grey matter (GM) was observed, with α<-1/2 and/or γ<0. We hypothesise that cell bodies, namely soma, may be responsible for this observed violation. We assess the role of size/density of soma in these experimental findings using numerical simulations and a comparison with experimental data from rat and human brain.
Methods
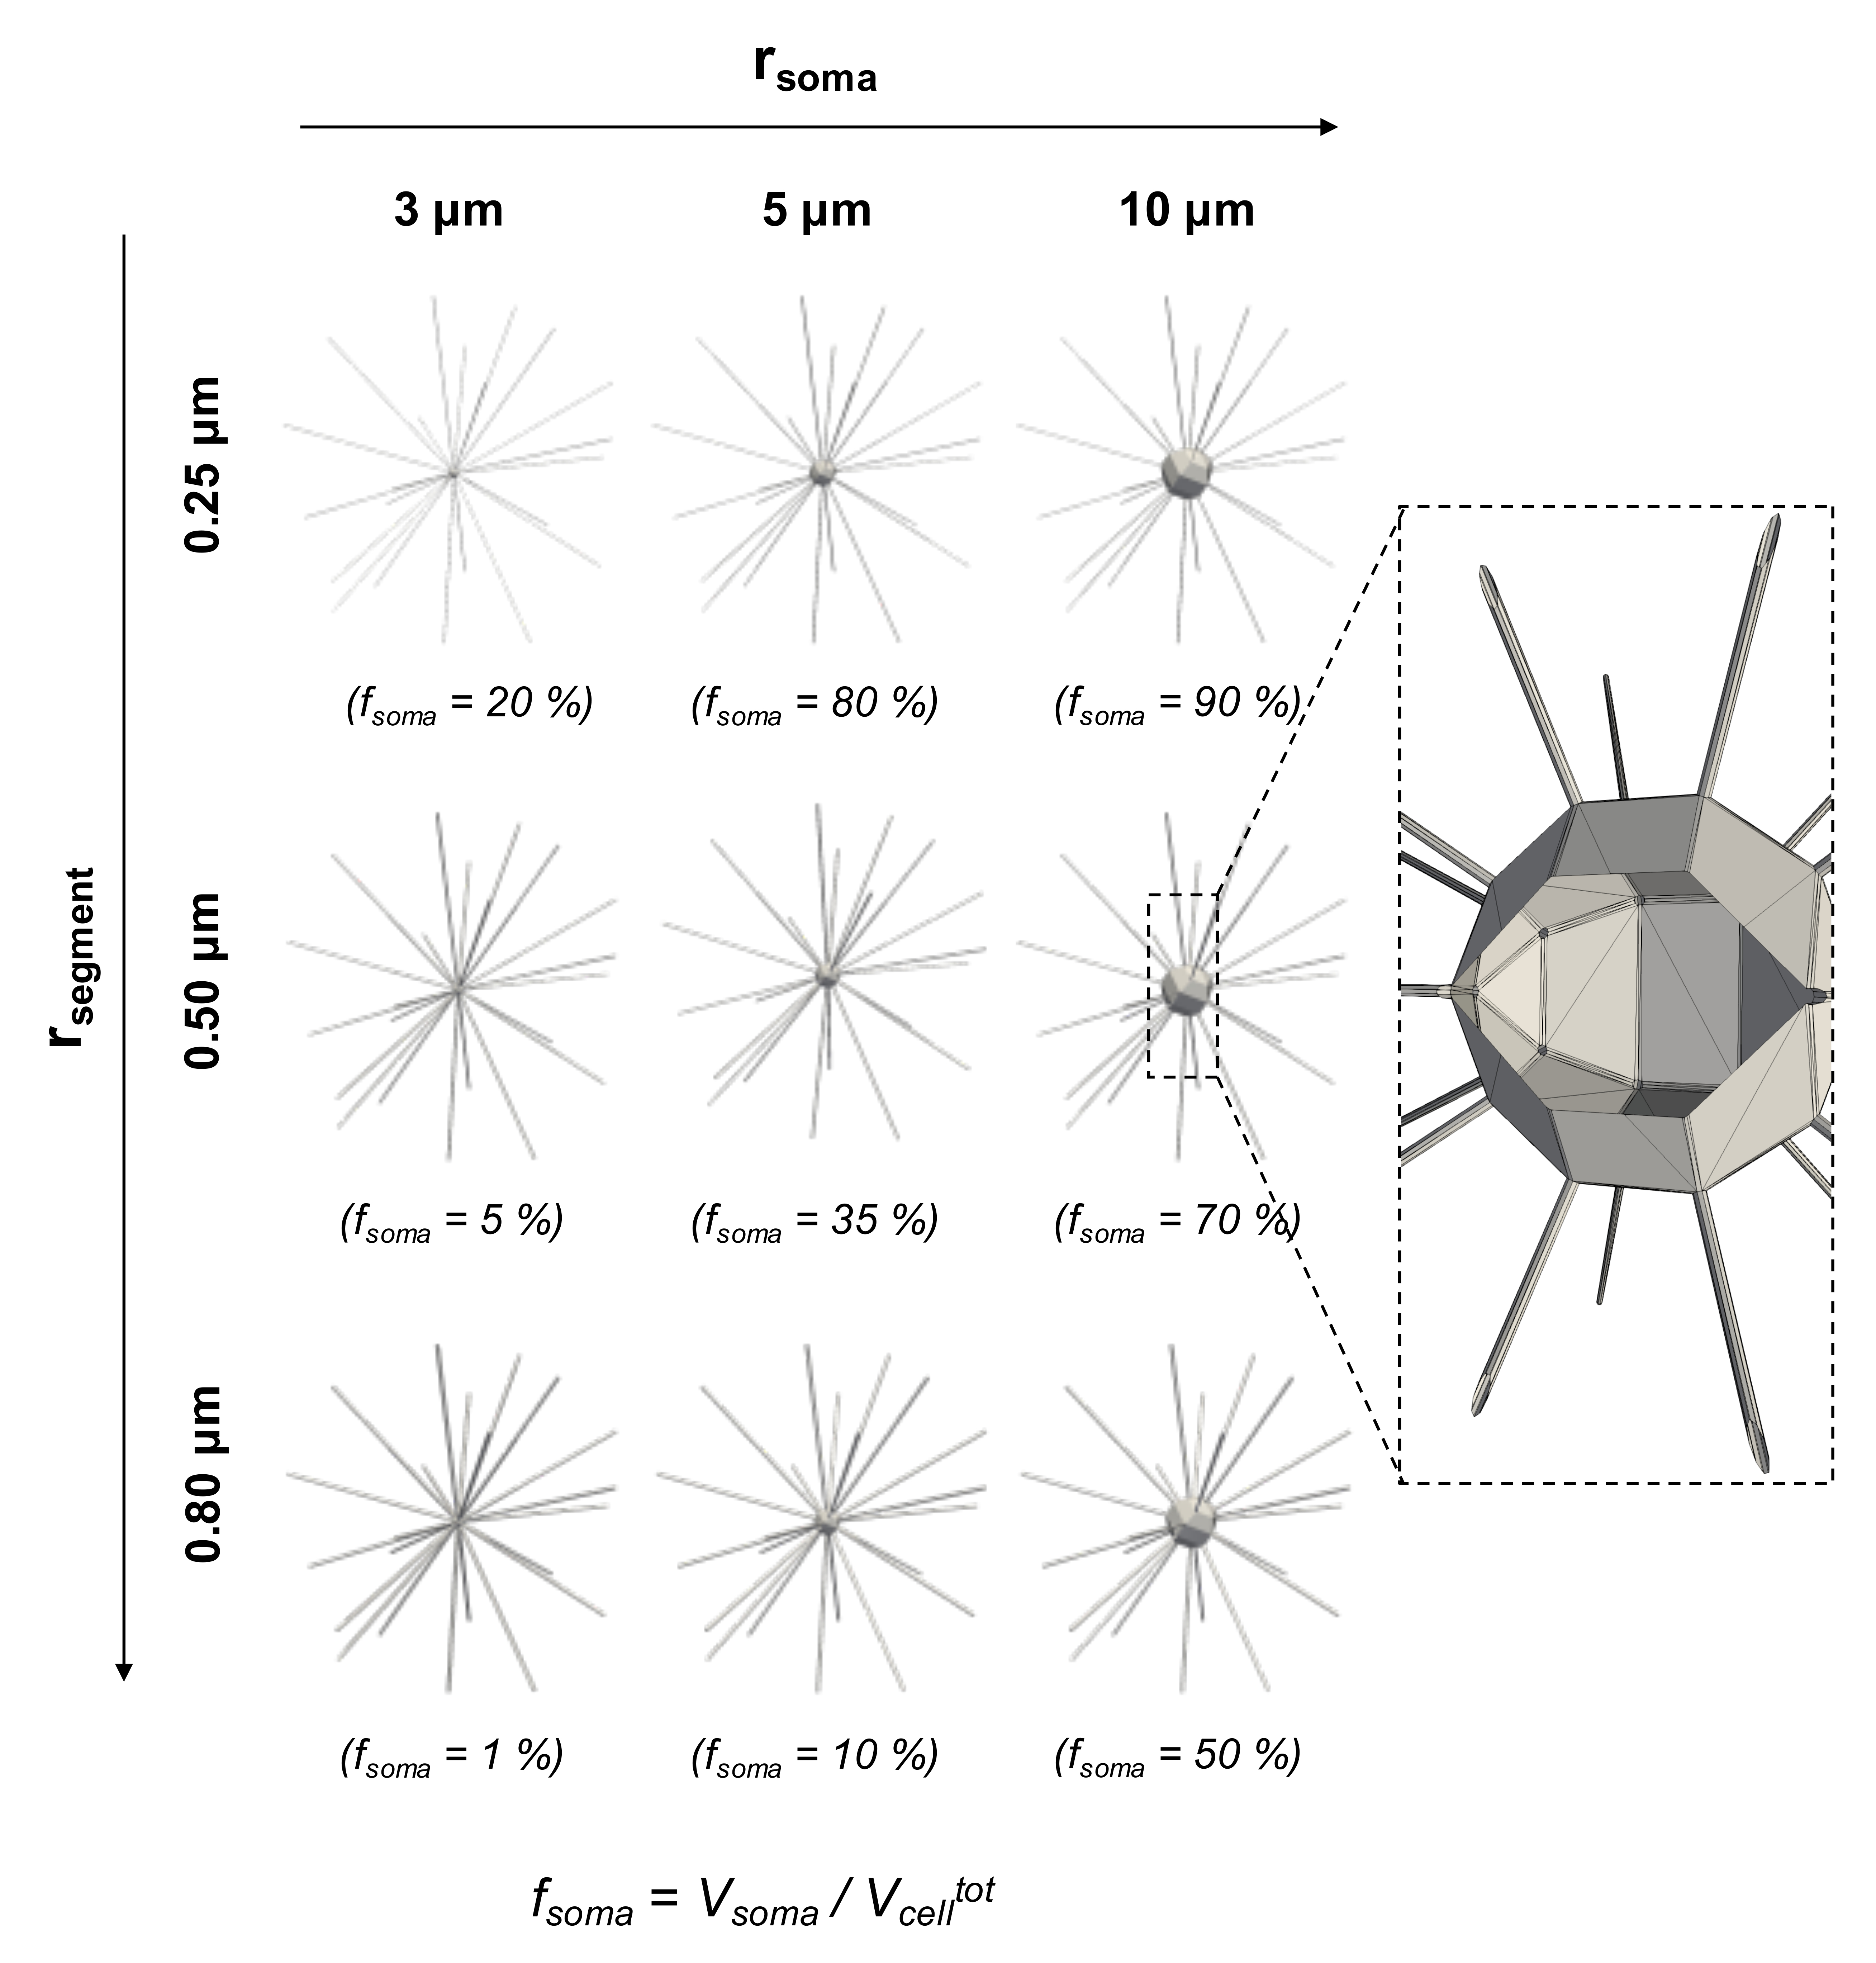
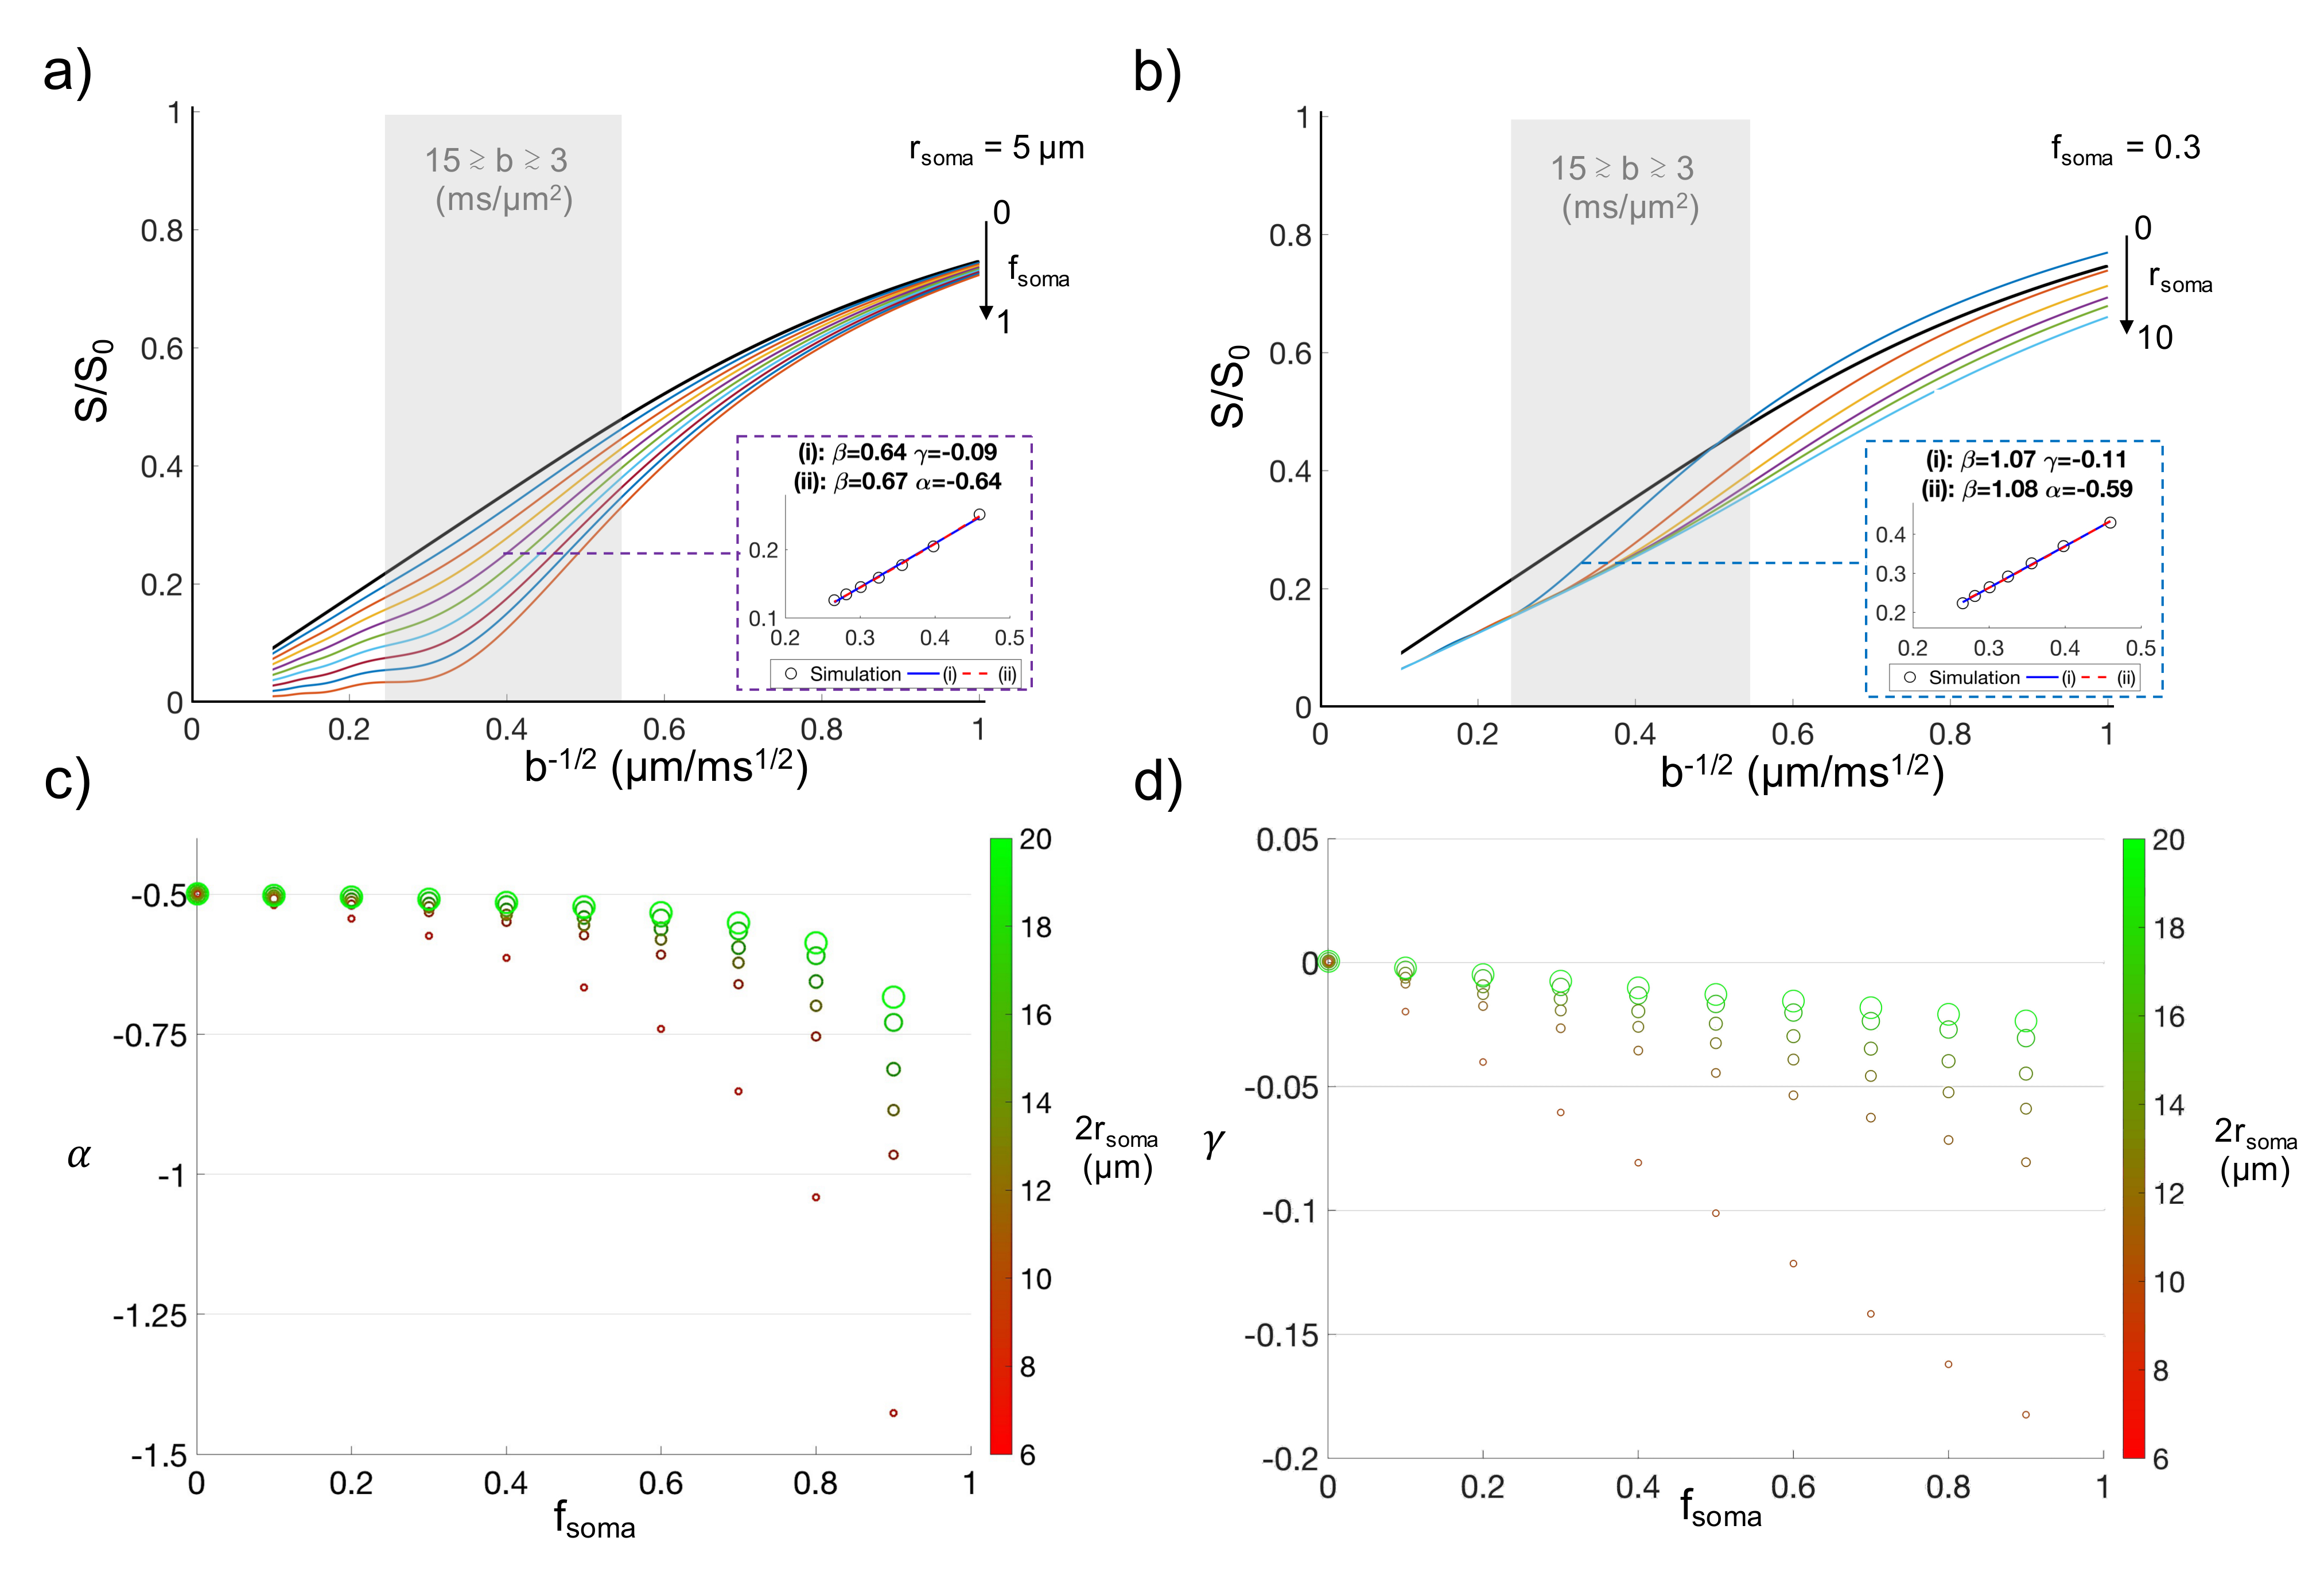
Numerical simulations. Diffusion simulation in realistic digital models of dendritic structures were first conducted to investigate the influence of soma size/density (rsoma/fsoma) in a controlled fashion. Detailed three-dimensional geometries were constructed to mimic realistically connected neurites, in different (rsoma,fsoma) conditions (Fig.1). The DW-MRI signals, as measured by a Pulsed-field-Gradients Spin-Echo (PGSE) sequence, were computed in CAMINO7 for 103 b-values from 0 to 100 ms/µm2 and 60 directions, uniformly distributed over the sphere. The direction-averaged signal as a function of b was then computed (Fig.2). Gradient-pulse duration/separation: δ/Δ=10/20 ms were chosen to be compatible with the experimental datasets. Note that here we focus on intracellular water diffusion only, because, with this model, the effects of extracellular diffusion and membrane permeability were shown to be negligible at high b-values5 and short diffusion times8.
Experimental Data. Our numerical results were compared with data from healthy rat and human brain. An ex-vivo rat brain was scanned using a PGSE sequence on a 16.4T (Bruker/Aeon), with: TE/TR=18/8000 ms; δ/Δ=4/7 ms; 16 b-values from 0 to 15 ms/µm2, 10 uniformly distributed diffusion-encoding directions per b value. One subject (age=25-29) from the MGH Adult Diffusion Dataset (https://www.humanconnectome.org) was analysed. The dataset9 was acquired at 3T (Siemens/Connectom) with b=1,3,5,10 ms/µm2 and respectively 64, 64, 128 and 256 uniformly distributed diffusion-encoding directions; five b=0; TE/TR=57/8800 ms; δ/Δ=13/22 ms. Both datasets were corrected for motion and eddy-currents using FSL (https://fsl.fmrib.ox.ac.uk/fsl), and the direction-averaged DW-MRI signal computed.
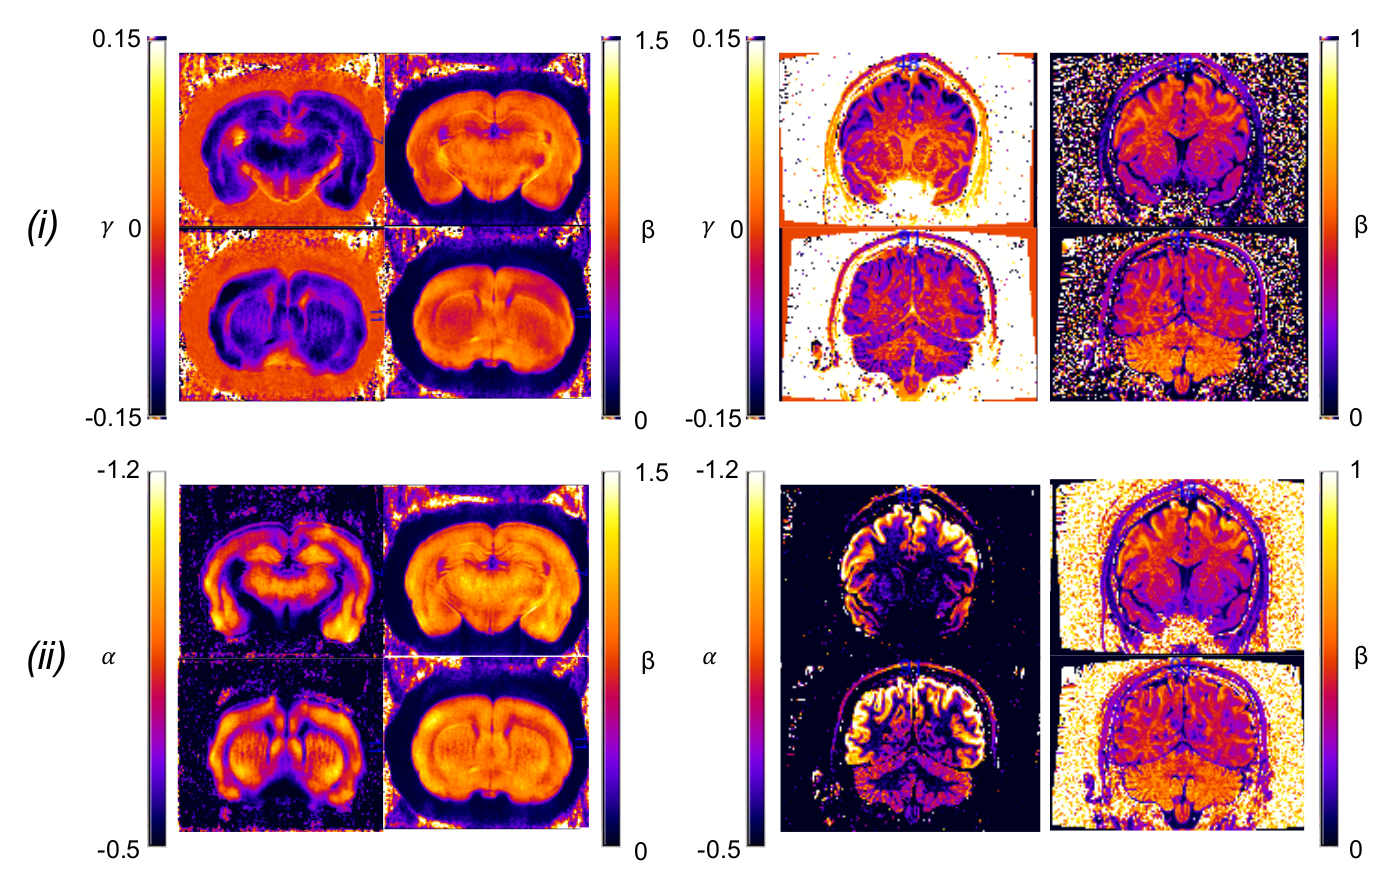
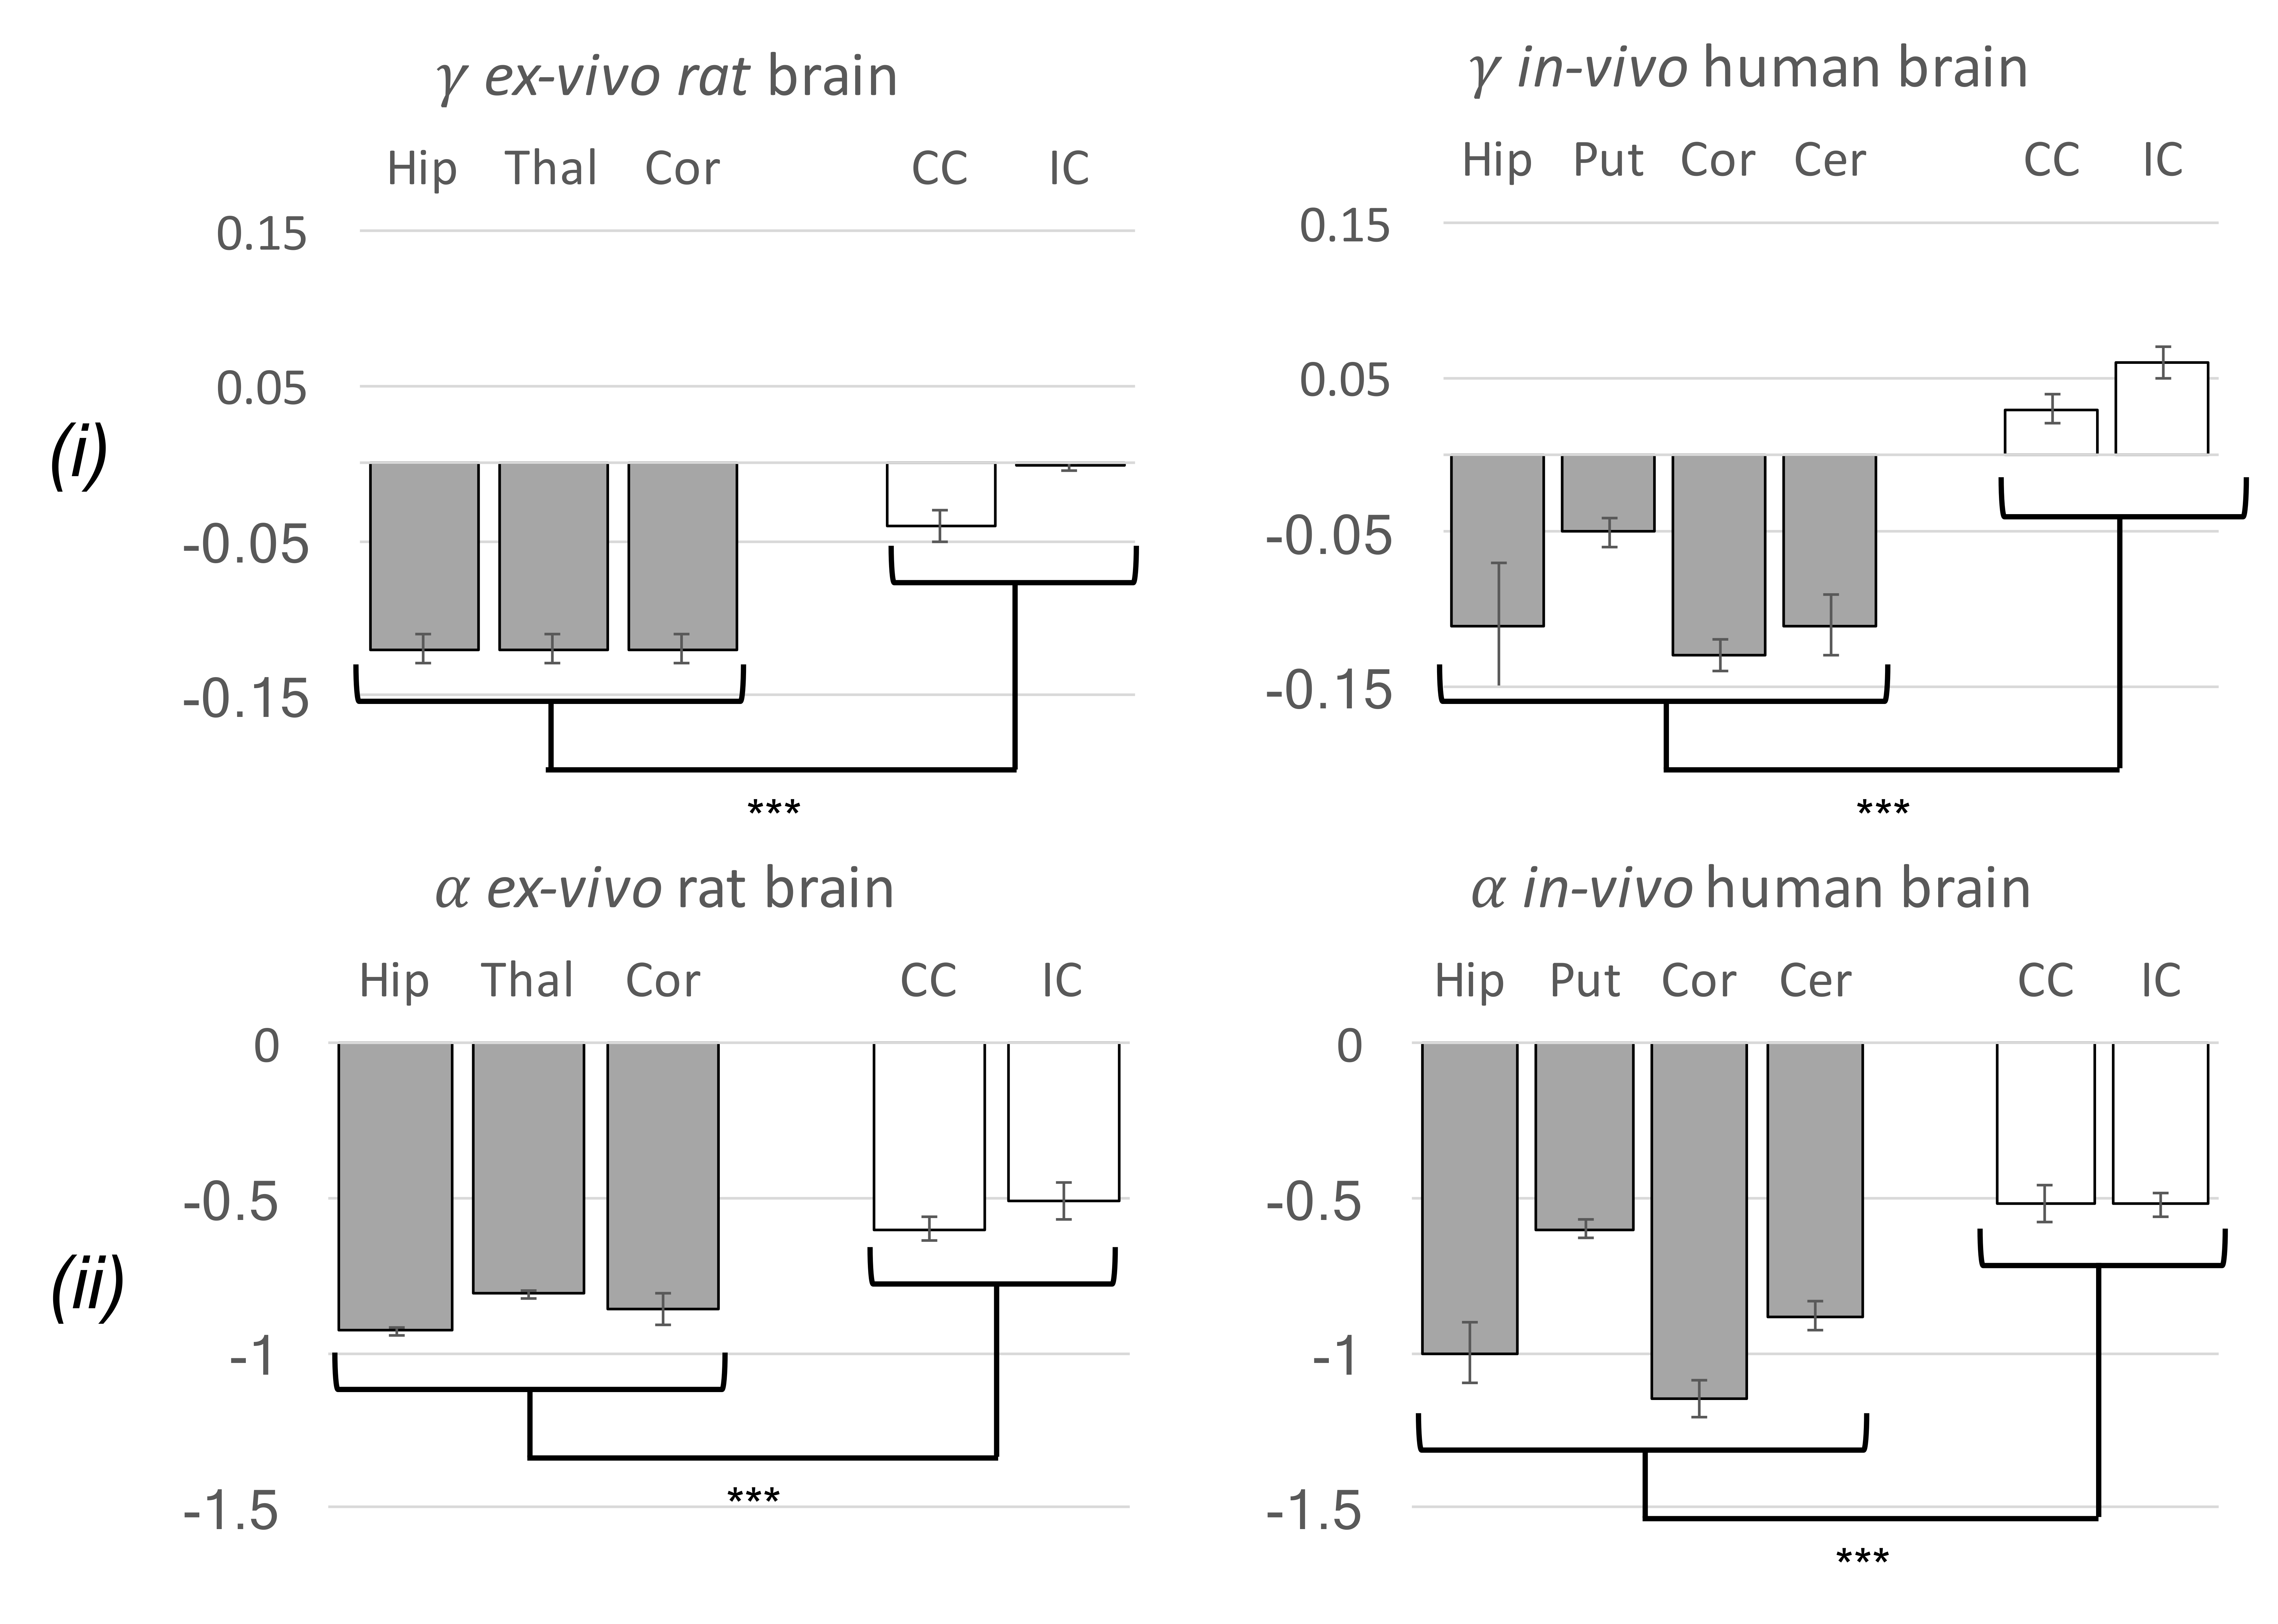
Data analysis. To investigate the validity of the stick model for different controlled (rsoma,fsoma) conditions, relation (1) was fitted to simulated signals (for 3≤b≤15 ms/µm2), using the two approaches shown to provide the best performance5: (i) fixing α=-1/2 and fitting β and γ; (ii) fixing γ=0 and fitting α and β (insets in Fig.2-a,b). The stick model is considered valid if α=-0.50±0.05 and γ≥-0.025 (assuming an experimental uncertainty of 10%). The same approach was used to analyse the two experimental datasets, from which α, β and γ maps were obtained (Fig.3). To verify the validity of the stick model in WM and GM, a region-of-interest based statistical analysis of α and γ values was performed (Fig.4).
Results
Our results show that, within the experimentally accessible window for human studies, relation (1) fails in the case of non-negligible soma presence (fsoma>0.2), independently of the fitting approach used (Fig.2-c,d). Indeed, both the approaches (i) and (ii) perform equally well for rsoma≤10 µm and fsoma≤0.6 (inset Fig.2-a,b). The estimated α and γ values seem to be consistently biased by the presence of soma (Fig.2-c,d). The bias predicted by simulations is confirmed by experimental results reported in Fig.3,4, where the estimated γ and α values in GM and WM with approach (i) and (ii) are γGM≤γWM≥-0.025 and αGM≤αWM≈-0.50±0.05.Discussion and Conclusion
This work suggests that, in the region 3≤b≤15 ms/µm2, the direction-averaged DW-MRI signal may contain useful information about the soma size and density. We show that 1) the stick model fails for GM, known to be comprised of mostly soma and non-myelinated neurites; 2) the failure can be due to the presence of soma, although we cannot exclude other factors like neurites' curvature and branching.
This study provides insights for interpreting the direction-averaged DW-MRI of the central nervous system, aiding in acquisition strategy design and improved biophysical models for brain microstructure estimation.
Acknowledgements
This work was supported by EPSRC (EP/G007748, EP/I027084/01, EP/L022680/1, EP/M020533/1, N018702), EPSRC EP/M507970/1 and ERC under the European Union’s Horizon 2020 research and innovation programme (Starting Grant, agreement No. 679058). We like to acknowledge Dr. Ekaterina Vinnik for ex-vivo data acquisition.References
1 Zhang H, et al. NODDI: practical in vivo neurite orientation dispersion and density imaging of the human brain. Neuroimage 2012; 61 (4): 1000-1016.
2 Jespersen S N, Kroenke C D, Østergaard L, Ackerman J J, Yablonskiy D A. Modeling dendrite density from magnetic resonance diffusion measurements. Neuroimage 2007; 34(4): 1473-1486.
3 Assaf Y, Freidlin R Z, Rohde G K, Basser P J. New modeling and experimental framework to characterize hindered and restricted water diffusion in brain white matter. Mag. Reson. Med. 2004; 52(5): 965-978.
4 Kaden E, Kruggel F, Alexander D C. Quantitative mapping of the per‐axon diffusion coefficients in brain white matter. Mag. Reson. Med. 2016; 75(4): 1752-1763.
5 Veraart J, Fieremans E, Novikov D S. Universal power-law scaling of water diffusion in human brain defines what we see with MRI. arXiv preprint 2016; arXiv:1609.09145.
6 McKinnon E T, Jensen J H, Glenn G R, Helpern J A. Dependence on b-value of the direction-averaged diffusion-weighted imaging signal in brain. Mag. Reson. Imag. 2017; 36: 121-127.
7 Cook P A, Bai Y, Nedjati-Gilani S K K S, Seunarine K K, Hall M G, Parker G J, Alexander D C. Camino: open-source diffusion-MRI reconstruction and processing. In 14th scientific meeting of the international society for magnetic resonance in medicine 2004 (Vol. 2759). Seattle WA, USA.
8 Yang D M, Huettner J E, Bretthorst G L, Neil J J, Garbow J R, Ackerman J J H. Intracellular water preexchange lifetime in neurons and astrocytes. Magn. Reson. Med. 2017; doi:10.1002/mrm.26781
9 Setsompop K, Kimmlingen R, Eberlein E, Witzel T, Cohen-Adad J, McNab JA, et al. Pushing the limits of in vivo diffusion MRI for the human connectome project. NeuroImage 2013; 80: 220–33.
Figures