0882
Cross-vendor harmonization of T2-Relaxation-Under-Spin-Tagging (TRUST) MRI for the assessment of cerebral venous oxygenation1Department of Biomedical Engineering, Johns Hopkins University School of Medicine, Baltimore, MD, United States, 2The Russell H. Morgan Department of Radiology & Radiological Science, Johns Hopkins University School of Medicine, Baltimore, MD, United States, 3Graduate School of Biomedical Sciences, University of Texas Southwestern Medical Center, Dallas, TX, United States, 4F. M. Kirby Research Center for Functional Brain Imaging, Kennedy Krieger Research Institute, Baltimore, MD, United States
Synopsis
Cerebral venous oxygenation (Yv) is an important physiological parameter and has potential clinical application in many diseases. T2-relaxation-under-spin-tagging (TRUST) is a commonly used MRI method to measure Yv. Harmonization of TRUST across MRI vendors is important for dissemination and multi-center studies of brain oxygenation as a disease biomarker. In this work, we harmonized TRUST pulse sequence components and imaging parameters across two major MRI vendors, Philips and Siemens. We showed that Yv measured on the two vendors were highly compatible and strongly correlated, had excellent reproducibility, and can reliably detect oxygenation changes associated with physiological challenges on both scanners.
Introduction
Cerebral venous oxygenation (Yv) is an important physiological parameter for brain’s metabolism, and can be used to estimate key physiological markers such as oxygen extraction fraction (OEF) and cerebral metabolic rate of oxygen (CMRO2).1 T2-relaxation-under-spin-tagging (TRUST) is a commonly used MRI method to measure Yv,2 and has shown clinical utility in Alzheimer’s disease,3 multiple sclerosis,4 sickle cell disease,5 and other brain pathologies. However, in the era of “big-data” medicine, many major studies of diseases are based on a multi-site and multi-vendor setting, such as the ADNI, UK Biobank, and ABCD study. Harmonization of the TRUST technique across MRI vendors is therefore important for dissemination and multi-center studies of brain oxygenation and metabolism as a disease biomarker. The goal of the present work is to conduct a harmonization study to evaluate compatibility of TRUST results across two major MRI vendors.Methods
Pulse sequence: The TRUST sequence was implemented on two 3T platforms, a Philips system (Achieva) and a Siemens system (Prisma). Pulse sequence components including RF pulse width and gradient strength were carefully matched between the two platforms. TRUST imaging parameters were largely matched on both scanners and were based on the optimized protocol reported previously,6 except that echo time (TE) was 3.6ms on Philips but 6.5ms on Siemens. This TE difference was attributed to different acquisition schemes used in the product sequences of the two vendors.
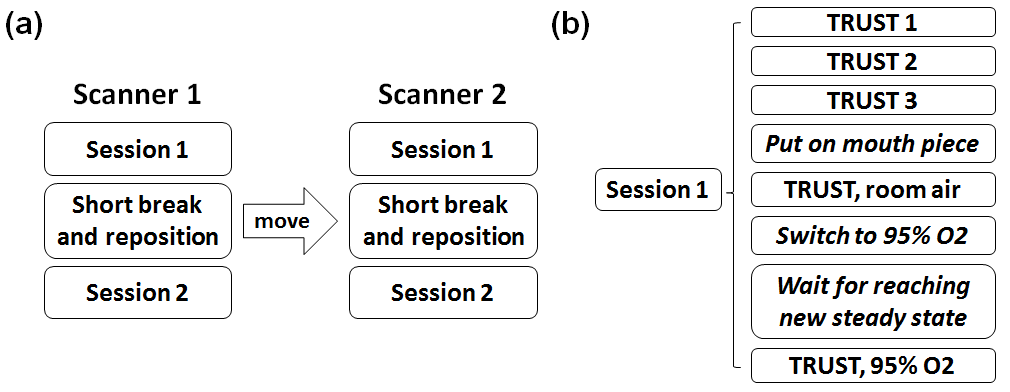
Experiment: Ten healthy volunteers (24.0±3.2 years old) participated in this study. Each subject was scanned on a Philips and a Siemens scanner within 2.5 hours (Figure 1). The order of Philips and Siemens scans were counterbalanced across subjects. On each scanner, to quantify inter-session variability, each subject was scanned twice with a short break and repositioning between two identical sessions. Within each session, the subject first underwent 3 TRUST scans to evaluate intra-session variability. Then the subject was fitted with a nose clip and mouthpiece to ensure mouth breathing. One TRUST scan was acquired under normoxia, and then another TRUST scan was performed during hyperoxia challenge.
Data analysis: The TRUST MRI data were processed following the procedures described previously.2,6,7 Confidence interval of the estimated Yv (εYv) was computed.7 Intra-session and inter-session coefficient of variation (CoV) were calculated for each scanner. Inter-scanner CoV was also calculated.
Results
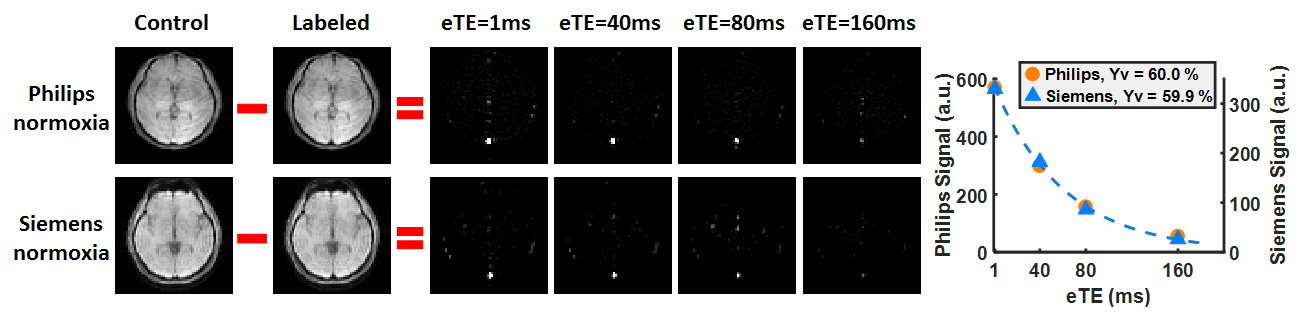
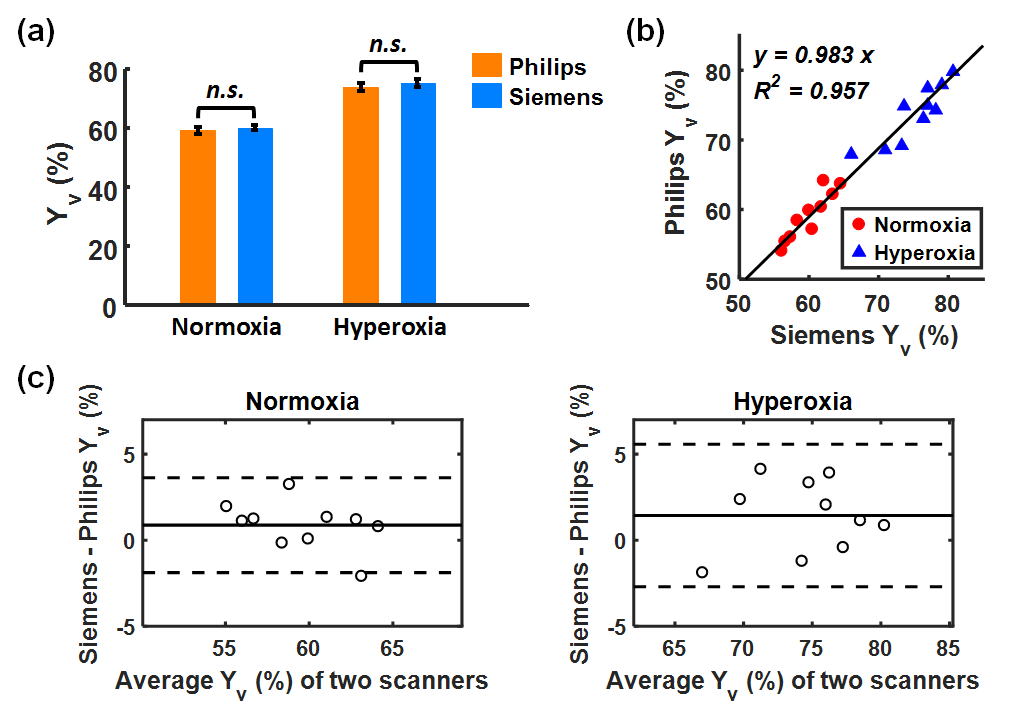
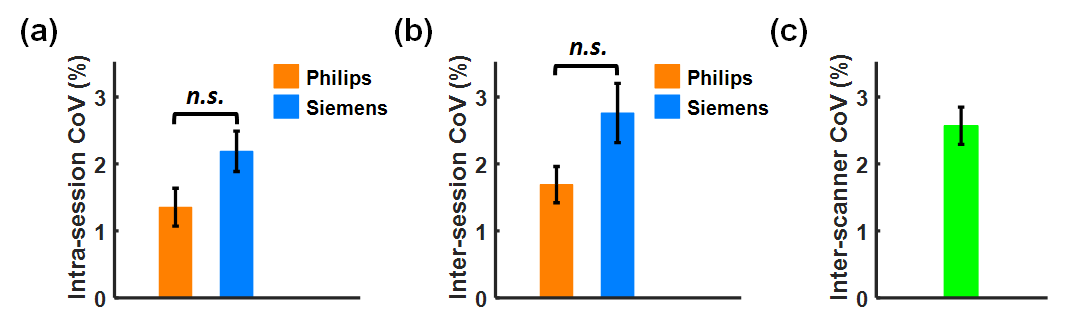
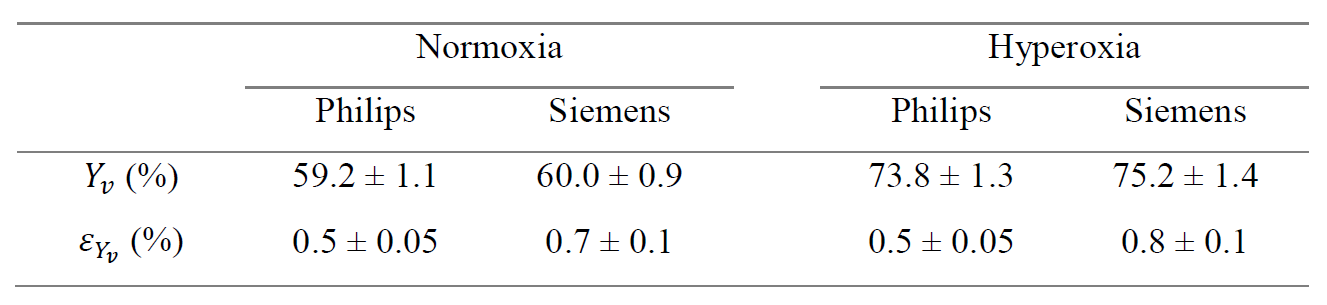
Figure 2 shows TRUST data from a representative subject, including both Philips and Siemens results under normoxia. The subtraction of control and labeled images revealed strong venous signals. The plots on the far-right display signal values as a function of effective echo time (eTE). Table 1 summarizes the measured Yv and εYv across all participants. Yv measured on Philips and Siemens scanners showed no significant (n.s.) difference under either normoxia or hyperoxia (Figure 3a), and were strongly correlated (R2=0.957) (Figure 3b). Bland-Altman plots (Figure 3c) also demonstrate consistency between the two platforms. Hyperoxia-induced Yv change (ΔYv) was 14.2±1.0% (P<0.001) on Philips and 15.8±1.3% (P<0.001) on Siemens, showing no significant difference between scanners. εYv was significantly higher on Siemens (P<0.01), which was attributed to the longer TE used on Siemens. Figure 4 presents intra-session, inter-session, and inter-scanner CoV of Yv on the two scanners. Intra-session and inter-session CoV on Philips were slightly lower, although the differences were not significant. Inter-scanner CoV was 2.6±0.3%, which is considered excellent for a physiological measure like Yv.
To investigate the physiological mechanisms underlying the inter-subject variations in Yv, we recorded end-tidal CO2 (EtCO2) of each subject during the experiment. A linear mixed-effects model analysis revealed a positive association (P=0.021) between Yv and EtCO2 across subjects, suggesting that inter-subject variations in Yv may be attributed to differences in their EtCO2 values.
Additionally, to further investigate the reason for the cross-vendor differences in the precision of the Yv estimation (i.e. εYv), we modified the Siemens acquisition module to shorten the TE to 3.9ms. In three newly recruited subjects, we found that shortening the TE to 3.9ms on Siemens yielded a εYv of 0.46±0.07%, which was comparable to the values (0.41±0.07%) measured on Philips in the same participants.
Discussion and Conclusion
The present work performed a harmonization of TRUST MRI across two major vendors. To our knowledge, this is the first report of cross-vendor studies of MRI-based oximetry. The results demonstrated that the estimated Yv values were highly compatible across scanners, with excellent test-retest reproducibility for intra-session, inter-session, and inter-scanner comparisons. The sequence can reliably detect hyperoxia-induced Yv changes on both scanners. These findings suggest that TRUST MRI has the potential to be used as a non-invasive imaging biomarker in brain diseases.Acknowledgements
No acknowledgement found.References
1. Xu F, Ge Y, Lu H. Noninvasive quantification of whole-brain cerebral metabolic rate of oxygen (CMRO2) by MRI. Magn Reson Med 2009;62:141-148.
2. Lu H, Ge Y. Quantitative evaluation of oxygenation in venous vessels using T2-Relaxation-Under-Spin-Tagging MRI. Magn Reson Med 2008;60:357-363.
3. Thomas BP, Sheng M, Tseng BY, Tarumi T, Martin-Cook K, Womack KB, Cullum MC, Levine BD, Zhang R, Lu H. Reduced global brain metabolism but maintained vascular function in amnestic mild cognitive impairment. J Cereb Blood Flow Metab 2017;37:1508-1516.
4. Ge Y, Zhang Z, Lu H, Tang L, Jaggi H, Herbert J, Babb JS, Rusinek H, Grossman RI. Characterizing brain oxygen metabolism in patients with multiple sclerosis with T2-relaxation-under-spin-tagging MRI. J Cereb Blood Flow Metab 2012;32:403-412.
5. Watchmaker JM, Juttukonda MR, Davis LT et al. Hemodynamic mechanisms underlying elevated oxygen extraction fraction (OEF) in moyamoya and sickle cell anemia patients. J Cereb Blood Flow Metab 2016. doi: 10.1177/0271678X16682509:271678X16682509.
6. Xu F, Uh J, Liu P, Lu H. On improving the speed and reliability of T2-relaxation-under-spin-tagging (TRUST) MRI. Magn Reson Med 2012;68:198-204.
7. Liu P, Dimitrov I, Andrews T et al. Multisite evaluations of a T2-relaxation-under-spin-tagging (TRUST) MRI technique to measure brain oxygenation. Magn Reson Med 2016;75:680-687.
Figures