0881
Effect size and result overlap between individual and group results in fMRI studies1Radiology, UZ Brussel (VUB), Brussels, Belgium, 2Psychiatry, UZ Brussel, Brussel, Belgium, 3Psychiatry and Medical Psychology, UGent, Ghent, Belgium, 4Radiology, UZ Brussel, Brussels, Belgium
Synopsis
In the fMRI literature, most authors reported solely the significance of their findings which hampered the critical interpretation of the found results and power analyses for subsequent studies. To reveal the effect size and overlap between individual subject activation maps, we reanalyzed data from multiple fMRI studies. For each of the 44 contrasts tested, our study revealed fairly strong effect sizes and reasonable overlap between the individual results. However, the overlap between the individual results and the results of the corresponding group analysis was rather poor. This observation supports the call that reporting significance solely, is not enough.
Introduction
In recent papers1,2, it is shown that most authors solely reported the significance of their findings, while the accompanying effect sizes and overlap between individual subject results were seldom mentioned. However, knowledge of the effect size and individual results overlap, underlying the observed group effects, could have helped in the critical interpretation of the found results and to perform power analyses for subsequent studies1. To have some idea of the typical range of the effect size and overlap of individual activation maps for normal task-related brain activity in healthy subjects, we reanalyzed data taken from various fMRI studies from our own database3,4 and from the OpenfMRI repository5.Materials and methods
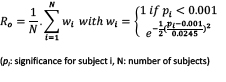
We reanalyzed the data from 2 studies3,4 done at our institution and 3 studies6,7,8 from the OpenfMRI.com database5. The sample size in the various studies varied from 10 to 40 healthy subjects. For each study, all individual datasets were processed in SPM12 and 2 to 12 basic contrasts between task conditions were defined. Based on the individual contrast maps, group analyses were performed. The individual and group activation maps were thresholded at p<0.001. The activation maps were transformed into Pearson correlation coefficients (R) and Cohan’s d-values (d) to determine the underlying effect sizes. To test the similarity between the individual results, threshold weighted overlap maps9 (Ro) were calculated as given in formula 1.
The overlap scores were separately tested in the voxels showing a significant activation in at least 1 subject (between subject results overlap) and in voxels showing a significant group effect (between subjects and group results overlap).
Results
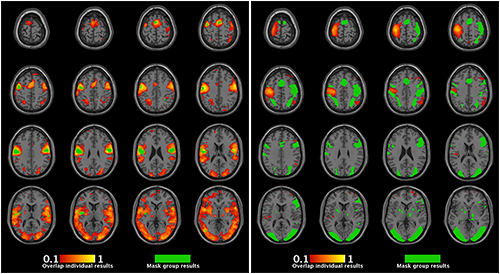
Over all tested contrasts, the mean effect size for the individual analyses was R=0.27 (SD=0.09, min=0.16, max=0.44) and d=0.67 (SD=0.34, min=0.33, max=1.57) and for the group analyses, R=0.53 (SD=0.11, min=0.54, max=0.87) and d=2.50 (SD=0.79, min=1.27, max=3.66). The mean effect size of the individual analyses measured in the voxels giving a significant group effect was R=0.09 (SD=0.08, min=-0.07, max=0.28) and d=0.24 (SD=0.13, min=0.09, max=0.63). The mean overlap score between the individual result maps was Ro=0.21 (SD=0.08, min=0.07, max=0.38) and between the individual and group results, Ro=0.06 (SD=0.11, min=0.00, max=0.48). The overlap test between the individual activation maps resulted on average in 24% (SD=20%, min=0%, max=72%) of the activated voxels with Ro<0.10 and 6% (SD=8%, min=0% max=26%) of the voxels with Ro>0.50. The overlap test comparing the individual results in voxels showing a group effect, resulted on average in 90% (SD=16%, min=34%, max=100%) of the voxels with Ro<0.10 and 7% (SD=14%, min=0%, max=61%) of the voxels with Ro>0.50. For an example of a result showing a good and bad overlap in the voxels showing a group effect, see figure 1.
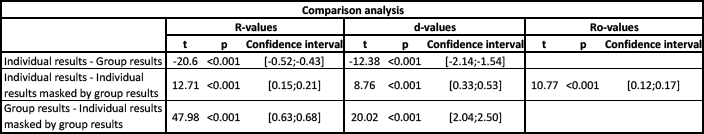
The results of the paired T-tests, comparing the effect size and overlap scores between the individual results, the group analysis results and the individual results in the voxels showing a group effect, are given in table 2.
Discussion
Our study showed in the individual analyses as well as in the group analyses large effect sizes. Surprisingly, the overlap between the individual result maps and the corresponding group activation map was worse than the overlap between the individual results. Moreover, the individual effect sizes measured in the voxels showing a group effect were markedly smaller than those found in the group or individual analyses. Our observations are striking since fMRI is known to have a large inter-individual variation9 while a group analyses are supposed to search for significant mean effects over all tested subjects. However, since we did not apply a multiple comparisons correction, we did expect to find a lot of false positive activations in the individual and group activation maps. Although, the effect size nor the overlap scores discriminated real from false results, it can be hypothesized that looking at these parameters at the individual subject level in the voxels showing a group effect, could help in identifying results revealing important effects in most of the tested subjects.Conclusion
In conclusion, our results support the call of Chen et al.1 and Guo et al.2 that the systematic reporting of effect sizes and overlap measures in addition to significance, would be helpful in the critical evaluation of observed group effects. However, our results also showed that it is most interesting to look at the size and overlap of the individual subject results underlying the observed group effects.Acknowledgements
No acknowledgement found.References
1. Chen G., Taylor A., Cox W. Is the statistical value all we should care about in neuroimaging? NeuroImage 2017;147:952-959
2. Guo Q., Thabane L., Hall G., McKinnon M., et al. A systematic review of the reporting of sample size calculations and corresponding data components in observational functional magnetic resonance imaging studies. NeuroImage 2014;86:172-181
3. Baeken C., Van Schuerbeek P., De Raedt R., et al. Passively viewing negatively valanced baby faces attenuates left amygdala activity in healthy females scoring high on ‘Harm Avoidance’. Neurosci. Letters 2010;478:97-101
4. Van Schuerbeek P., Baeken C., Luypaert R., et al. Does the amygdala response correlate with the personality trait ‘harm avoidance’ while evaluating emotional stimuli explicitly? Behav. Brain Funct. 2014;10:18
5. www.openfmri.org
6. Aron A.R., Behrens T.E., Smith S., et al. Triangulating cognitive control network using diffusion-weighted magnetic resonance imaging (MRI) and functional MRI. J. Neurosci. 2007;27(14):3743-3752 (This data was obtained from the OpenfMRI database. Its accession number is ds000008)
7. Unpublished data. (This data was obtained from the OpenfMRI database. Its accession number is ds000101)
8. Gorgolewski K.J., Storkey A., Bastin M.E., et al. A test-retest fMRI dataset for motor, language and spatial attention functions. Gigascience 2013;2:6 (This data was obtained from the OpenfMRI database. Its accession number is ds000114)
9. Seghier M.L., Price C.J. Visualizing inter-subject variability in fMRI using threshold-weighted overlap maps. Sci. Rep. 2016;6:20170
Figures