0880
Matrix Tri-Factorization for BOLD-fMRI1UCL, London, United Kingdom
Synopsis
We present Matrix Tri-Factorization as a means to obtain an individual's BOLD-fMRI decomposition into unique neuronal activation patterns, spatial network maps and their corresponding hemodynamic response functions. We validate our proposed method on the motor cortex localization task of the Human Connectome Project 1200 Subject Release and show that neural activation patterns from our proposed Unsupervised Machine Learning technique resemble the given motor task profiles.
Introduction
Functional Magnetic Resonance Imaging (fMRI) is a key neuroimaging technique in large cohort studies, allowing the analysis of healthy and pathological networks of brain function. The blood oxygenation level dependent (BOLD) effect is an indirect means to measure the change in neuronal activity. Matrix factorization techniques such as Independent Component Analysis [2] or recent Deep-Learning methods [3] have been applied to BOLD imaging to find the underlying composition of time course and spatial map of corresponding brain networks. However, these models neglect the separation of the time course into neural and BOLD signal origins and do not ordinarily model characteristics of the hemodynamic response function (HRF). Here, we propose a novel matrix tri-factorization approach which decomposes an individual task-fMRI scan into the underlying neural activity time courses, BOLD time courses, and spatial maps of respective brain networks. We validate our method on motor task-fMRI data from the Human Connectome Project (HCP) and show that individual components of the obtained matrix tri-factorization resemble the known patterns of the respective motor task[1].
Methods
Conventional ICA implementations such as FastICA and InfoMax approximate statistical independence with non-linear functions that are limited to either super- or supra-Gaussian distributions [4], and result in compressed hidden representations with the number of hidden components much lower than the number of scan volumes. The compression results in loss of variance. In constrast, our approach decomposes each individual scan matrix $$$X \in \mathbb R^{t\times v}$$$ with $$$t$$$ time points and $$$v$$$ voxels into an overcomplete basis set $$$\mathcal{H}\in\mathbb R^{c\times v}$$$ with dimension $$$c$$$ much greater than observed time points $$$t$$$, implicitly retaining all variance of the individual subject. Our generative model comprises a single overcomplete hidden layer. We map the original data matrix into this hidden layer and then reconstruct the data matrix from this layer. The quality of the reconstruction is measured by the $$$l2$$$ norm between the original data $$$X$$$ and its reconstruction $$$\hat{X}$$$. The Itakura-Saito divergence $$$\Delta$$$ between desired histogram distribution $$$p$$$ and actual histogram distribution $$$q$$$ with weighting hyper-parameter $$$\kappa$$$ prevents the algorithm from learning arbitrary basis functions. The total cost function minimizes $${\min_{W_1,W_2}} \lVert {X-\hat{X}} \rVert_2 + \kappa\sum_{i=1}^{c}\Delta(p||q)$$ with hidden unit activation function $$$f:\mathbb R\to \mathbb R_+$$$ , $$${W_1}$$$ is mapping the data $$$X$$$ into the hidden components $$$\mathcal{H}=f({W_1}X+{b_1})$$$ with time-courses $$${W_1} \in \mathbb R^{c\times t}$$$ and bias $$${b_1} \in \mathbb R^{1\times t}$$$, $$$(W_2\circledast W_3$$$) constitute the actual BOLD time series and linearly reconstructs the data $$$\hat{X}={(W_2\circledast W_3)}\mathcal{H}+b_2$$$ from the spatial maps with neuronal time-courses $$${W_2} \in \mathbb R^{t \times c}$$$, hemodynamic response function $$${W_3} \in \mathbb R^{t_{HRF} \times c}$$$ and bias $$${b_2} \in \mathbb R$$$. We do not estimate the HRF filter directly but fit the parametrization of two gamma densities using peak-delay, undershot-delay, peak-dispersion, undershot-dispersion, peak-undershot-ratio and onset-time.
Results
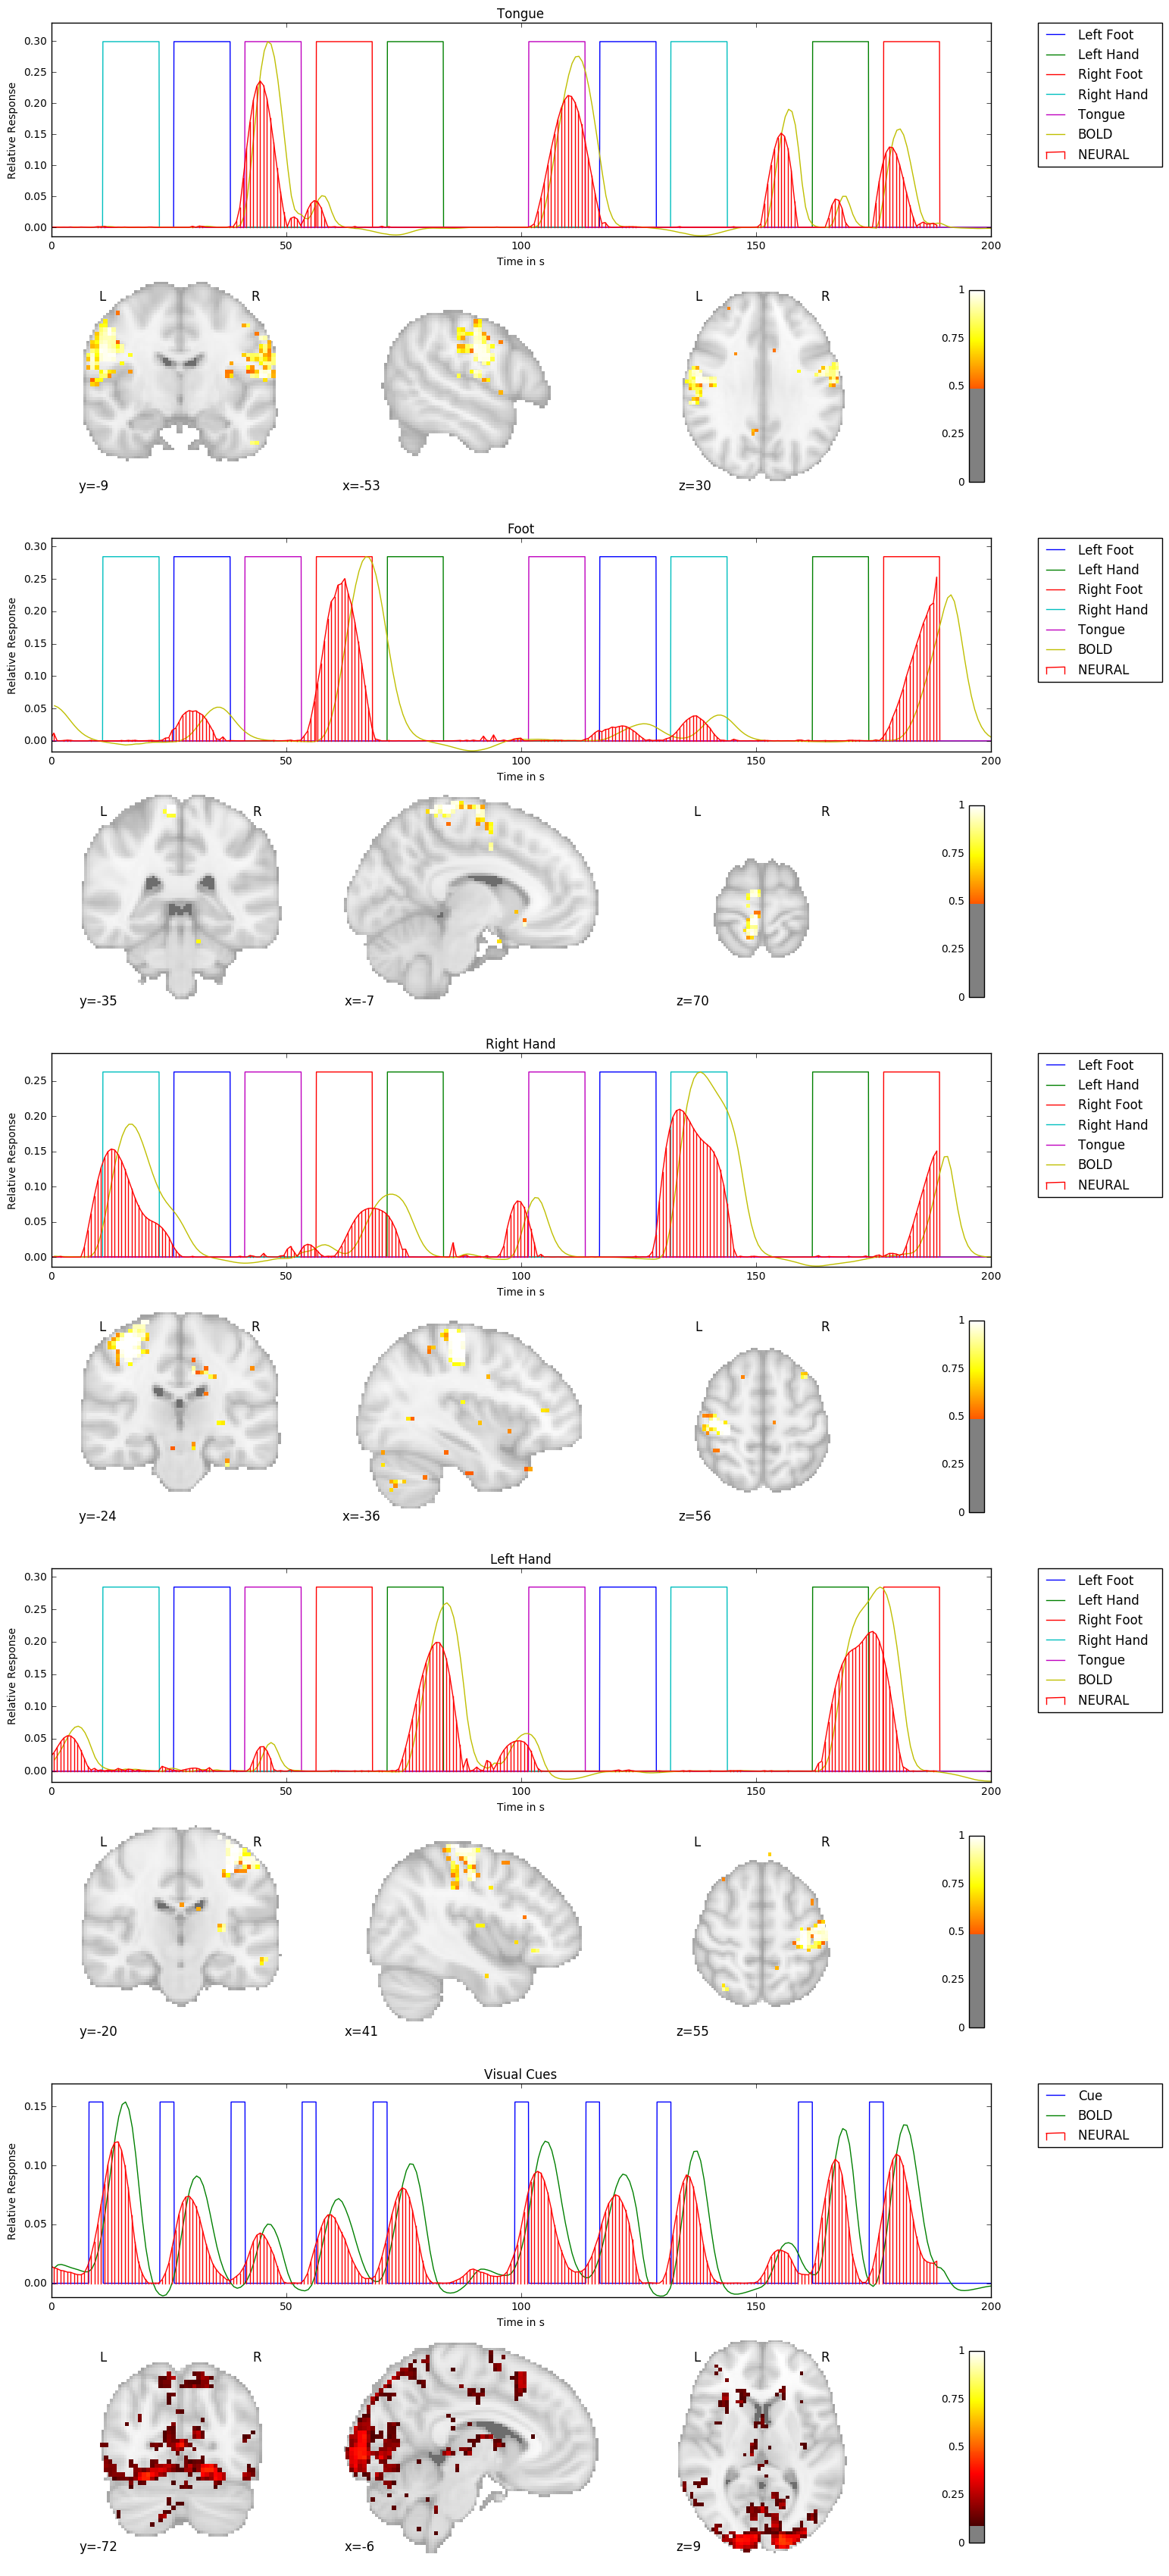
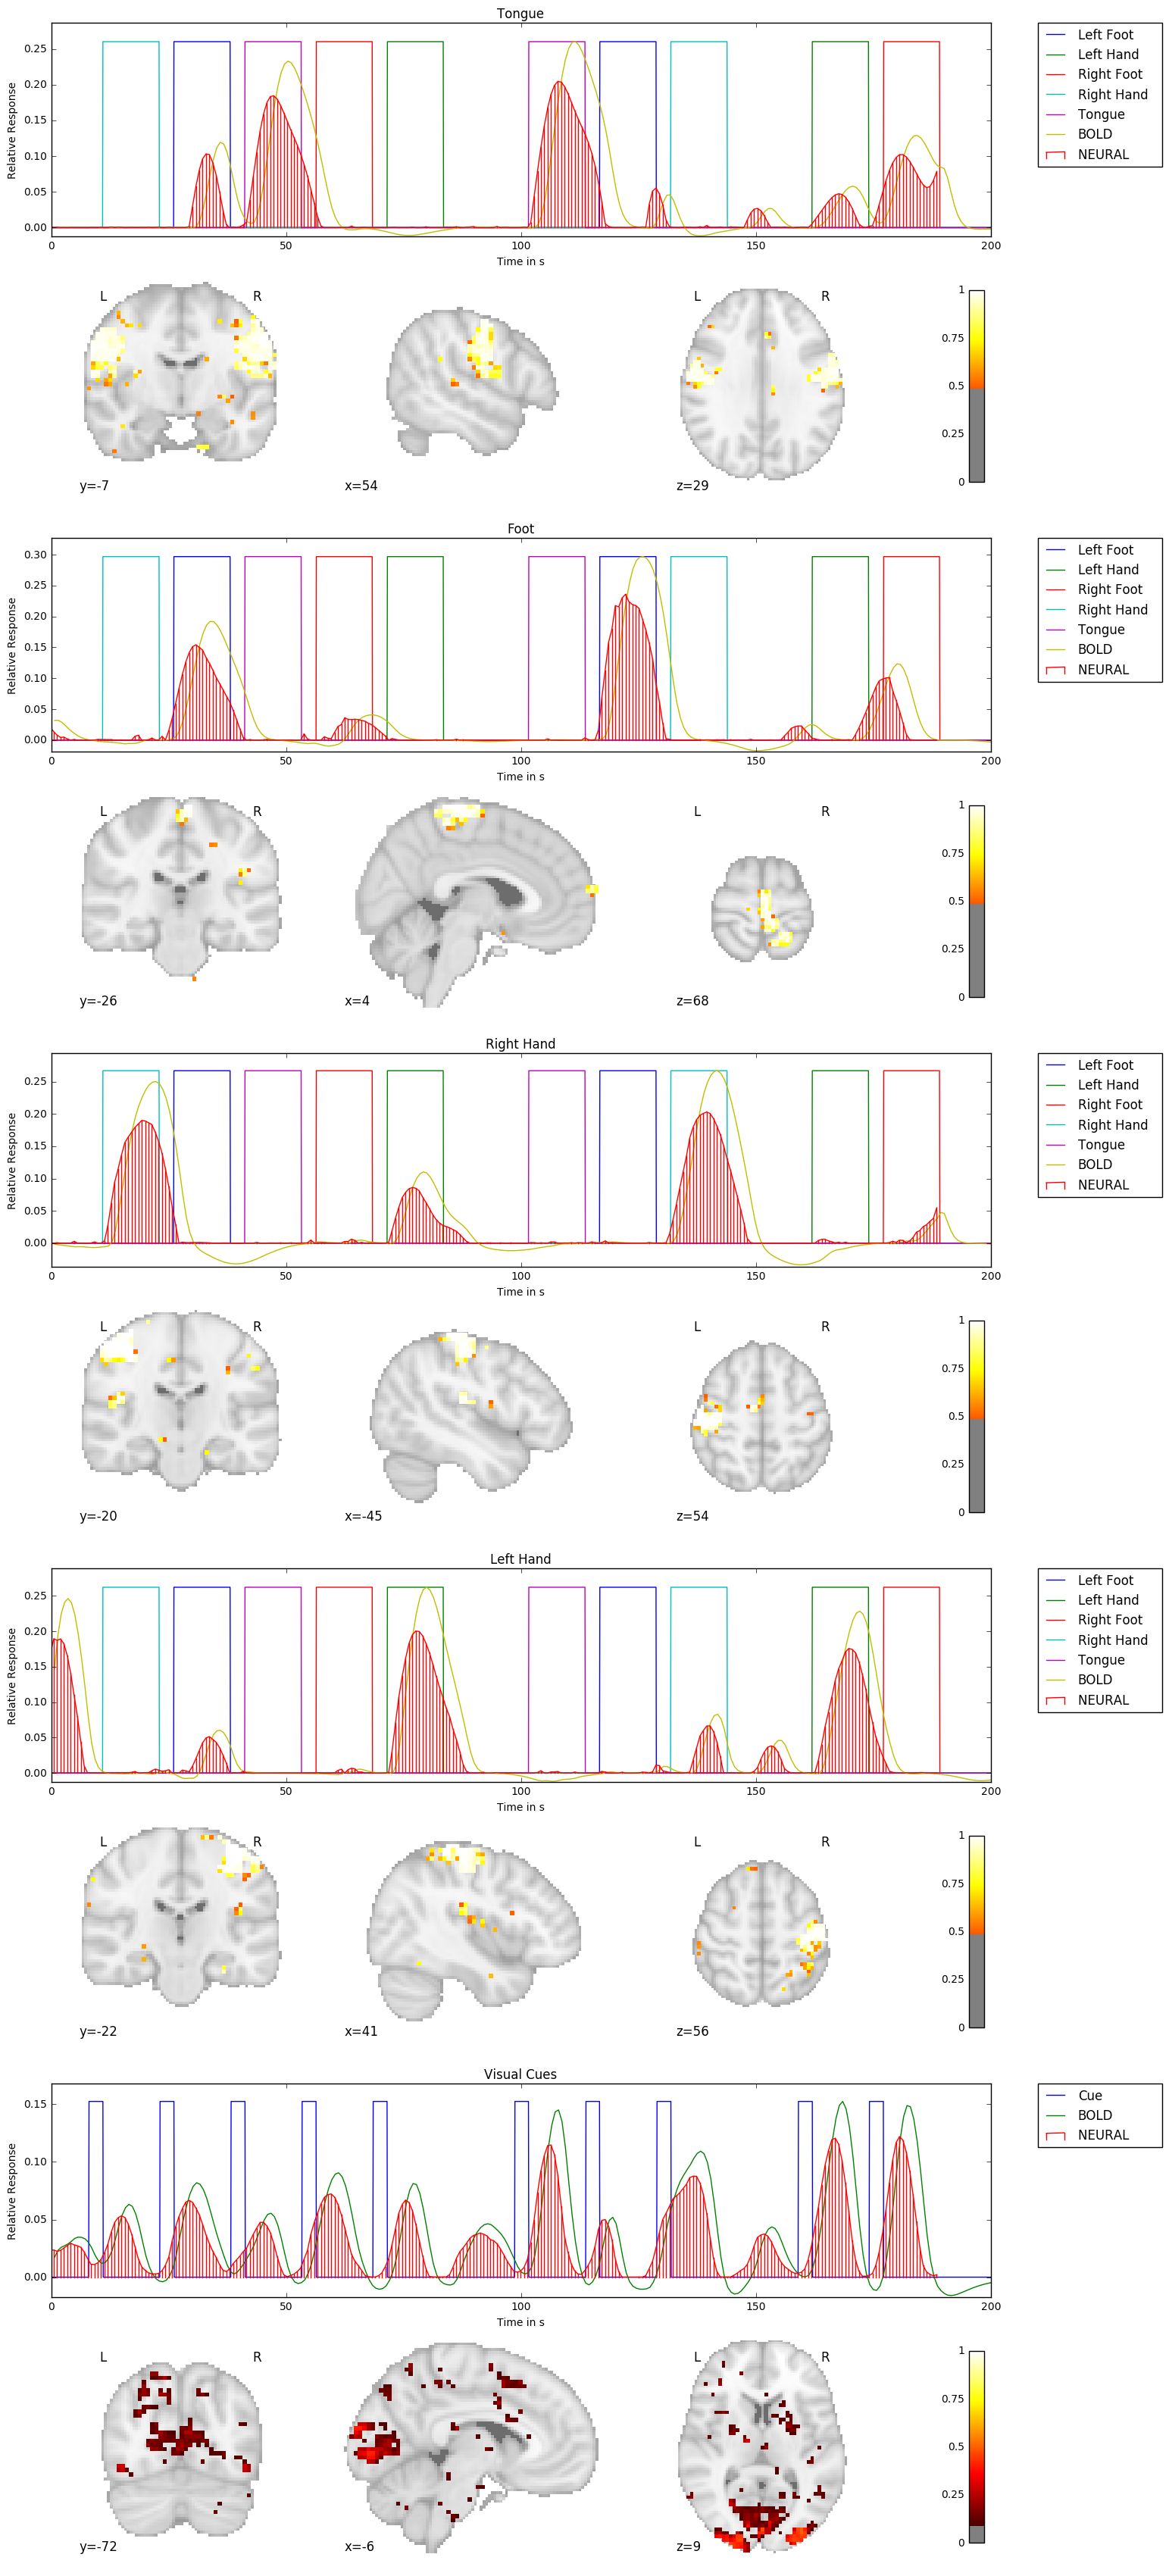
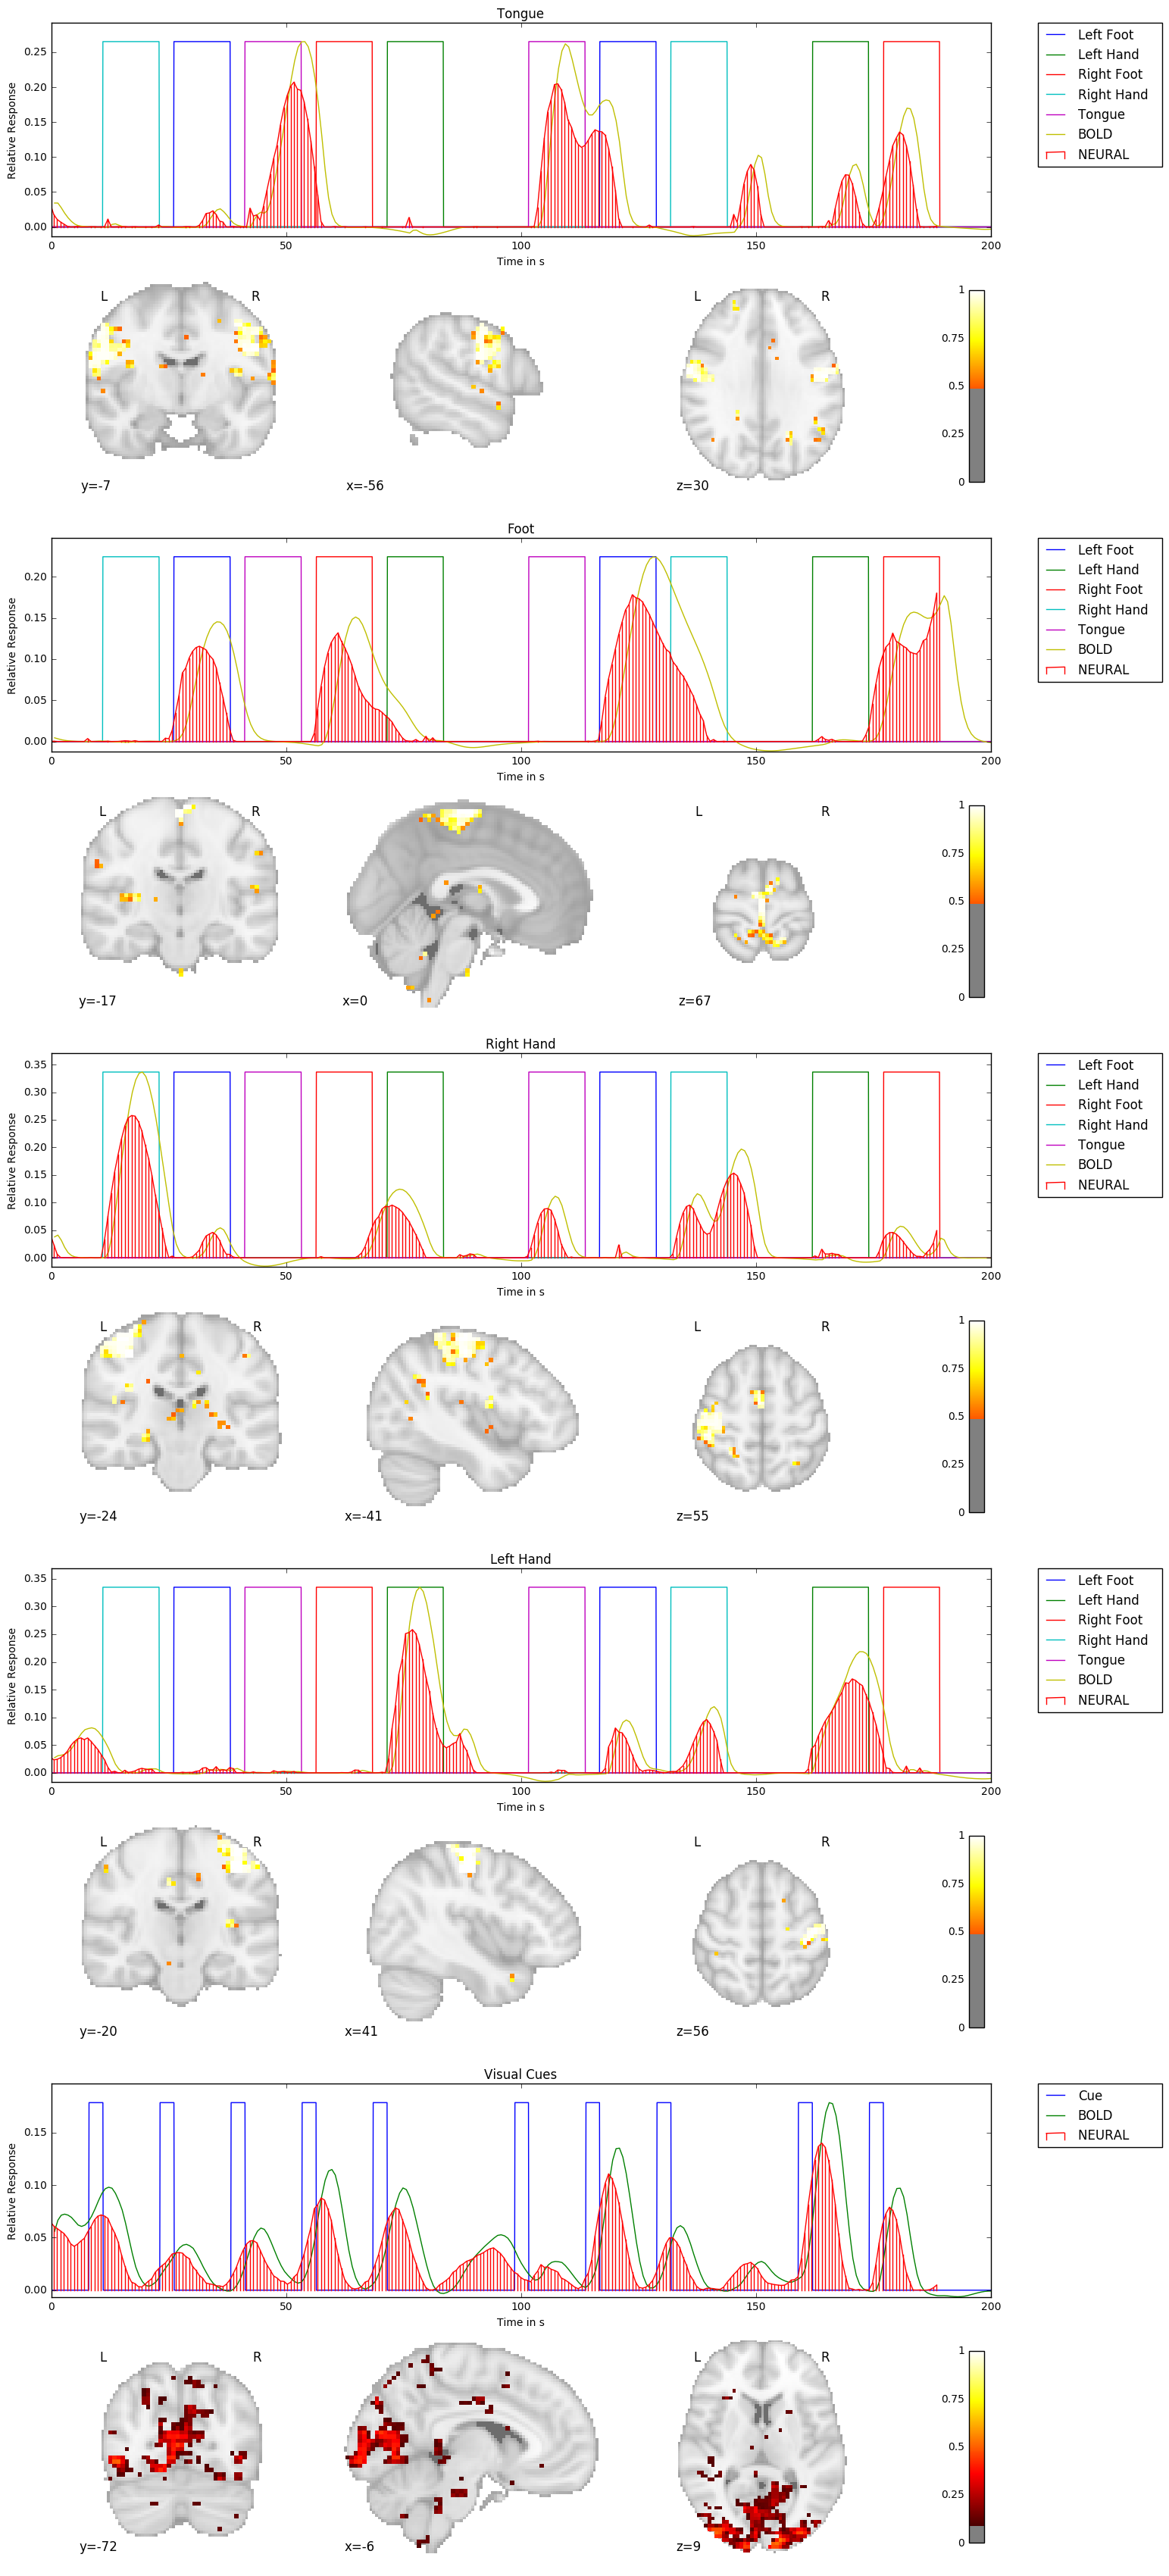
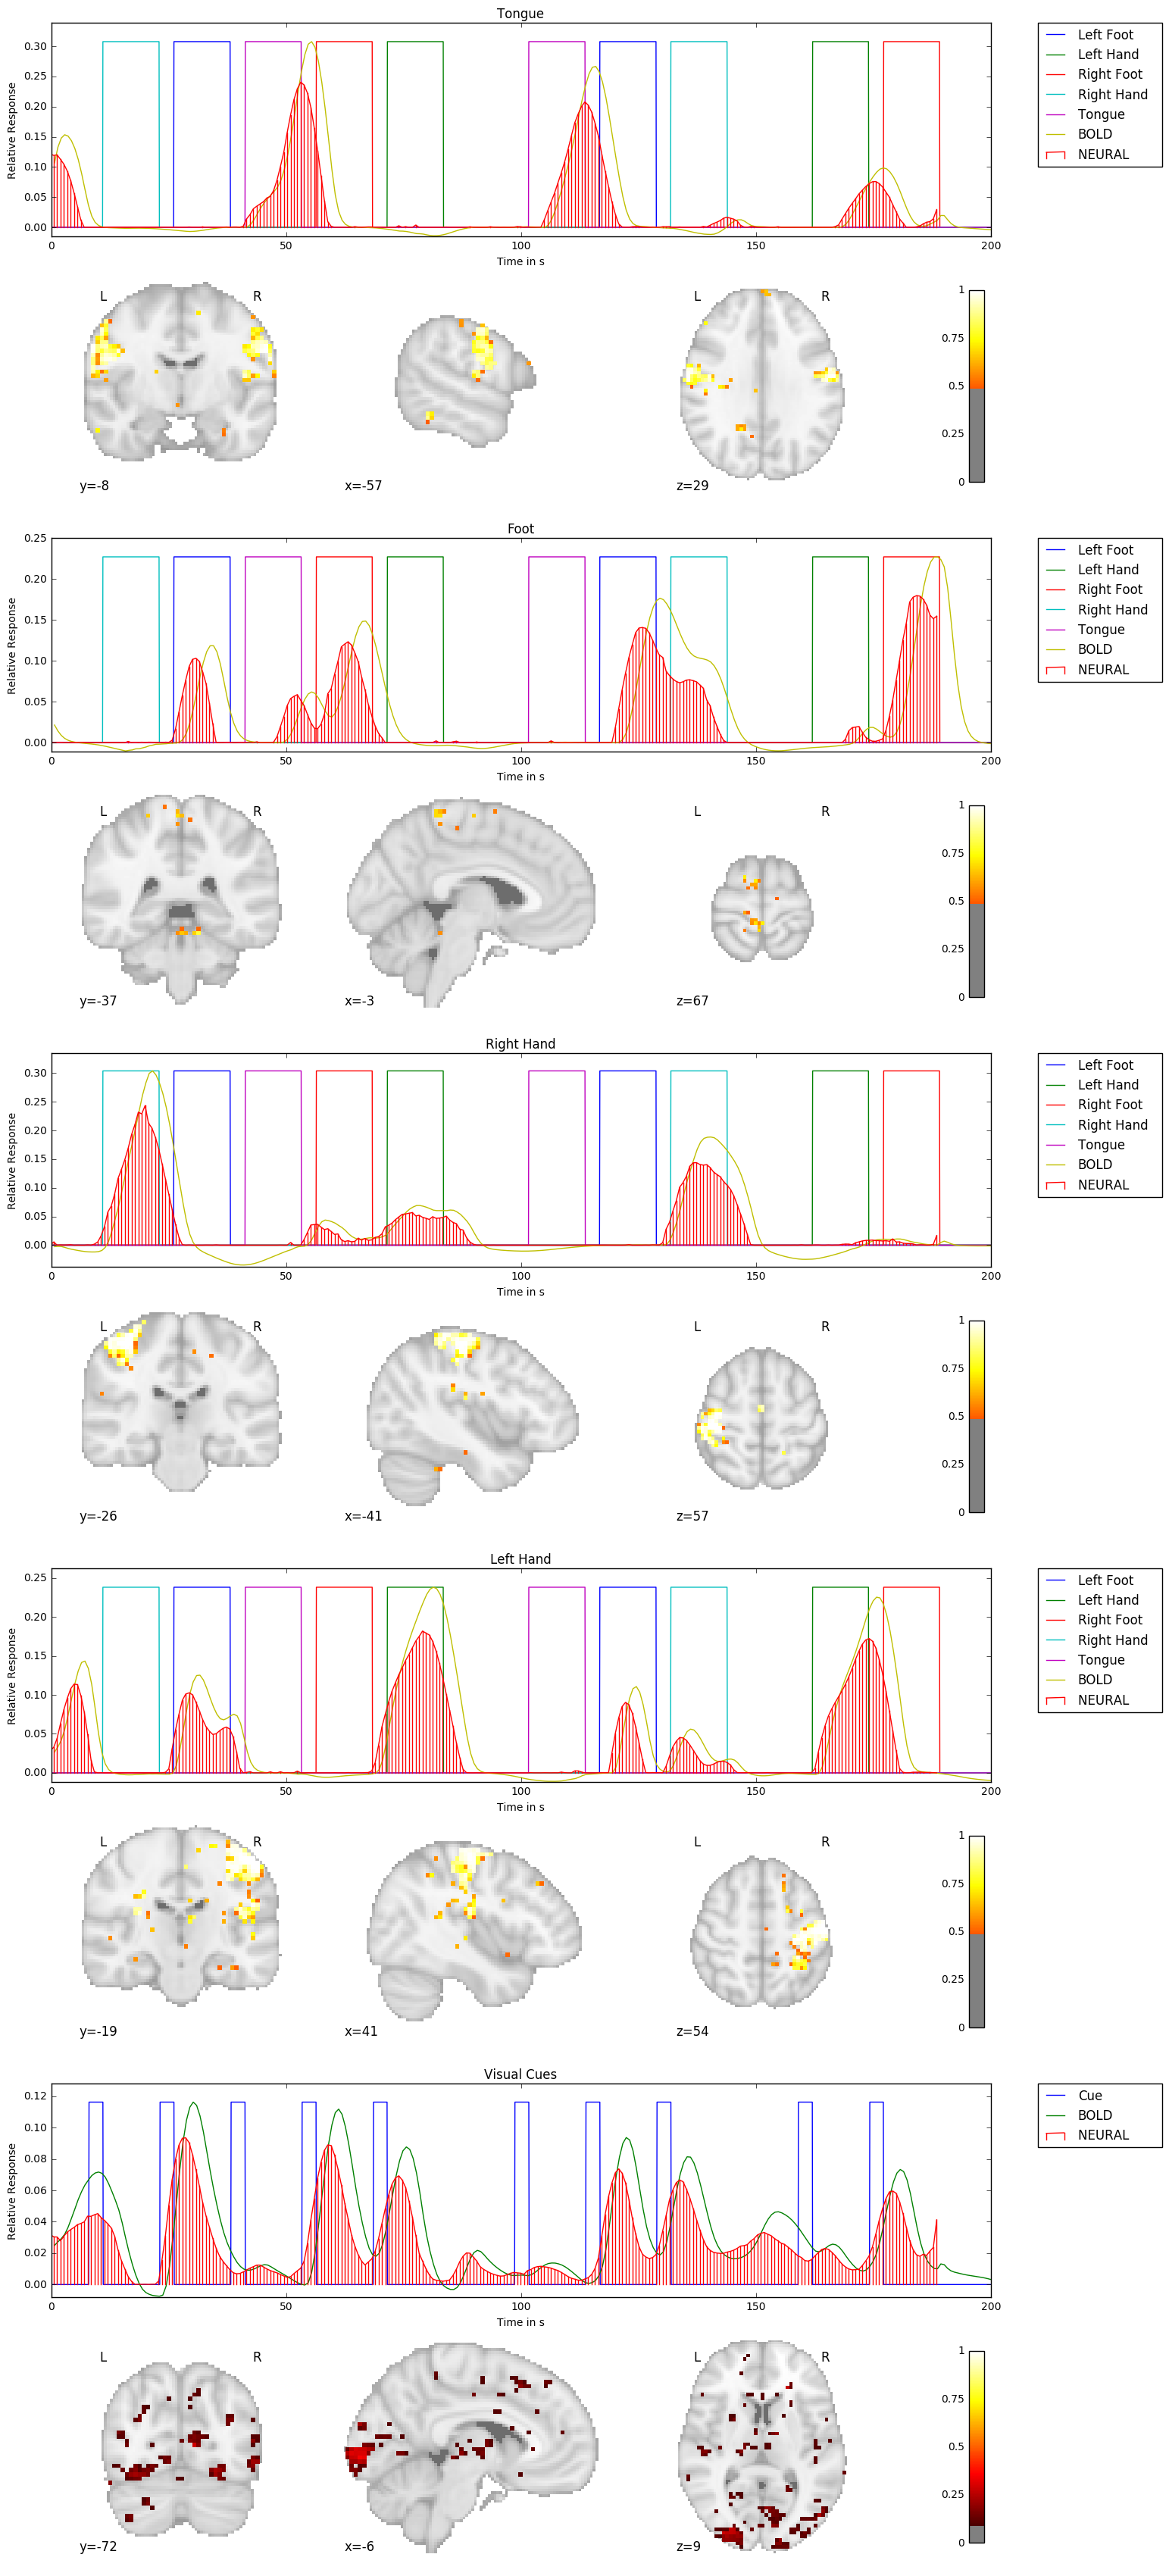
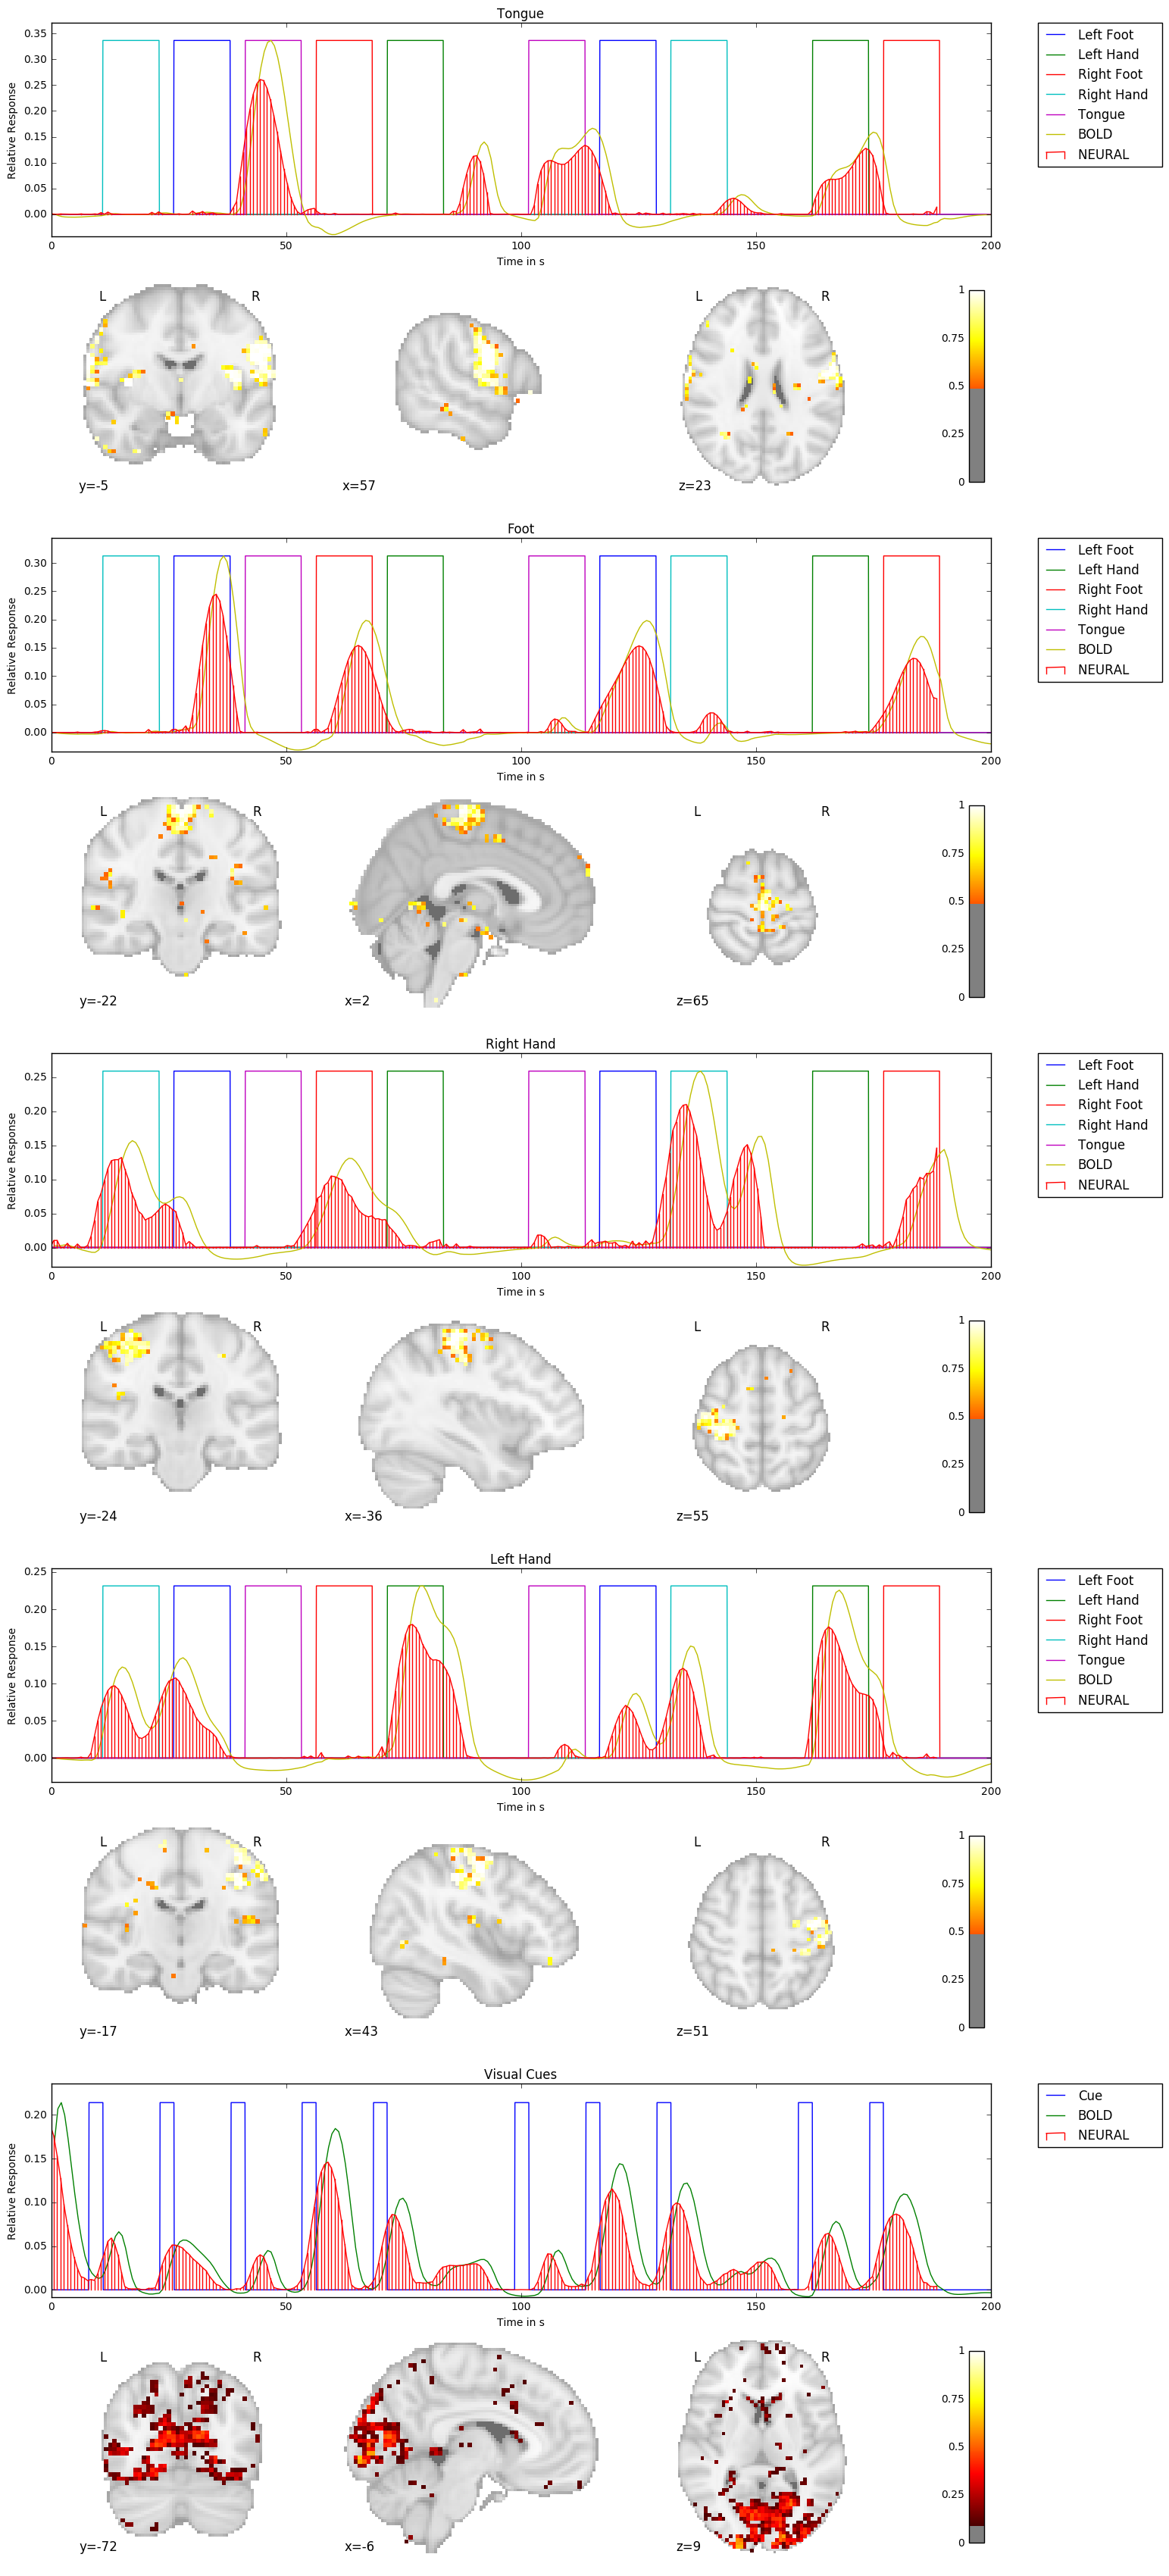
We apply our proposed method to the first 10 subjects of the motor task fMRI experiment of the HCP 1200 Subject Data Release. The respective imaging and the corresponding localizer task is described in [1]. Our results as seen in Figure 1,2,3,4,5 show that the obtained individual spatial maps in each subject resemble reported activation maps at the group level for tongue, foot and hand functional activation areas. The neural time series of the corresponding spatial components exhibit the greatest activation in the respective task block. We obtain a spatial cluster in each individual subject for tongue, left hand and right hand as reported in [1]. In contrary to [1], we observe only one spatial cluster for left and right foot activations. We also observe a significant visual cortex response to the visual cued stimulus in all subjects.
Discussion
We demonstrated that it is possible to obtain subject-specific neural activation patterns and their corresponding spatial maps in fMRI. We validated our method on known motor task activation areas from the HCP group study [1]. We also observed frequent neural activation patterns in the Visual Network, Default Mode Network, Central Execution Network as well as the Salient Network. These broader functional networks exhibit activation patterns related to the motor task. For example, the cues presented before the motor task blocks triggered delayed neuronal activity increase in the Visual Network as depicted in Figure 1,2,3,4,5 (bottom row).Conclusion
We described and tested a technique to measure neuronal activity in individual brain networks. We validated our method on a well-studied motor-area localizer task in high-quality publicly available data. Our obtained neuronal correlate is a potential biomarker for the better understanding of neuronal pathologies in fMRI, potentially allowing the differentiation between neuronal and physiological effects in neurological disease at the individual level.
Acknowledgements
We would like to acknowledge the MRC (MR/J01107X/1), the National Institute for Health Research (NIHR), the EPSRC (EP/H046410/1) and the National Institute for Health Research University College London Hospitals Biomedical Research Centre (NIHR BRC UCLH/UCL High Impact Initiative BW.mn.BRC10269). This work is supported by the EPSRC-funded UCL Centre for Doctoral Training in Medical Imaging (EP/L016478/1).References
[1] Function in the Human Connectome: Task-fMRI and Individual Differences in Behavior. Deanna M. Barch et al. Neuroimage. 2013 Oct 15; 80: 169–189.
[2] Probabilistic independent component analysis for functional magnetic resonance imaging. Christian F. Beckmann & Stephen. M. Smith. IEEE transactions on medical imaging, 2004, 23(2), 137-152.
[3] Deep learning for neuroimaging: a validation study. Sergey M. Plis et al. Frontiers in Neuroscience 8 2014.
[4] Independent component analysis for brain fMRI does not select for independence. Ingrid Daubechies Proceedings of the National Academy of Sciences, 2009, 106.26: 10415-10422.
Figures