0879
Evidence of Dense Functional Connectivity in the Human Brain1Department of Computer Science and Engineering, Indian Institute of Technology Delhi, New Delhi, India, 2Center for Biomedical Image Computing and Analytics, University of Pennsylvania, Philadelphia, PA, United States
Synopsis
Aimed at studying the nature of voxel-wise interactions in the brain, this study finds the evidence of dense functional connectivity in the brain using
Introduction
Since the onset of fMRI, correlation-based functional connectivity analysis has been widely used in resting state studies to establish relations between various brain regions.1 With recent large scale projects,2-4 many studies have contributed to understanding the human connectome. Diverse techniques including graph theory,5 independent component analysis,6 parcellation7 and clustering approaches have been employed to understand the brain’s network structure. A previous study8 had pointed to the possibility of dense correlations in the brain. In this abstract, we use statistical analysis to explore this hypothesis. We find a weak but dense functional connectivity between majority of the voxels in the brain. Unlike in studies with small number of subjects and region-wise analysis,9 we found statistically significant functional connectivity among 74.63% of all pairs of brain voxels. We further analyzed the connections between and within full brain, white and grey matter (WM,GM). We characterize this connectivity with global signal removal, WM, GM signal removal and bipartite embedding.Methods
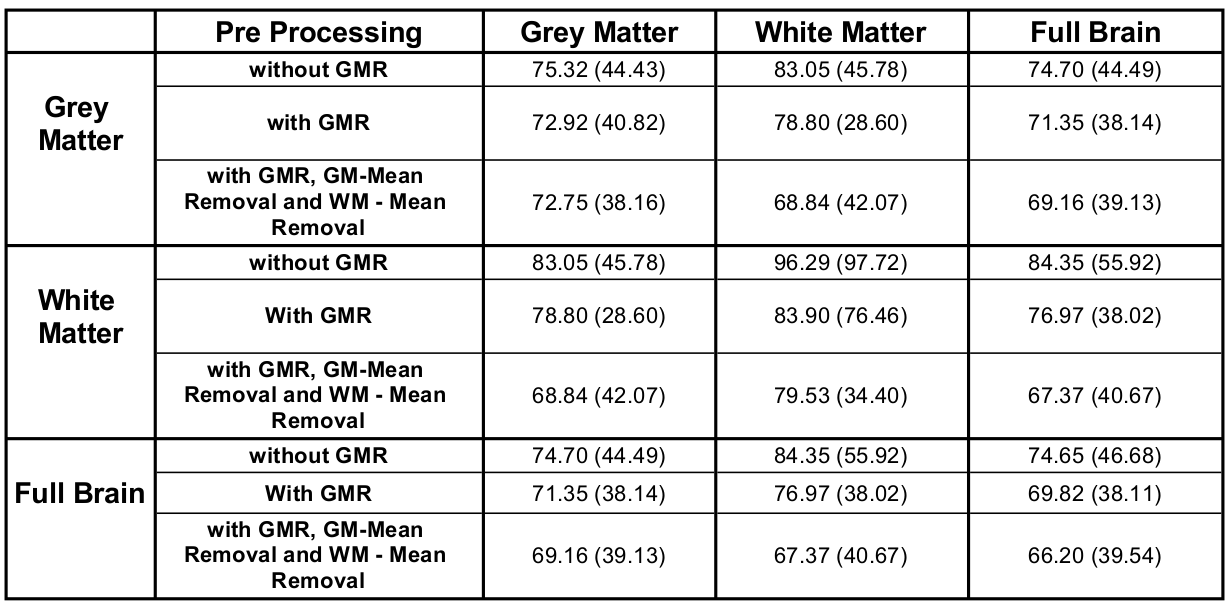
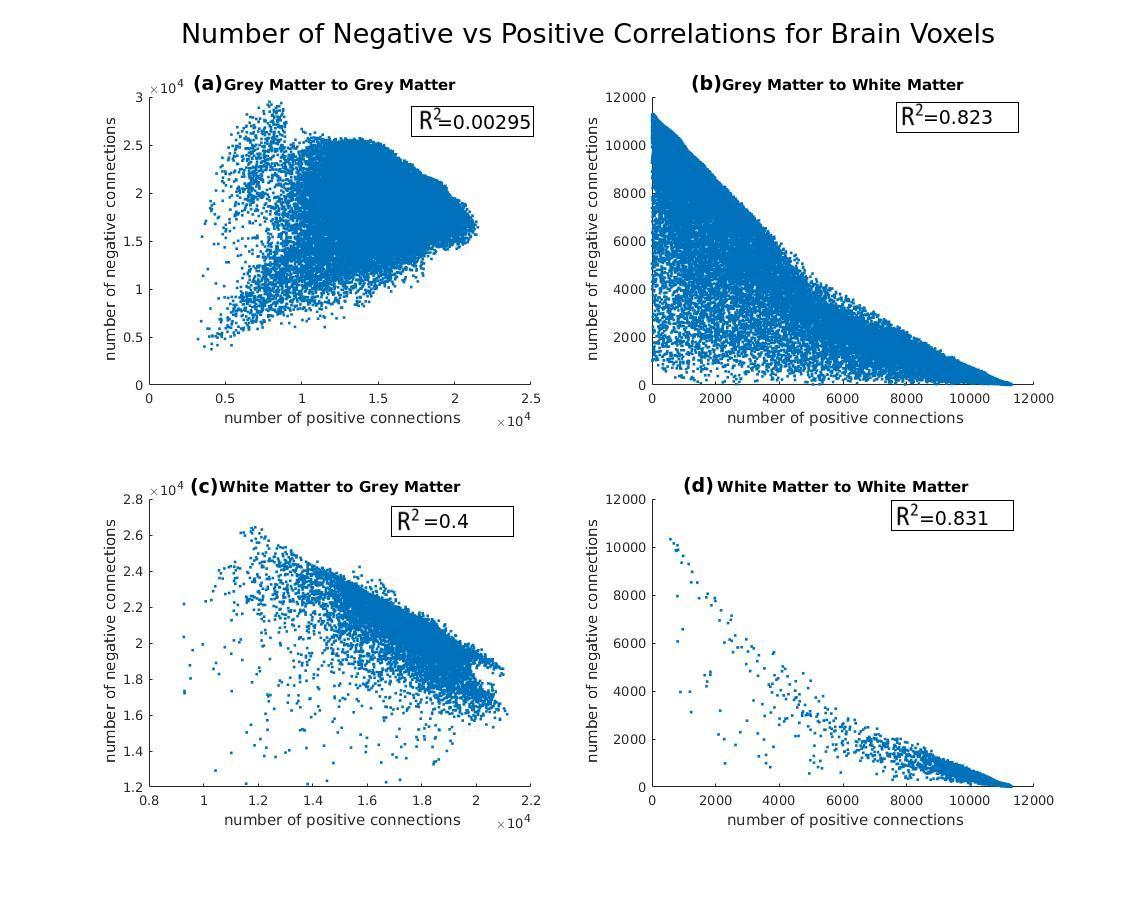
Resting state fMRI data of 724 subjects from 1000 Functional Connectomes Project2 was used after preprocessing using standard procedures in FSL10 and removing the subjects with less than 90% of brain in the field of view. Functional data of all subjects was registered to that of one of the subjects. Pairwise correlations for all voxel-pairs were computed for all subjects followed by t-test and a suitably modified FDR correction procedure operating at the network level, at 95% confidence. Three versions of correlation computation and statistical testing were done (see Table 1). For these versions, the connection density between WM-WM, WM-GM and GM-GM as well as the percentage of positive connections were computed and reported in Table 1. A scatter plot of number negative vs positive connections in these cases is included in Figure 3.
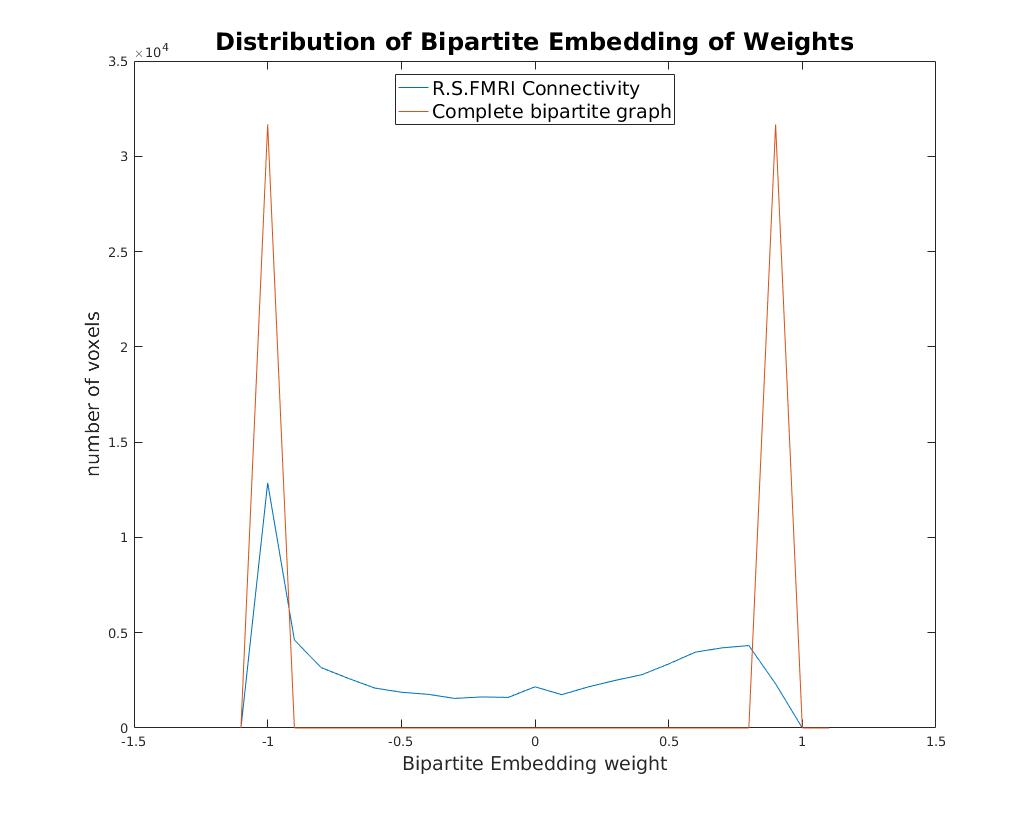
The brain is known to be organized into inter-inhibitory task positive regions11 and task negative regions.12 If they only comprise one task-positive and one task-negative network, then the subgraph with only negative functional connectivity should be a bipartite graph. To test this hypothesis, a bipartite graph embedding algorithm on the negative (inhibitory) functional connectivity sub-graph was executed (details omitted due to space constraints). For comparison, it was also executed on a synthetic complete bipartite graph.
Results
Table 1 shows the connection density and percentage of positively connected voxels among the WM and GM voxels for different preprocessing options. Out of all possible connections in the full brain, 69.8% were significantly active even after the global signal was regressed out, indicating dense connectivity among brain voxels. Positive WM-WM connectivity was in the range 79.5-96.3% across different preprocessing options.
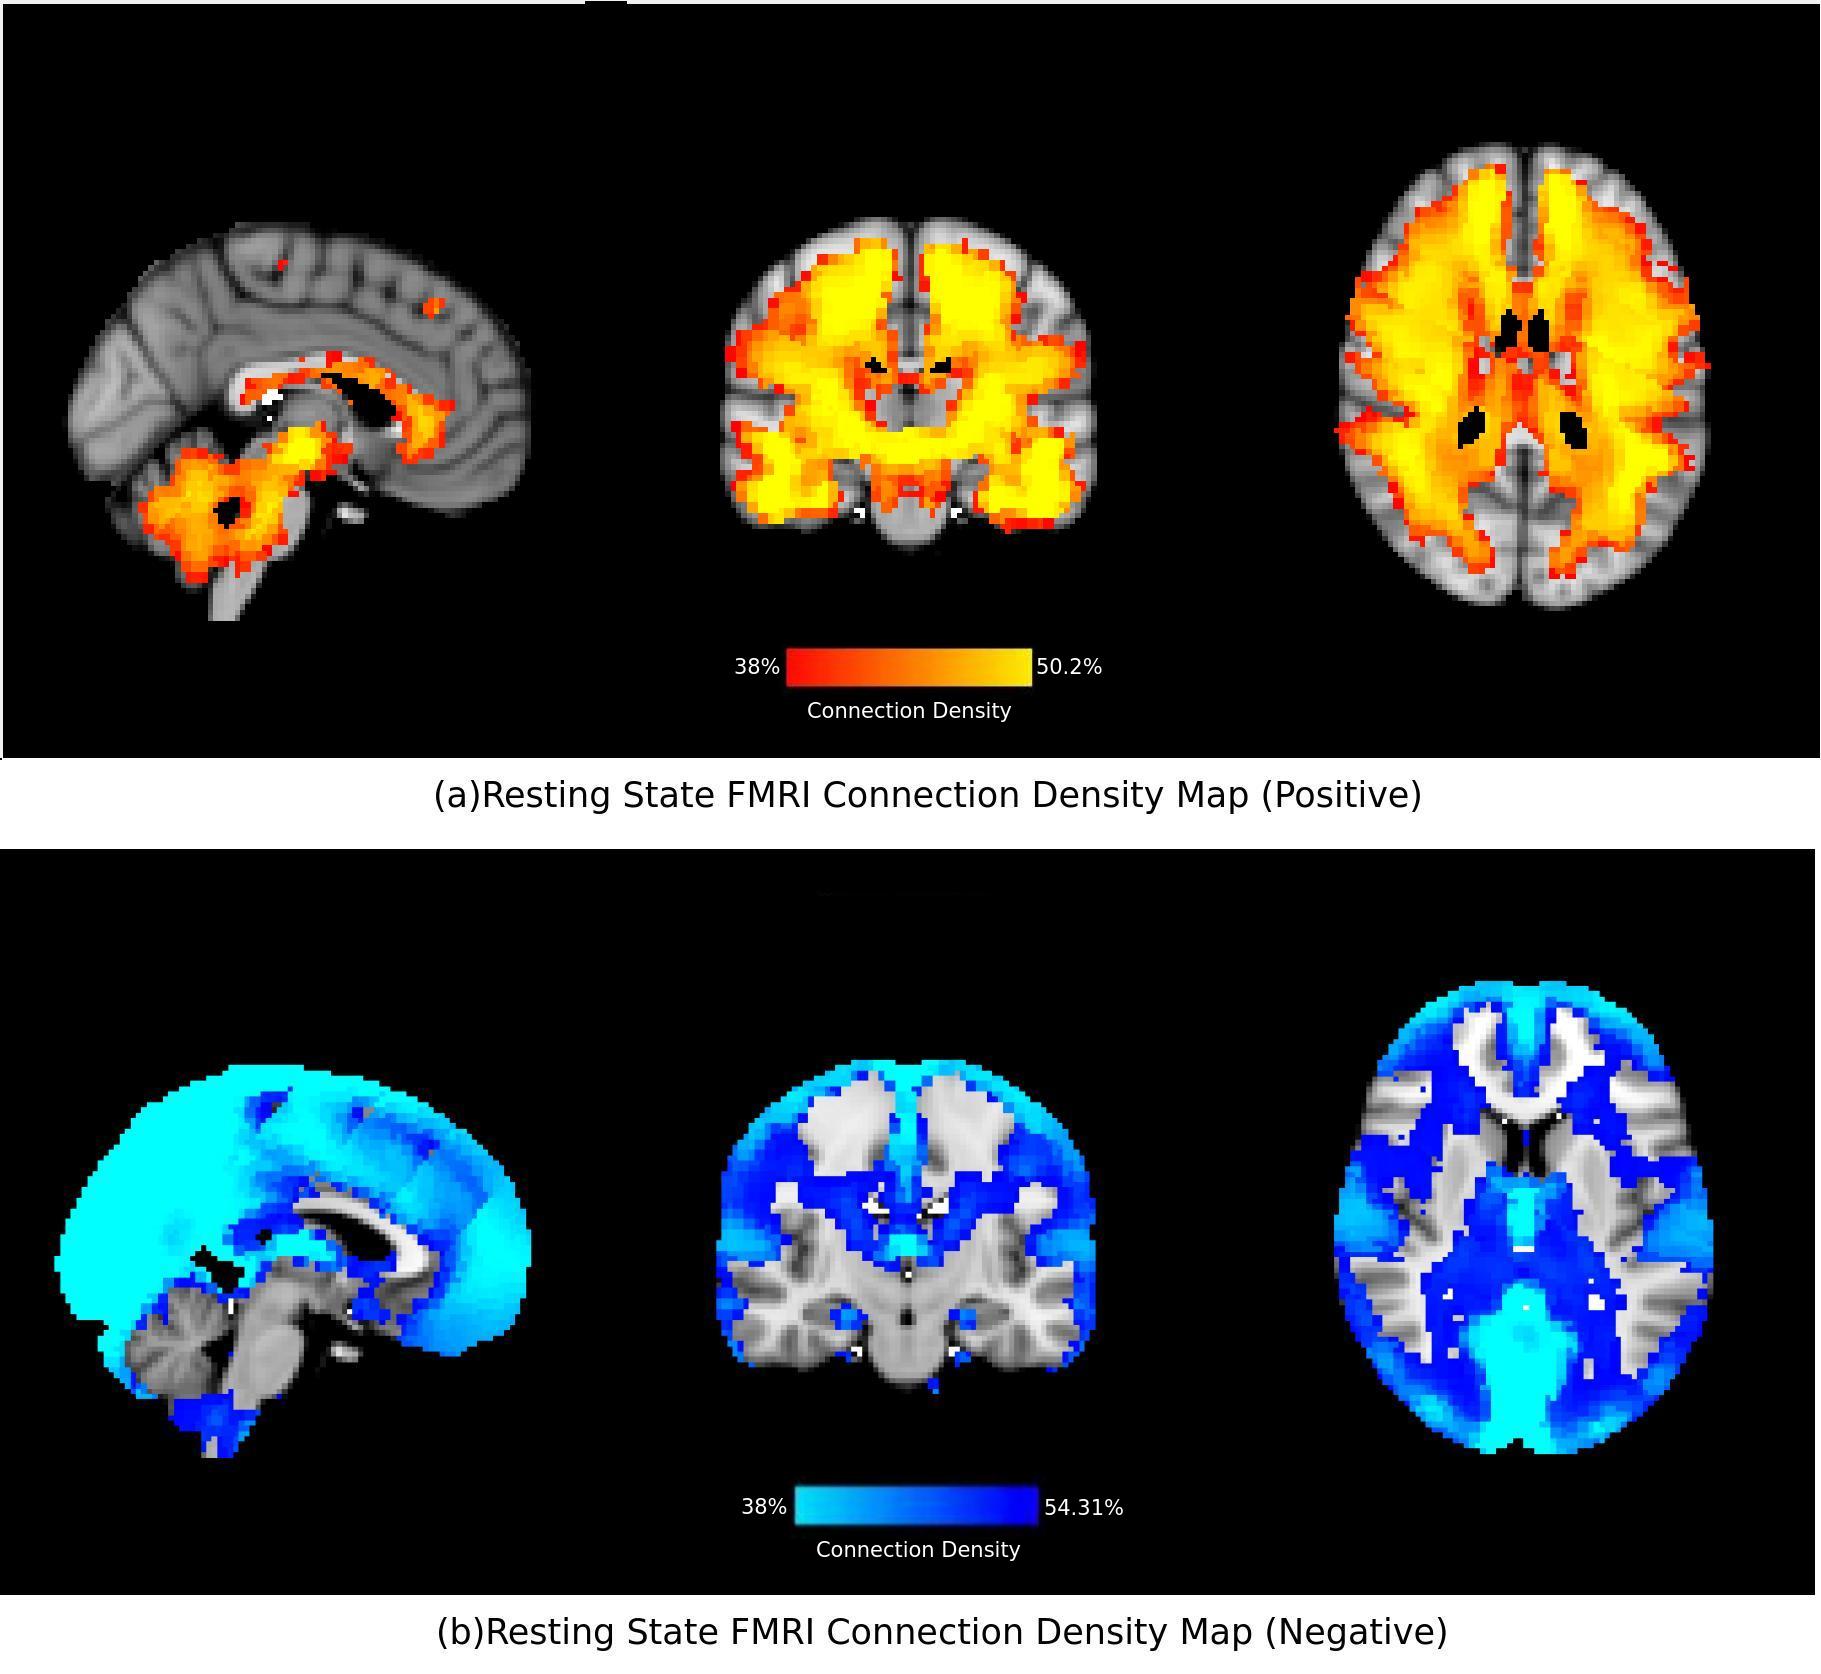
The density maps (no signal removal) for positive and negative functional connectivity are shown in Figure 1. Notably, the GM voxels tend to have more negative connectivity as compared to the WM voxels. The scatter plot in Figure 3 shows a negative correlation in number of negative connections.
Figure 2 shows distribution of the bipartite embedding weights when applied to a subgraph comprising of negatively functionally connected voxels, plotted against that for a complete bipartite graph. The complete bipartite graph demonstrates just two components with weights +1 and -1 whereas the negative connectivity sub-graph shows a continuum.
Discussion
While human connectomics have been studied for brain parcellation and topological study objectives7 or region-wise analysis,13 not many studies have looked into the nature of voxel-wise connectivity in full brain. Moreover, most of the studies employ datasets not larger than a hundred subjects, thus resulting in less statistical power than using large datasets.
The white matter in the brain does seem to have BOLD signal14 albeit with a different haemodynamic response function.15 Highly dense positive functional connectivity among the WM voxels is consistent with the fact that WM mostly has excitatory connections.14 Similarly, 40-50% positive connectivity among the GM voxels and between WM-GM voxels is consistent with the presence of both excitatory and inhibitory interactions. The high density of functional connectivity in brain is not surprising but uncovering its structure needs to be studied using thousands of subjects. Some connectivity might be explained by physiological16 or scanner noise.17
The failure of bipartite embedding indicates a more rich and nuanced structure in the graph to be obtained from the human functional connectome. Presence of a multi-partite structure with small number of regions as well as a continuum of network with subtly changing interactions is possible. Determining the nature of this dense full-brain functional connectivity network calls for a further detailed study into the human connectome.
Acknowledgements
No acknowledgement found.References
1. Van Den Heuvel, Martijn P., et al. Exploring the brain network: a review on resting-state fMRI functional connectivity. European neuropsychopharmacology. 2010;20(8):519-534.
2. Biswal, Bharat B., et al. Toward discovery science of human brain function. Proceedings of the National Academy of Sciences. 2010;107(10): 4734-4739.
3. Van Essen, David C., et al. The WU-Minn human connectome project: an overview. Neuroimage. 2013;80:62-79.
4. Nooner, Kate Brody, et al. The NKI-Rockland sample: a model for accelerating the pace of discovery science in psychiatry. Frontiers in neuroscience; 2012;6:152.
5. Fornito, Alex, Andrew Zalesky, and Michael Breakspear. Graph analysis of the human connectome: promise, progress, and pitfalls. Neuroimage. 2013;80:426-444.
6. De Luca, M., et al. fMRI resting state networks define distinct modes of long-distance interactions in the human brain. Neuroimage. 2006;29(4):1359-1367.
7. Wang, Jinhui, et al. Parcellation‐dependent small‐world brain functional networks: a resting‐state fMRI study. Human brain mapping. 2009;30(5):1511-1523.
8. Batta Ishaan, and Garg Rahul Full-Brain autoregressive modelling and functional connectivity analysis of resting state fMRI data. Department of Computer Science and Engineering, Indian Institute of Technology Delhi 2017.
9. Uddin, Lucina Q., et al. Functional connectivity of default mode network components: correlation, anticorrelation, and causality. Human brain mapping. 2009;30(2):625-637.
10. Smith, Stephen M., et al. Advances in functional and structural MR image analysis and implementation as FSL. Neuroimage. 2004;23:S208-S219.
11. Fox, Michael D., et al. The human brain is intrinsically organized into dynamic, anticorrelated functional networks. Proceedings of the National Academy of Sciences of the United States of America 2005;102(27):9673-9678.
12. Raichle, Marcus E., and Abraham Z. Snyder. A default mode of brain function: a brief history of an evolving idea. Neuroimage. 2007;37(4):1083-1090.
13. Power, Jonathan D., et al. Functional network organization of the human brain. Neuron. 2011;72(4):665-678.
14. Gawryluk, Jodie R., et al. Does functional MRI detect activation in white matter? A review of emerging evidence, issues, and future directions. Frontiers in neuroscience. 2014;8:239.
15. Fraser, Leanne M., et al. White versus gray matter: fMRI hemodynamic responses show similar characteristics, but differ in peak amplitude. BMC neuroscience. 2012;13(1):91.
16. Krüger, Gunnar, and Gary H. Glover. Physiological noise in oxygenation‐sensitive magnetic resonance imaging. Magnetic resonance in medicine. 2001;46(4):631-637.
17. Bandettini, Peter A., et al. Functional MRI of brain activation induced by scanner acoustic noise. Magnetic resonance in medicine. 1998;39(3):410-416.
Figures