0876
A Probabilistic Atlas of Digit Somatotopy in the Human Primary Somatosensory CortexAyan Sengupta1, Denis Schluppeck2, Eleanor Barrat1, Julien Besle3, Susan Francis1, and Rosa Sanchez Panchuelo1
1Sir Peter Mansfield Imaging Centre, School of Physics and Astronomy, University of Nottingham, Nottingham, United Kingdom, 2School of Psychology, University of Nottingham, Nottingham, United Kingdom, 3Department of Psychology, American University of Beirut, Beirut, Lebanon
Synopsis
A probabilistic atlas of the digit representations of the left and right hand in primary somatosensory cortex is formed. The atlas is generated in volume and surface standardized space from somatotopic maps of 21 right-handed subjects obtained using a travelling wave paradigm with vibrotactile stimuli. Metrics quantify the likelihood of a given position being assigned to a digit (full probability map) and the most probable digit for a position (maximum probability map), with the atlas validated using a leave-one-out cross validation procedure. This probabilistic atlas quantifies variability in healthy subjects and can be used as a reference in patient studies.
Introduction:
We have previously shown that the representation of the fingers in an individual subject's contralateral primary somatosensory cortex (S1) can be mapped using a travelling wave paradigm with vibrotactile stimuli1,2. Here, we generate a probabilistic atlas of digit representations of both hands in standard volumetric and surface space, to provide a reference for future studies in patient groups with disorders such as hand dystonia.Methods:
Twenty-one right-handed healthy subjects were scanned at 7T (Philips Achieva) with a 32-channel receive coil. fMRI data were acquired using multi-slice gradient echo–echo planar imaging (GE-EPI) with either 1.5 or 1.25mm isotropic resolution (TE 25ms, TR 2s). A ‘travelling wave’ paradigm was used to sequentially stimulate each fingertip of a given hand (vibrotactile stimuli, 30Hz, 4s period). Functional scans consisted of 8-12 cycles, alternating between forward (thumb to little finger) and backward (little finger to thumb) ordering. In each subject, digit somatotopy was repeated for each hand. Additionally, a whole head (1mm isotropic) T1-weighted structural scan was acquired. fMRI data from the forward and backward scans were combined (to cancel the haemodynamic delay) prior to Fourier analysis (mrTools http://gru.stanford.edu/mrTools). Standard phase and coherence maps were generated and coherence maps converted to p-values and used to threshold (p≤0.05, uncorrected) the phase maps (Figure 1). Cortical surfaces of the left and right hemisphere were generated in Freesurfer for each subject’s T1-weighted structural images. Phase maps were projected to individual flattened representations of their sensorimotor cortex for a manual approach to delineate the hand area ROI (Figure 2A). For an automated approach (Figure 2B), Freesurfer labels of Brodmann areas 1, 2, 3a and 3b were projected to individual space, and combined to form an automated somatosensory (S1) ROI mask. For both approaches, individual digit ROIs were formed by dividing the phase map into 5 equally spaced bins. These data in individual subject space were then transformed into standard volumetric (MNI152 2 mm) and surface (fsaverage MNI305) space (Figure 1). Full-Probabilistic-Maps (FPMs) for each digit were generated from the number of times a location belonged to a digit-specific ROI, normalized by the total number of subjects. Maximum-Probabilistic-Maps (MPMs) were generated using a winner-takes-all approach (assigning the digit with highest probability to a given location)3. Group mean and variance phase maps were created by calculating the circular mean and standard-deviation of the phase across subjects. To validate each atlas, a leave-one-out cross validation procedure was performed by computing the central tendency metric3 between digit ROIs in the leave-one-out FPM and digit ROIs defined in individual subjects, this was performed for all pairwise digit comparisons.Results:
The manual and automated hand ROIs produced comparable probabilistic maps (Figure 2C, 2D). The FPMs show the mediolateral organization of digits D1-D5 in contralateral S1 for stimulation of both hands. The FPMs show the variability of individual digit representations across subjects. Sharp boundaries between digits are more clearly seen in the MPMs (Figure 3A), which are similar to the group averaged phase map (Figure 3B). In these maps, digits D2, D3, D4 show the largest representations, and D1 and D5 the smallest, quantified in Figure 4 by the mean digit ROI size across subjects and the MPM digit ROI size. Figure 4 shows the blurring metric3 (which is inversely proportional to how much ROIs for a given digit overlap across subjects) is higher for D1-D4 of the left hand than right hand, suggesting a higher digit specificity for the dominant hand. For both volumetric and surface based atlases, Figure 5 shows higher central tendency values lie along the diagonal of the matrix, as expected, except for D2 which shows large overlap with D1.Discussion:
We present a volume and surface based probabilistic atlas of digit somatotopy for both the right (dominant) and left (non-dominant) hand in contralateral S1. This probabilistic atlas is generated from travelling wave phase maps, and thus represents maps according to the most dominant digit across S1. In previous work4, we have used an event-related design to reveal the spatial overlap of the digit representations in an individual subjects. Incorporating this overlap into a probabilistic atlas would provide additional useful information about variability of S1 across individuals, and likely higher overlap between subjects.Conclusion:
We present a probabilistic atlas in standard volume and surface space of right and left hand individual finger representations in contralateral S1 from a large population of right handed subjects. This probabilistic atlas will be used in future investigations to assess how digit representations are altered in patient populations. This digit somatotopy probabilistic atlas will be made freely available.Acknowledgements
This work was funded by a MRC grant MR/M022722/1 and a Leverhulme fellowship.References
- Sanchez Panchuelo RM, Francis S, Bowtell R, Schluppeck D. Mapping human somatosensory cortex in individual subjects with 7T functional MRI. J Neurophysiology. 2010; 103:2544-2556.
- Sanchez-Panchuelo RM, Besle J, Beckett A, Bowtell R, Schluppeck D, Francis S. Within-digit functional parcellation of Brodmann areas of the human primary somatosensory cortex using functional magnetic resonance imaging at 7 tesla. J Neurosci. 2012; 32(45):15815-22.
- Wang L, Mruczek REB, Arcaro MJ, Kastner S. Probabilistic maps of visual topography in human cortex. Cerebral Cortex. 2014; 1-21.
- Besle J, Sanchez Panchuelo RM, Bowtell R, Francis S, Schluppeck D. Single-subject fMRI mapping at 7 T of the representation of fingertips in S1: a comparison of event-related and phase-encoding designs. J Neurophysiology. 2013; 109:2293-2305.
Figures
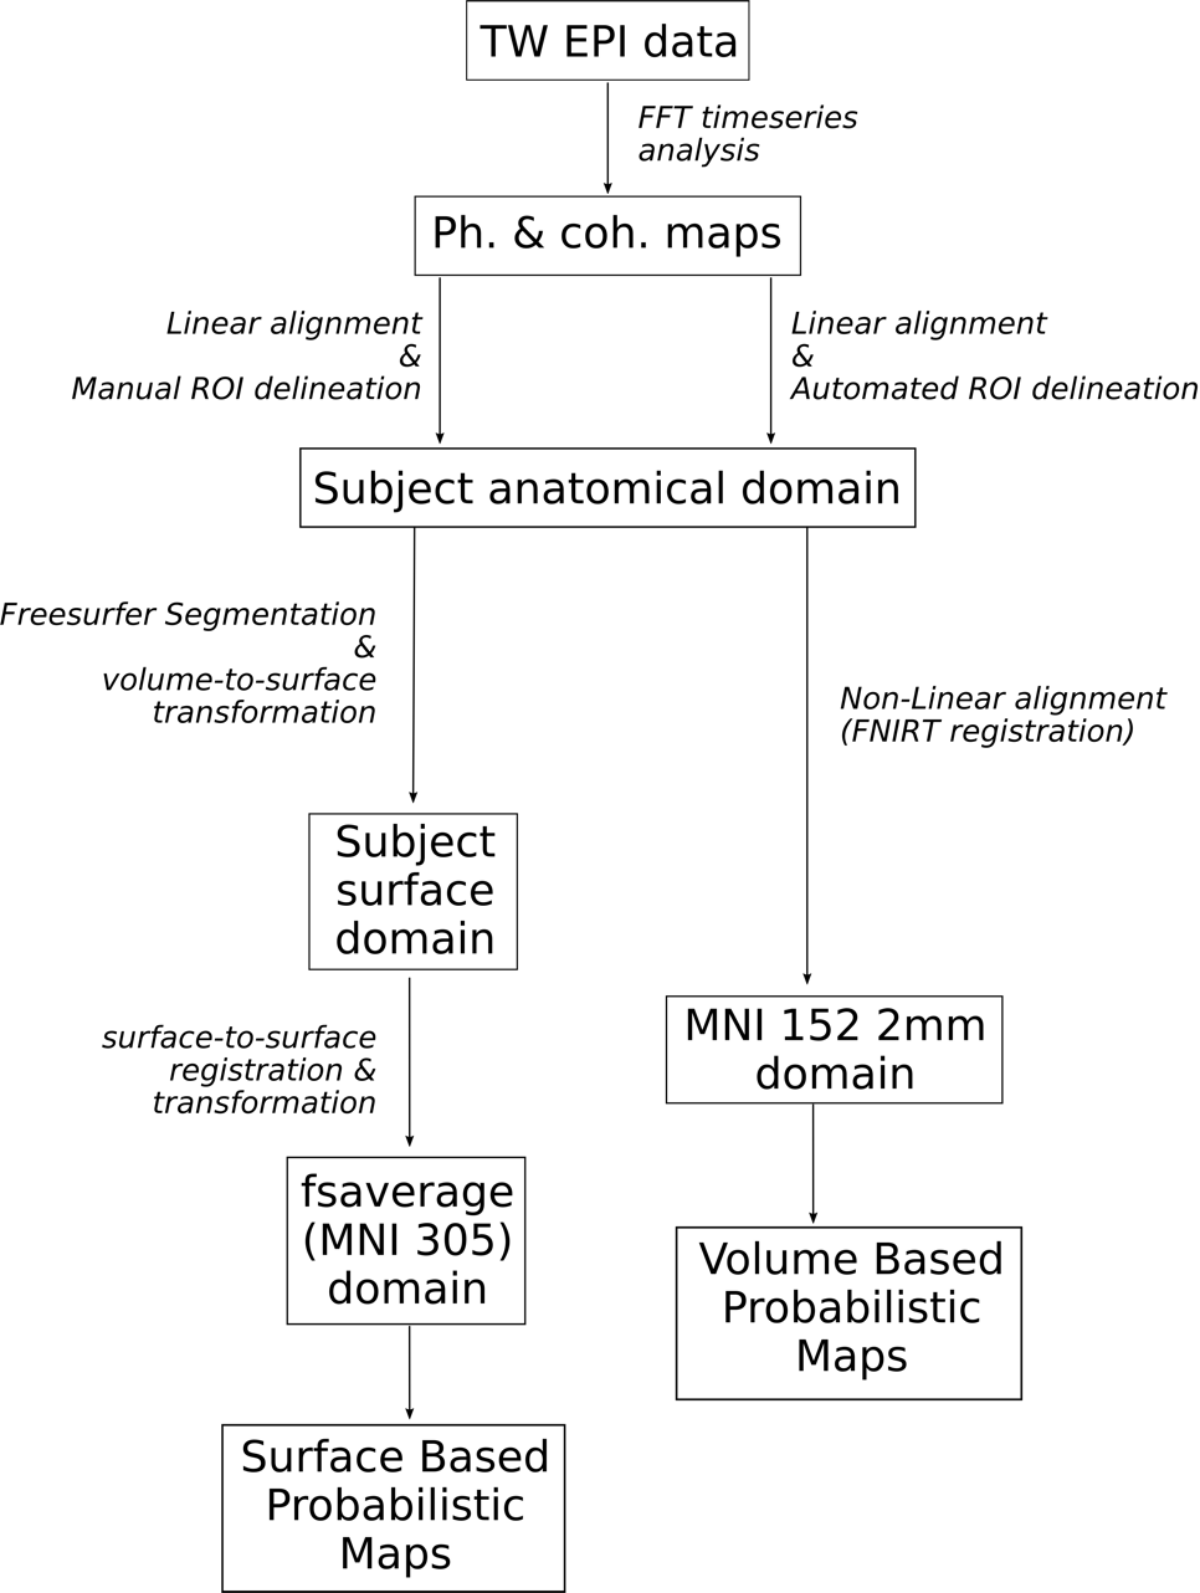
Flowchart of surface-based analysis
(SBA) and volume-based analysis (VBA) to create the digit somatotopy
probabilistic atlas. For SBA, the digit ROIs were projected to
subject specific cortical surface using the volume-to-surface
transformation in Freesurfer. These ROIs were then warped to the
fsaverage (MNI305) standard space by spherical registration in
Freesurfer. For VBA, the individual digit ROIs were projected from
individual anatomical space to MNI-152 2mm standard space using
non-linear registration (FSL-FNIRT).
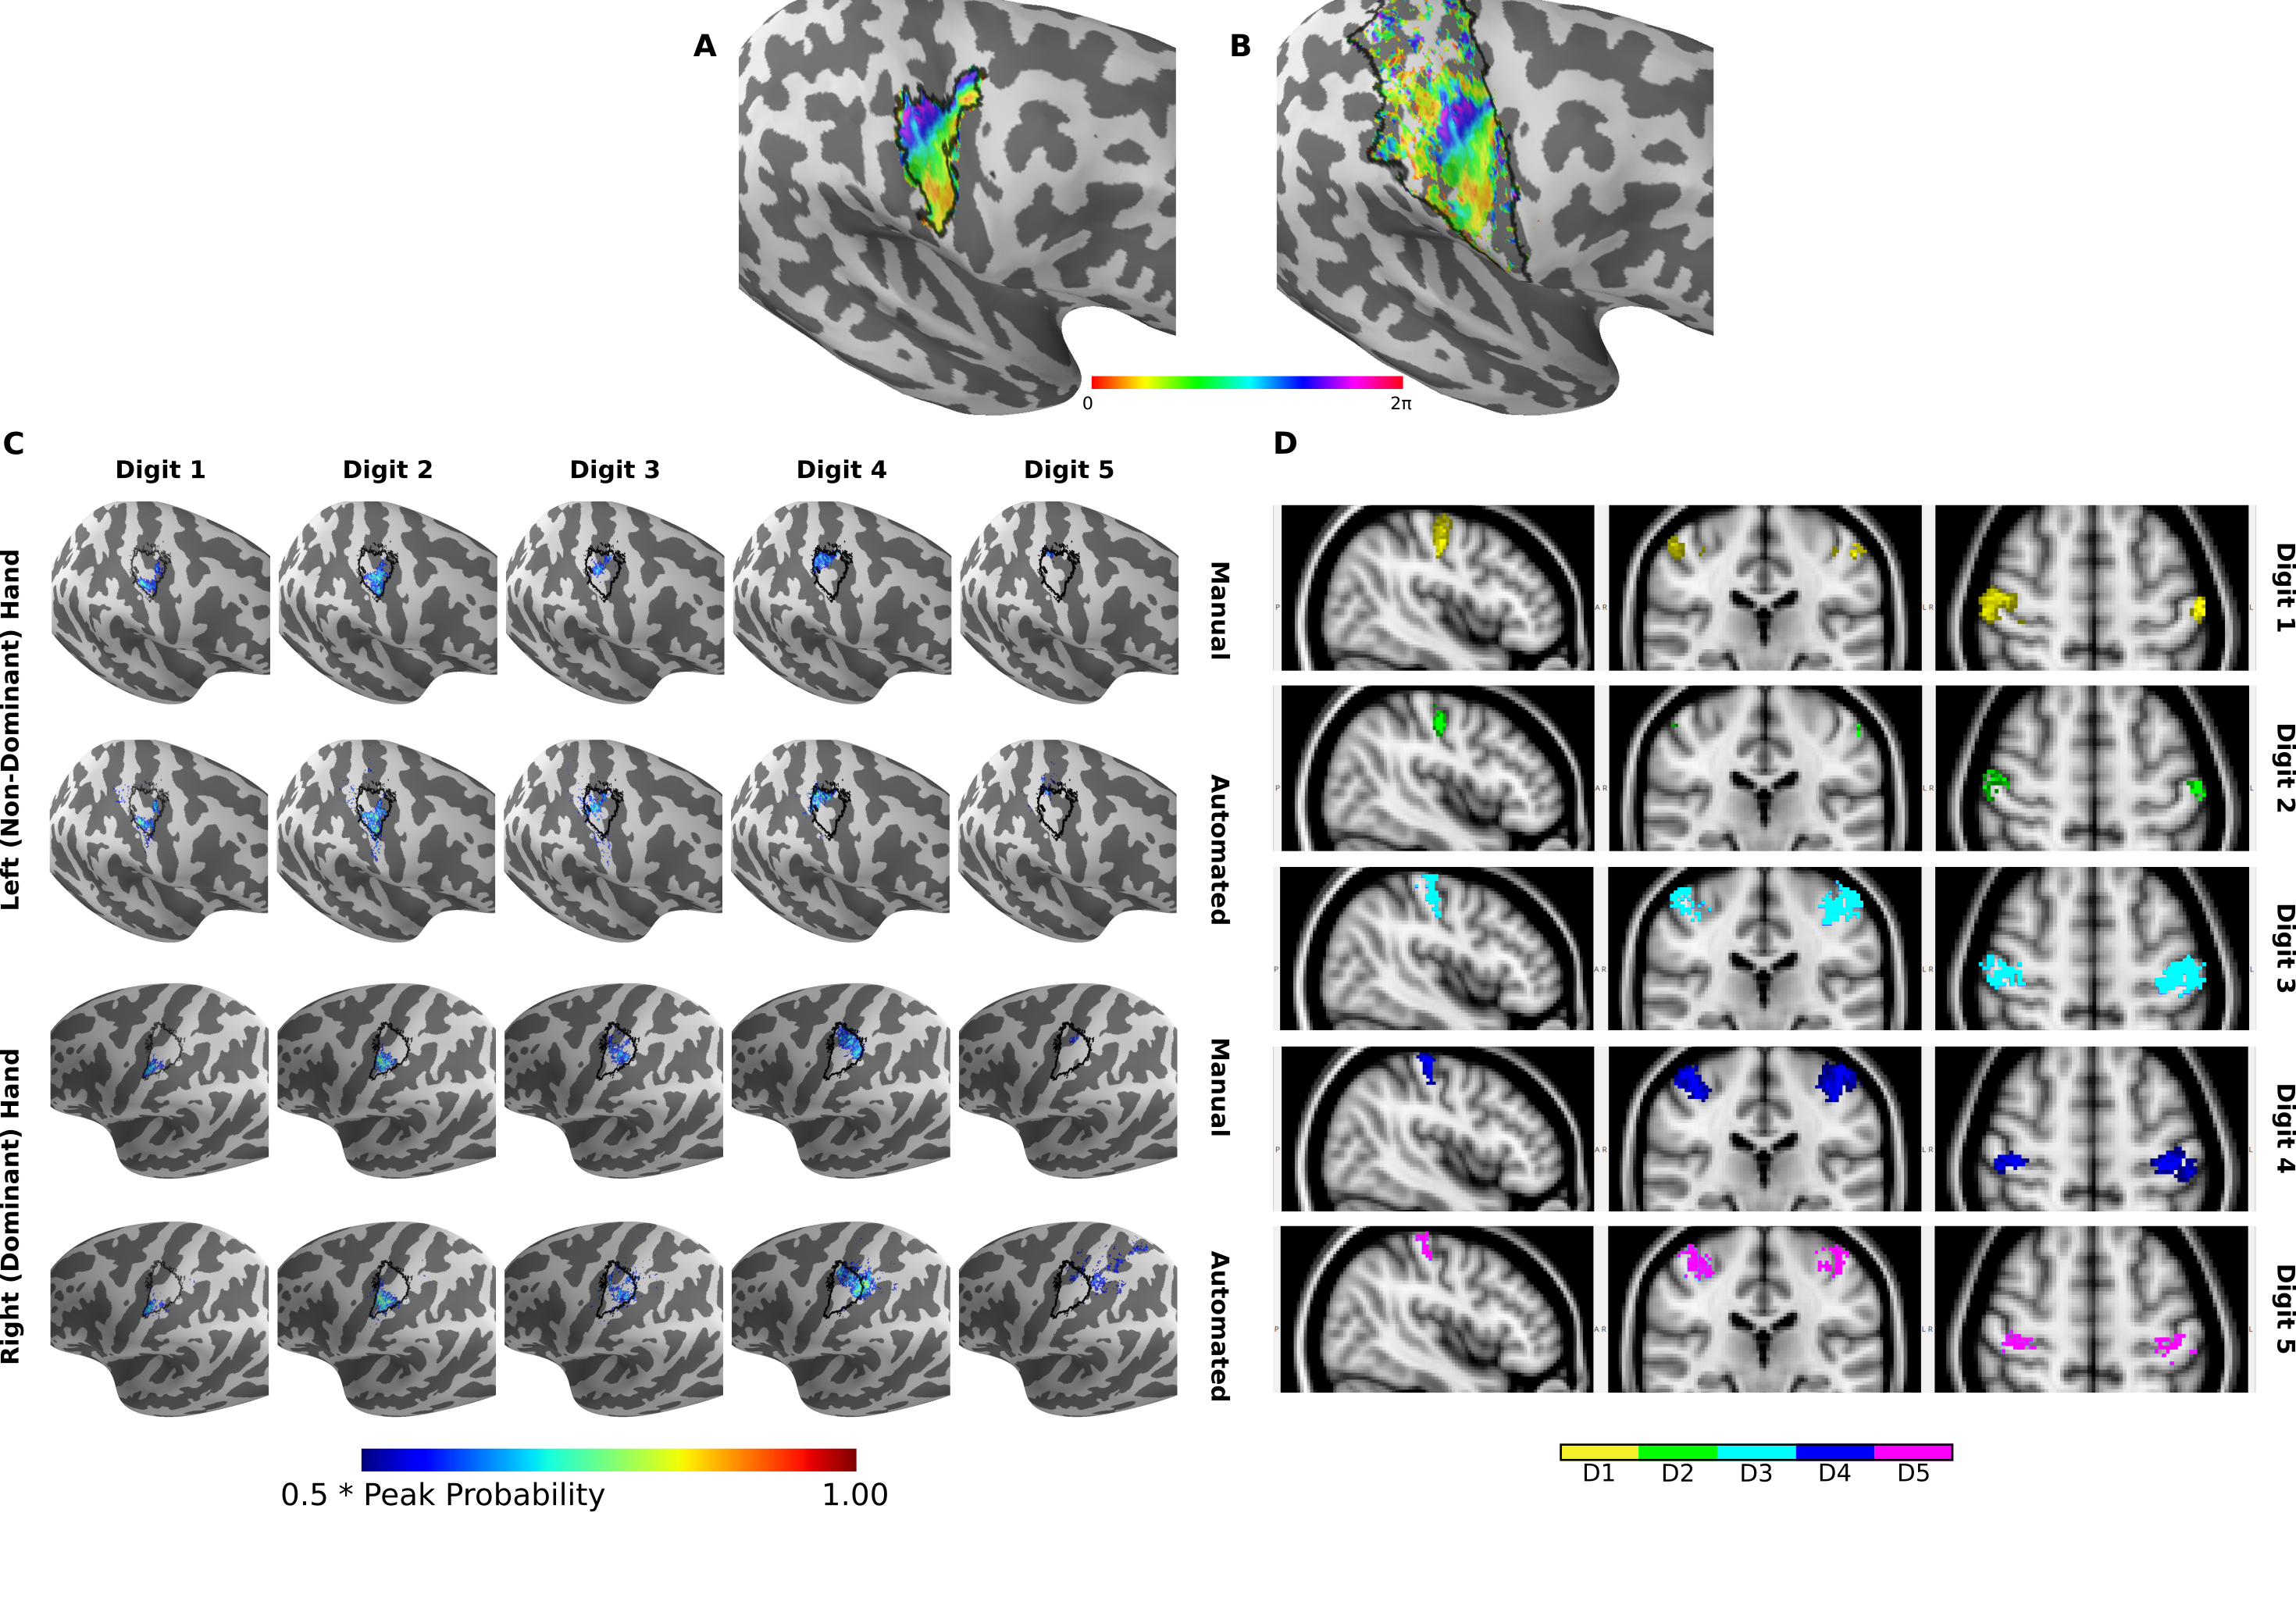
A:
Manual and B:
automated delineation on an individual subject's cortical surface
before phase-binning to create digit ROIs. C:
Surface based analysis (SBA) Full Probabilistic Maps for individual
digits using the manual and automated method, black outline shows the
probabilistic hand ROI threshold at 0.5 peak probability. The peak
probability is the maximum value across all coordinates in FPMs in a
given digit ROI. The SBA FPM are shown threshold at 0.5*peak
probability for each digit ROI. D:
Volume based analysis
(VBA) of FPMs, each digit is threshold at 0.5*peak probability.
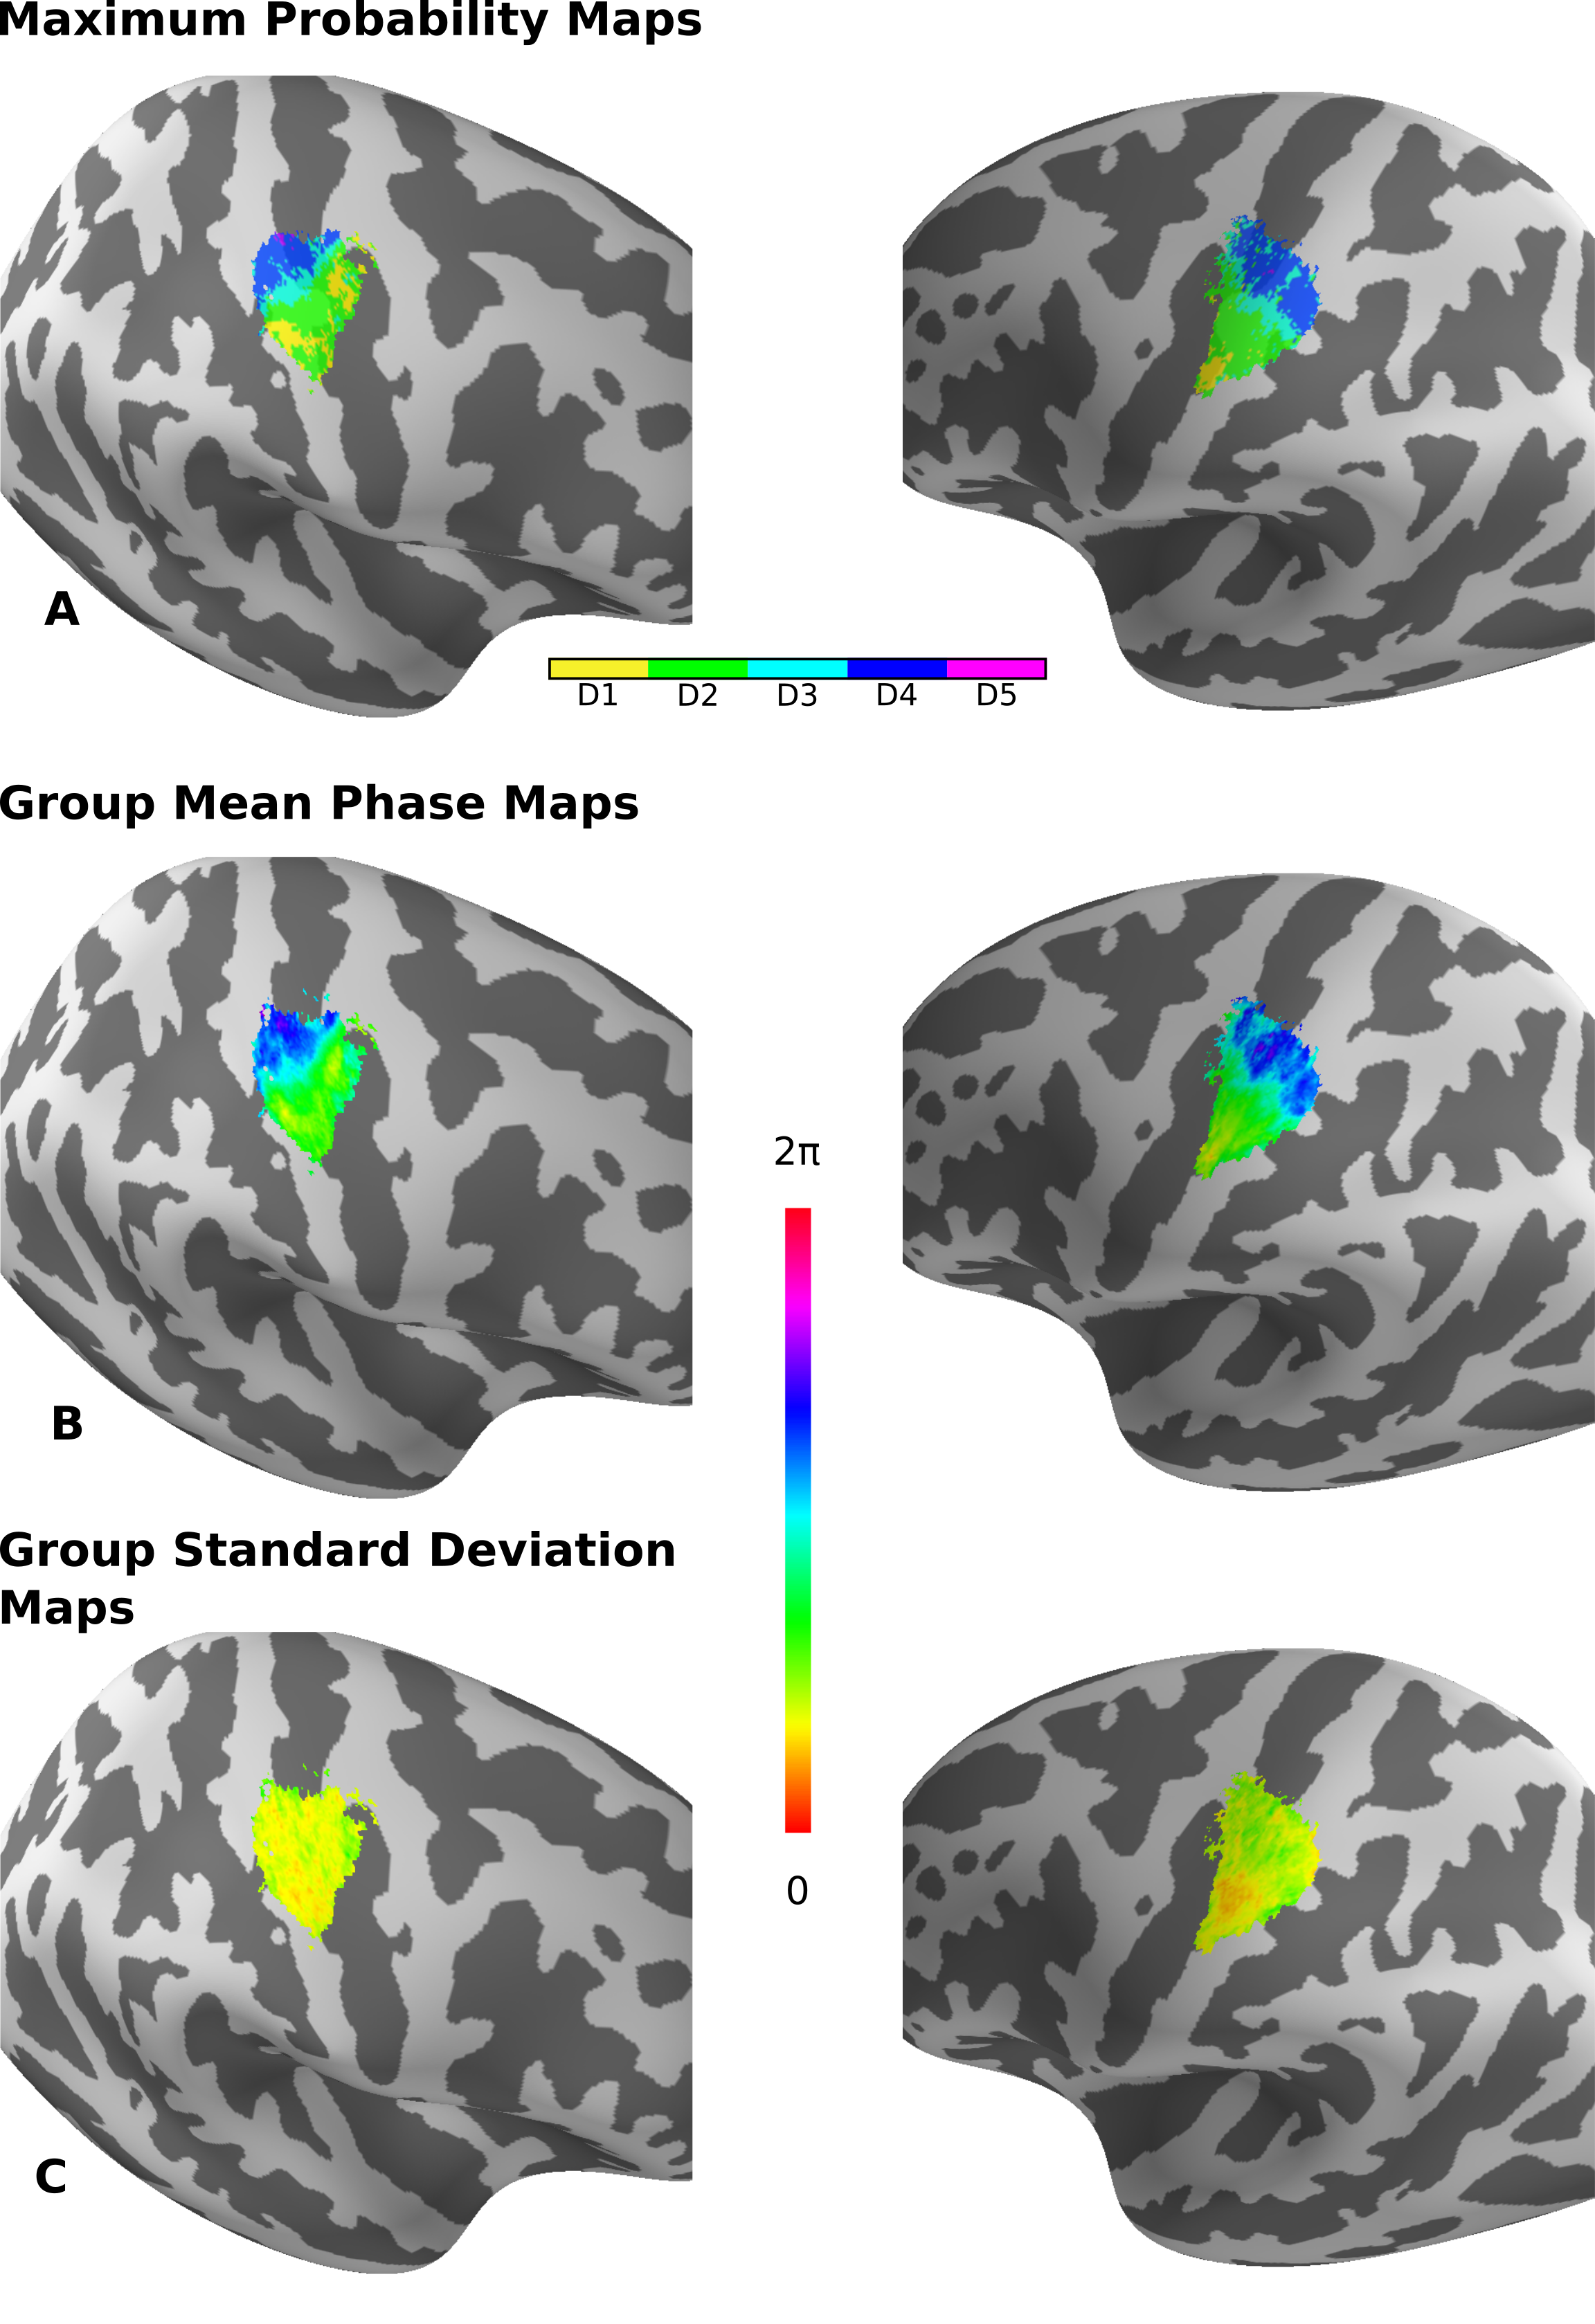
A:
Maximum probability maps were
calculated by assigning each coordinate to the ROI showing the
highest probability across all other areas. The MPMs generate strict
borders between adjacent ROIs. Note, the representation of D5
obtained this way was negligible due to the limited overlap in D5
ROIs across subjects. B:
group mean phase maps across subjects and C:
the corresponding standard deviation.
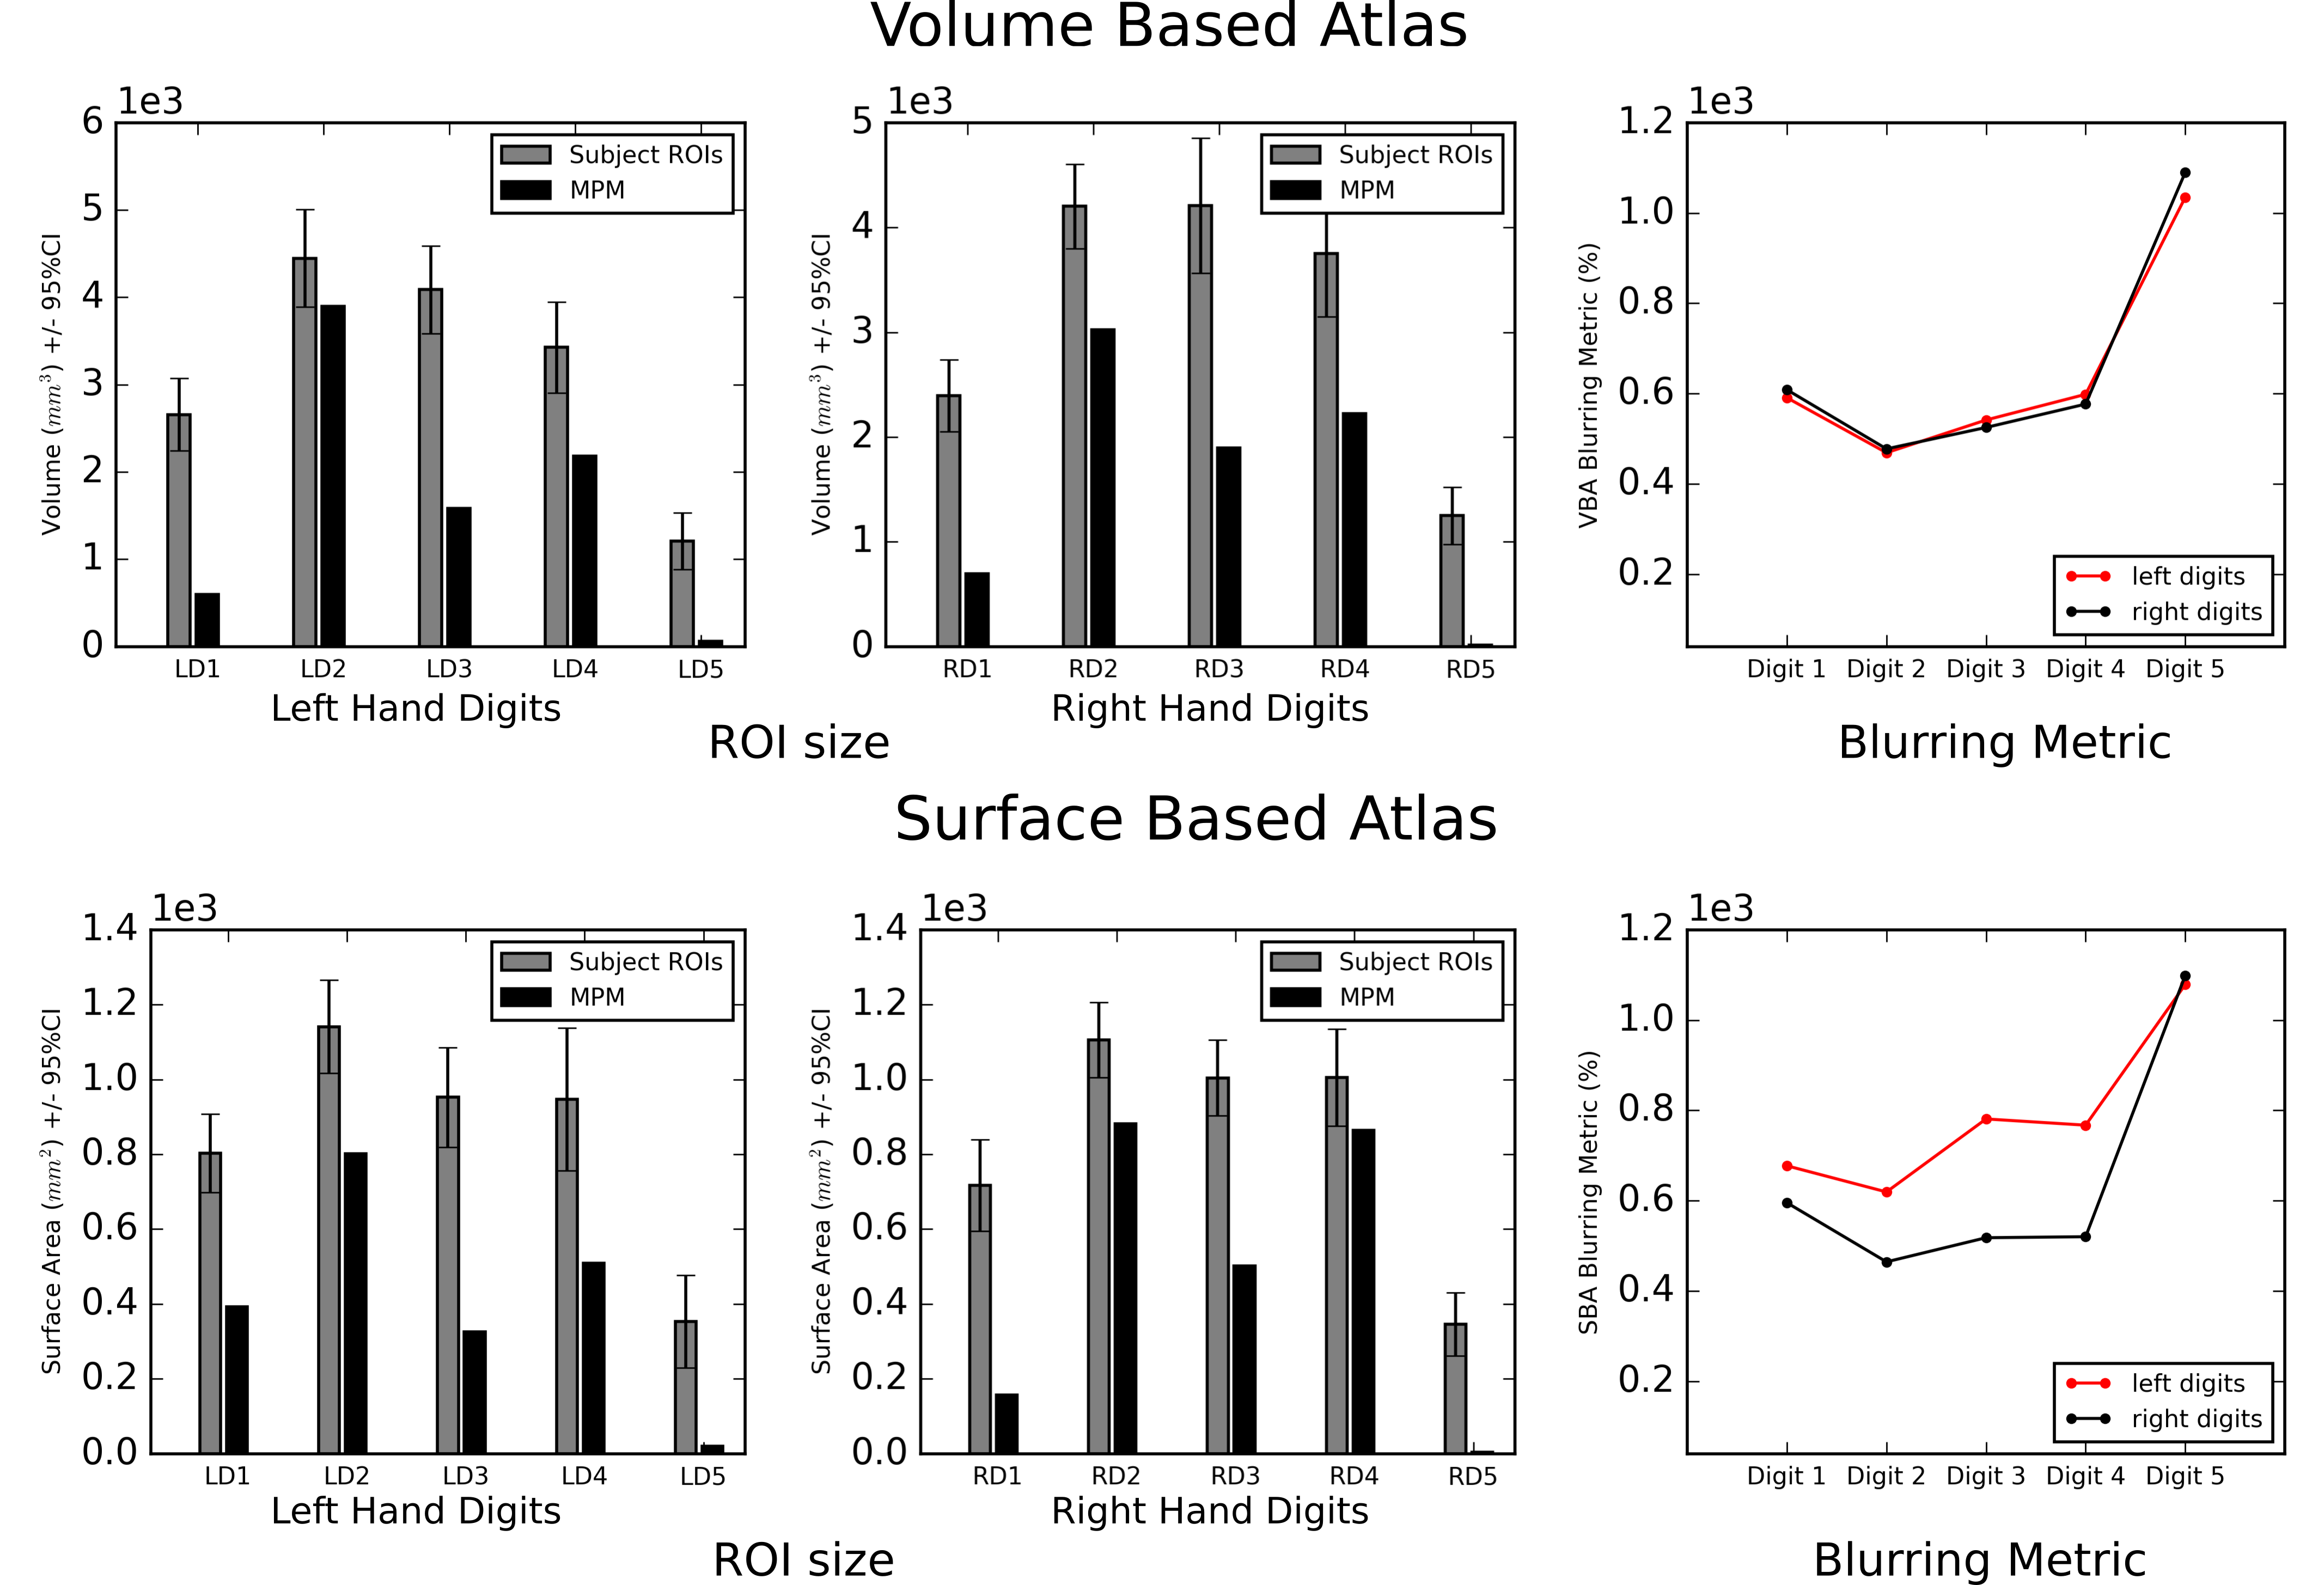
Digit ROI sizes calculated from the mean
number of coordinates, voxels or vertices, across individual subjects
in volumetric and surface space respectively. The trend in digit ROI
size computed across individual subjects is consistent with that
computed from the maximum probability map (MPM). The blurring metric
indicates the expansion of the pooled ROI size relative to mean ROI
size across subjects. This can be seen to be largest for D5, in both
hands, indicating that D5 representation shows the highest
variability across subjects. Also note the blurring metric is larger
for the left, non-dominant hand, compared to right, dominant hand.
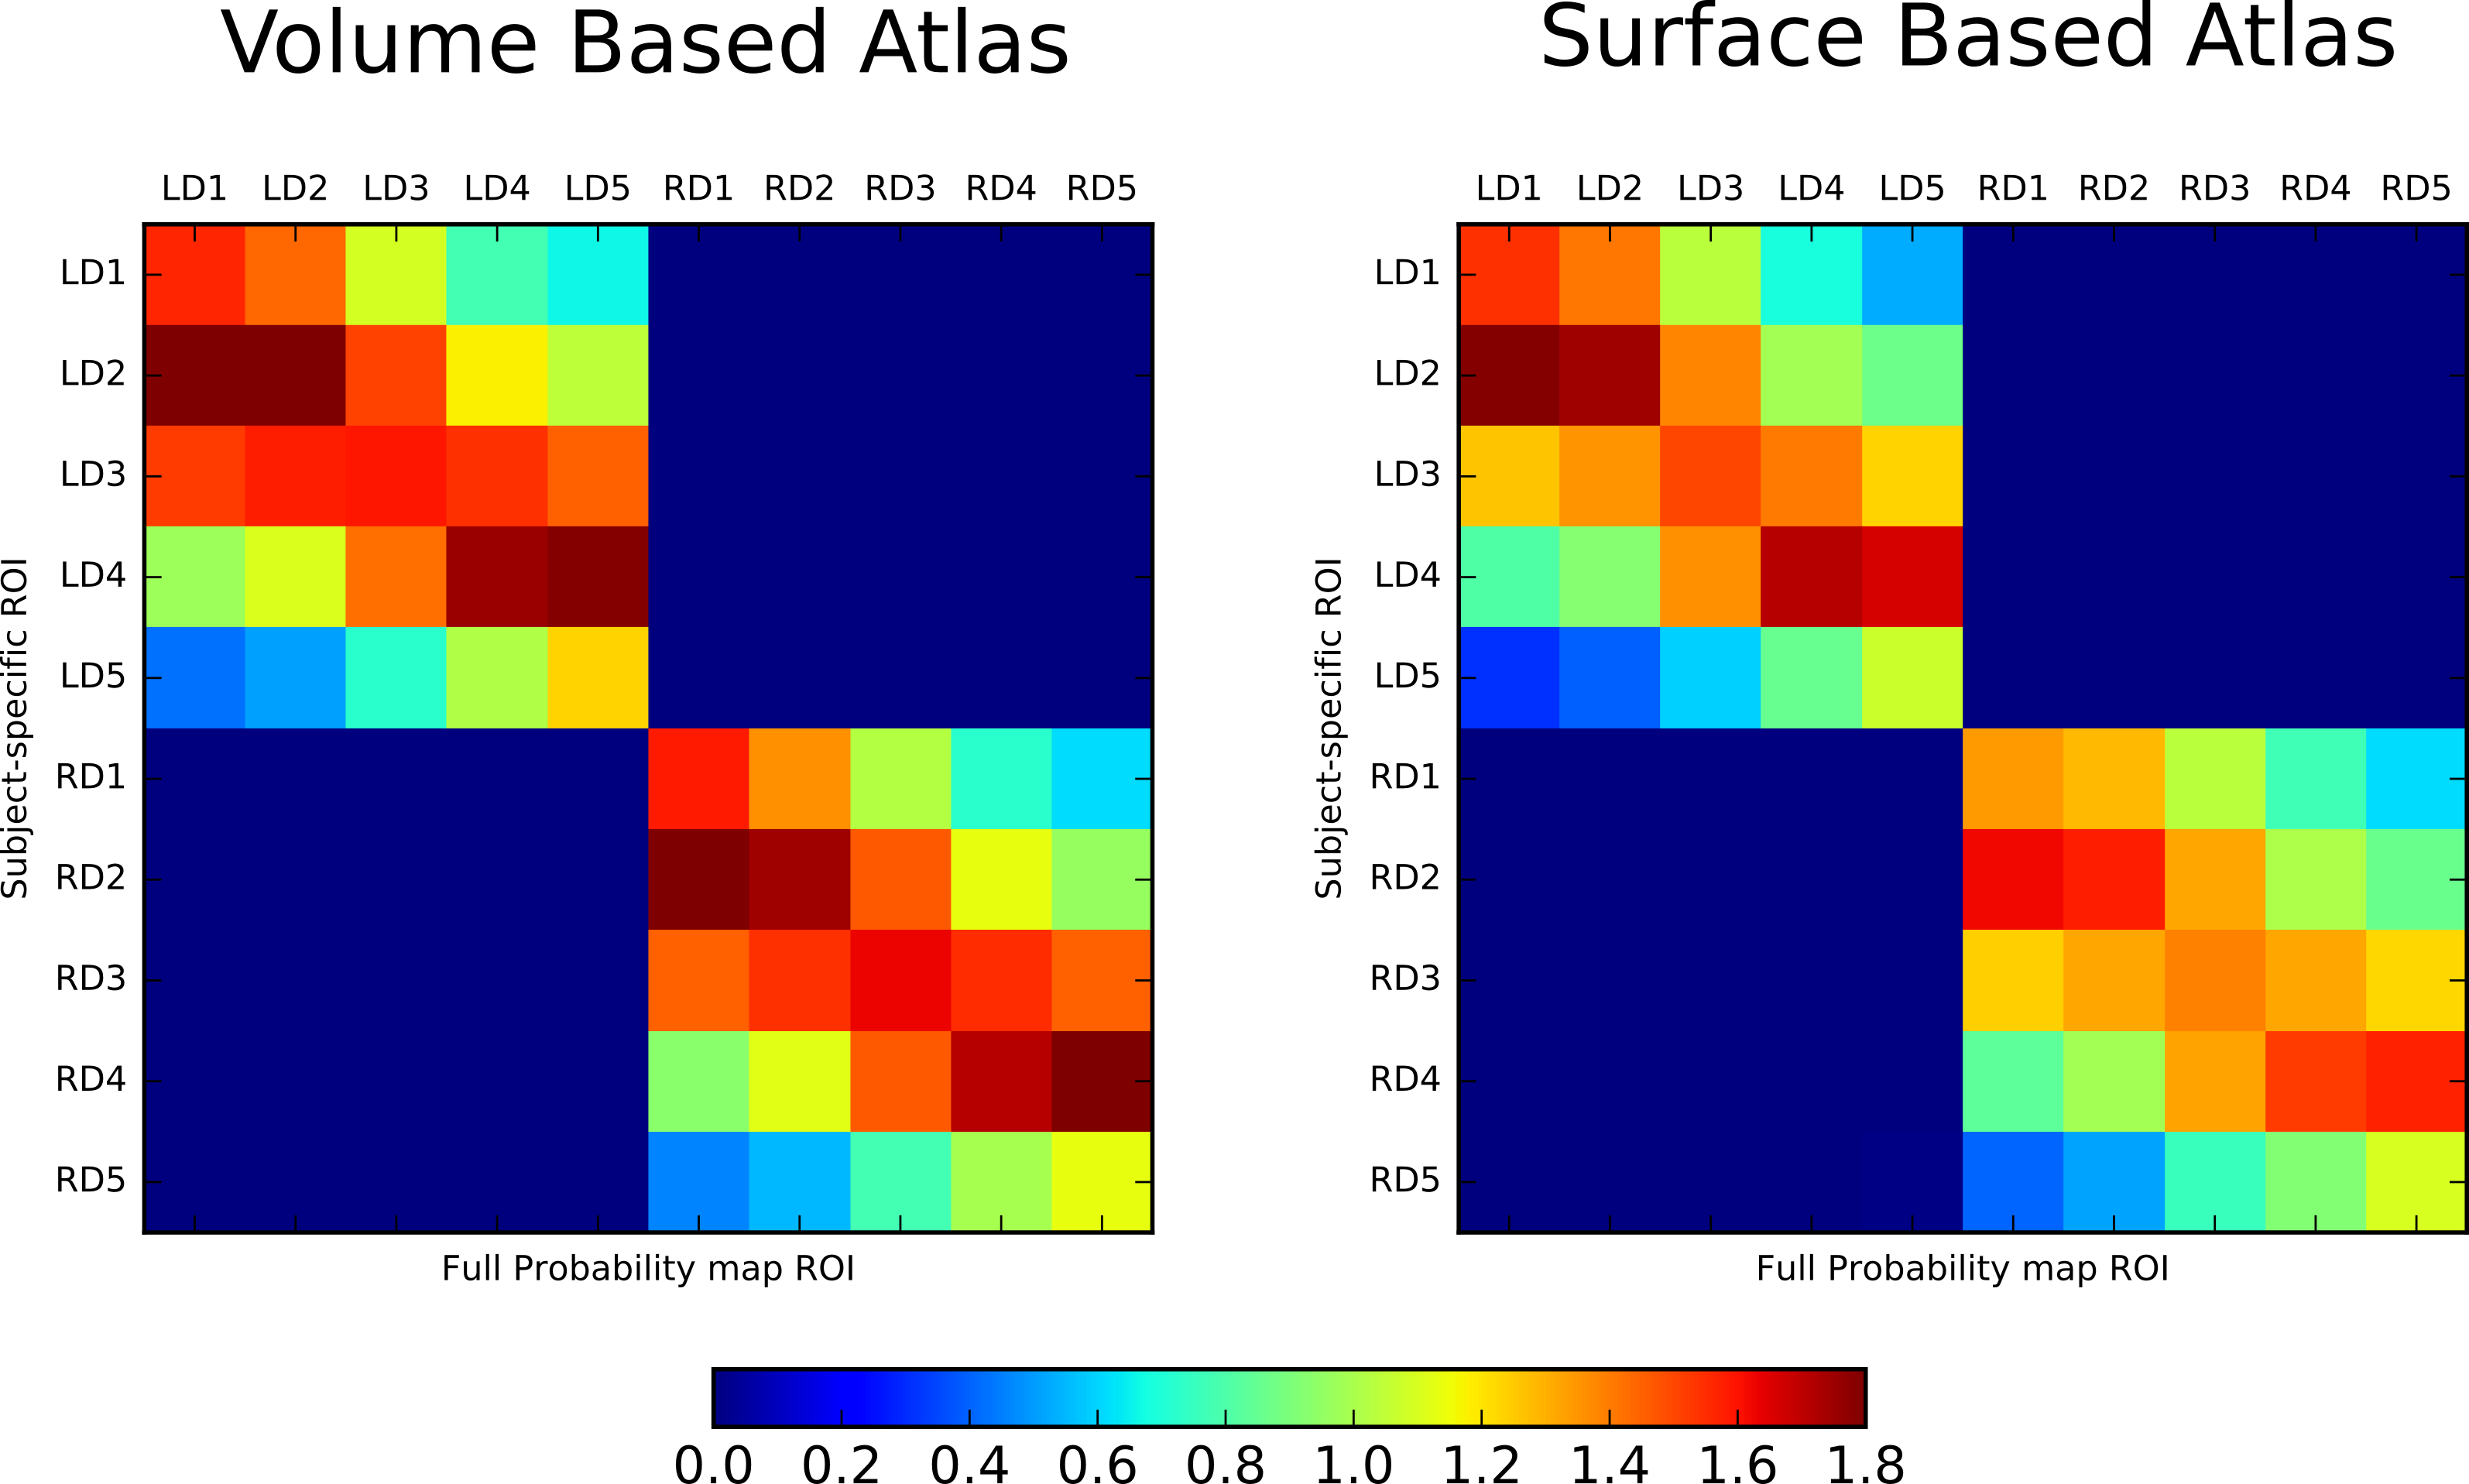
Leave-one-out validation using central tendency metric. Central
tendency for a given digit ROI calculated as the ratio of mean
probability distribution for all the ROI coordinates from a single
subject and the overall probability distribution for the FPM
(calculated excluding the current subject) of the corresponding digit
ROI. A higher central tendency (>1) indicates that the ROI from
the single subject is at a central location with respect to that of
the FPM. This procedure validates the use of the FPM for use with new
subjects that have not contributed to the atlas creation.